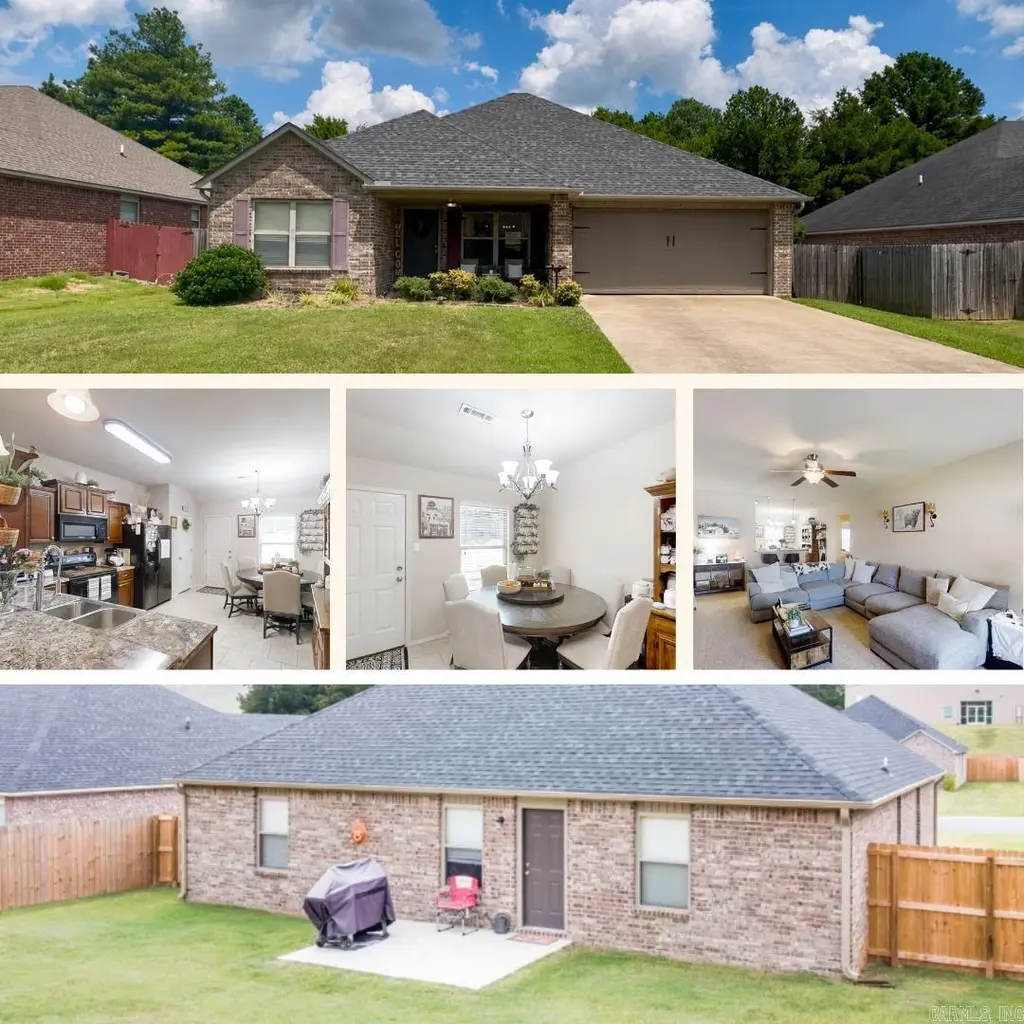
4064 Gabriel Ct · Jonesboro, AR
Flood risk 1/10 · Minimal
- FEMA flood zone
- X
- Chance of flooding over 30 yrs
- 0.0%
- Est. flood insurance / yr
- $507 – $1,088
Fire risk 3/10 · Minor
- Est. fire insurance / yr
- $1,499 – $2,785
Heat risk 5/10 · Moderate
- Hot days now (above 108°F)
- 7 days/yr
- Hot days in 30 yrs
- 21 days/yr
Wind risk 4/10 · Minor
- Chance of severe wind over 30 yrs
- 8.0%
Air-quality risk 2/10 · Minimal
- Unhealthy air days now
- 0 days/yr
- Unhealthy air days in 30 yrs
- 1 days/yr
Risk factors via First Street. Map © Google.
Why this score? — see what drove the C- grade
The composite is a weighted blend of 9 inputs, each scored 0–100. Each bar is that input's sub-score; the figure is the points it added to the 100-point composite (weight × sub-score).
- ARV discount +15.0/15.0
- Cash flow +11.6/30.0
- Appreciation +9.7/10.0
- DSCR +3.4/10.0
- Livability +3.2/5.0
- Rent growth +2.5/5.0
- Condition / age +2.5/5.0
- 1% rule +2.3/10.0
- Schools +1.9/10.0
$249,900
🖨 Deal sheet (PDF) 📄 Offer letter ✓ Due diligence
Listing remarks MLS
This move-in ready 4 bedroom, 2 bathroom home has 1,724 SqFt and sits on 0.18+/- of an acre. Additional features include a fenced in backyard, a 10x12 back patio, a covered front porch, and a 2-car garage. Inside you'll find a large living room, plenty of cabinets in the kitchen plus a pantry, and natural lighting throughout. Conveniently located near NEA Hospital and Arkansas State. Call to set a showing today!!
Key facts
- Covered front porch
- Natural lighting
- Fenced in backyard
Tags
Neighborhood map
What this means for you Summary
Snapshot
- This is a 4-bed/2.0-bath single-family listed at $250k.
Deal economics
- At list price, monthly cash flow is $-77 ($-930/yr) — negative.
- To cash-flow at today's rent, offer at most $236k (5.5% below list).
- To meet the 1% rule (rent ≥ 1% of price), the offer needs to be $183k (26.8% below list).
- Recommended offer: $183k (26.8% below list) — sets the bar for 1% rule.
- Cap rate 5.9% vs local median 4.4% in Jonesboro — top-decile yield for the area; either an underpriced asset or a hidden risk that comps aren't pricing in. Stress-test before assuming the spread holds.
Location & tenants
- Location reads 65/100 on livability (#145 in AR) — a middle-class / working-renter tenant base. Strengths: cost of living A+, housing A+, health & safety A+; Watch: crime F, amenities F, commute F.
- Nettleton School District (urban): math 21% / reading 24% proficiency, ranked #199 of 238 in AR (top 84%) — low school quality limits family demand, transient renter base, plan for 1-2y turnover.
- Zoned schools: Nettleton Junior High School (math 21% / reading 31%, grade F, #159 of 201 statewide, top 80%, 546 students, 100% FRL); Nettleton High School (math 11% / reading 27%, grade F, #248 of 292 statewide, top 86%, 981 students, 68% FRL) — zoned schools average 84% FRL vs 56% district-wide (28 pts higher); higher-poverty schools than district average — tighter screening recommended.
- Market conditions: 150 active listings in the ZIP; 4 comparable units currently listed for rent nearby; rentals lingering (median 46d on market — plan ~5-8 weeks vacancy on turnover, expect pricing pressure); 100% of comp listings sitting > 30 days — soft ceiling on asking rent; solid renter incomes; 926 units permitted in Craighead County in 2024 (69 in 5+ unit buildings).
Forward outlook
- In year one you build about $25k of equity ($2k loan paydown + $24k appreciation (9.4% local appreciation)).
- Craighead County population projected at +38% by 2050 — long-run rental-demand tailwind backs the buy-and-hold thesis.
- At projected returns (9.4% appreciation + 3.0% rent growth), your $70k cash investment doubles in ~3 years — after that, you're playing with house money.
- By year 2, paydown + projected appreciation supports a ~$41k cash-out refi (75% LTV) — recoverable capital for the next deal without selling this one.
Negotiation context
- It's been on market 233 days — a 12% lower offer ($220k) is reasonable based on typical stale-listing flexibility.
- 7 sale attempts since 10y ago with the ask held roughly flat each time — persistent listings suggest the price (not the market) is what's stuck; bring a comps-based counter.
- Current owner paid $165k; list at $250k implies a 51% gain — meaningful room to come down on a strong offer.
Risks & watch-outs
- Climate carrying-cost: extreme-heat days projected 7→21/yr by 2055 (HVAC capex compounding) — expect insurance premiums to compound above CPI over the hold.
Questions for the listing agent
- What do current leases actually rent for vs. the listed asking? Can we see a recent rent roll and the last 12 months of T-12 income?
- It's been on market 233 days. Have you received any prior offers? Is the seller open to a 27% concession, seller financing, or rate buy-down credit?
- Why hasn't it sold? Are there any deal-killer items the seller is aware of (foundation, flood, title, zoning, code violations)?
- Is there a deadline driving the sale (1031 exchange, divorce, estate, relocation)? That informs how much negotiation room exists.
- Schools are D-rated, which usually means shorter tenancies and higher turnover. Who's the typical renter profile here, and what's been the actual vacancy rate?
- Crime grade is F in this area — have there been break-ins, vandalism, or insurance claims at this property in the last 3 years? What carrier currently insures it and at what premium?
- What's the average days-on-market for RENTAL listings here right now (not sales)? A rising rental-DOM trend means longer vacancies and softer asking-rent achievability than the comps imply.
- What's the recent tenant-quality profile in this submarket — average credit score on applications, eviction rate, late-payment / NSF rate, and stable-employment percentage? A property-management company in the area should have these aggregated.
- How much new for-sale + rental construction is in the pipeline within 1–3 miles? Heavy new supply typically softens prices + rents 12–24 months out; constrained supply supports both.
Investment metrics
- 1% rule
- 0.73% ✗
- Cap rate
- 5.92%
- Cash-on-cash
- -1.33%
- DSCR
- 0.94
- GRM
- 11.4
CMA / ARV
- ARV (median comp)
- $316,343
- List price
- $249,900
- Delta
- -21.00%
- Verdict
- UNDERPRICED
- Comps
- 20 within 1.0 mi
Show comp detail 12 sales within ~0.75 mi
| Address | Dist | Beds/Ba | Sqft | Sold | Price | $/sf | Match |
|---|---|---|---|---|---|---|---|
| 4117 Bobcat Meadow Ln | 0.42mi | 3/2.0 (-1) | 1,699 (-2%) | 1mo | $284,900 | $168 | 72 |
| 1009 Cypress Springs Cv | 0.45mi | 3/2.0 (-1) | 1,788 (+4%) | 0mo | $255,000 | $143 | 68 |
| 4307 Cypress Springs Rd | 0.54mi | 3/2.0 (-1) | 1,680 (-3%) | 1mo | $255,000 | $152 | 65 |
| 280 Prospect Farm Ln | 0.58mi | 3/2.0 (-1) | 1,698 (-2%) | 1mo | $246,900 | $145 | 64 |
| 4837 Edgemont Dr | 0.65mi | 4/2.0 | 1,819 (+6%) | 2mo | $294,990 | $162 | 59 |
| 4811 Yukon Dr | 0.69mi | 3/2.0 (-1) | 1,680 (-3%) | 1mo | $235,000 | $140 | 58 |
| 4145 Lynx | 0.49mi | 3/2.0 (-1) | 1,887 (+10%) | 2mo | $303,900 | $161 | 55 |
| 4208 Bobcat Meadow Ln | 0.47mi | 3/2.0 (-1) | 1,911 (+11%) | 2mo | $297,500 | $156 | 54 |
| 712 Edgemont Cir | 0.75mi | 3/2.0 (-1) | 1,672 (-3%) | 2mo | $283,990 | $170 | 53 |
| 300 Prospect Trl | 0.66mi | 3/2.0 (-1) | 1,924 (+12%) | 1mo | $125,000 | $65 | 44 |
| 4829 Edgemont Dr | 0.62mi | 3/2.0 (-1) | 1,510 (-12%) | 2mo | $256,000 | $170 | 43 |
| 4769 Wildwood Ln | 0.66mi | 3/2.0 (-1) | 1,473 (-15%) | 1mo | $209,900 | $142 | 39 |
Match score weights: distance 35% · size 25% · config 20% · recency 20%. Top-matched comps best support the ARV.
Projected returns pro-forma
9.42% appreciation · 3.0% rent growth · sell at horizon
- IRR
- 22.1%
- Equity multiple
- 2.73×
- Total profit
- $121,199
- Equity at exit
- $214,631
- IRR
- 19.9%
- Equity multiple
- 6.12×
- Total profit
- $358,286
- Equity at exit
- $452,124
Cash invested: $69,972 (down + closing). Projections, not guarantees.
Landlord ↔ Tenant lean methodology
- Overall (STATE)
- 92 Strongly Landlord-Friendly
- State Arkansas
- 92 Strongly Landlord-Friendly · R+14
- County
- — inherits STATE
- City
- — inherits STATE
ZIP-level market 72405
- Home prices YoY
- 3.5%
- Active inventory
- 150
- Price-to-rent
- 11.4×
Monthly cashflow live
- Estimated rent
- $1,828 medium interval (Pro) →
- Mortgage (P&I)
- −$1,311
- Tax from tax record
- −$107 /mo · $1,288/yr
- Insurance
- −$104
- HOA
- −$0
- Vacancy / Maint / Mgmt
- −$384
- Net cashflow
- $-77
Break-even live
Sensitivity live
| Price | -10% $64 | -5% $-7 | +0% $-77 | +5% $-148 | +10% $-219 |
|---|---|---|---|---|---|
| Rent | -10% $-222 | -5% $-150 | +0% $-77 | +5% $-5 | +10% $67 |
| Rate | -1.0pp $48 | -0.5pp $-14 | base $-77 | +0.5pp $-142 | +1.0pp $-208 |
UW: 25.0% down · 7.5% · 30yr · 1.5% tax · 5.0% vac · 8.0% maint · 8.0% mgmt
Financing live
Cash to close
- Down payment
- $62,475
- Closing costs
- $7,497
- Reserves months
- —
- Total cash needed
- —
Loan-product check · same deal, 3 products live
Conventional
25% down · 7.5% · 30yr
- Down + closing
- —
- Monthly P&I
- —
- Monthly cashflow
- —
- DSCR
- —
- Eligible?
- —
Personal DTI + credit; lowest rate.
DSCR
20% down · 8.5% · 30yr
- Down + closing
- —
- Monthly P&I
- —
- Monthly cashflow
- —
- DSCR
- —
- Eligible?
- —
No personal income docs; deal must DSCR.
Hard money
10% down · 12.0% · 12mo
- Down + closing
- —
- Monthly P&I
- —
- Monthly cashflow
- —
- DSCR
- —
- Eligible?
- —
Short-term bridge; refi at stabilization.
Rent comps 4 comps
| Address | Beds | Baths | Sqft | Rent | $/sqft | DOM | Units | Dist |
|---|---|---|---|---|---|---|---|---|
| 337 Wolf Den Dr Jonesboro, AR | 3.0 | 2.0 | 1419 | $1,600 | $1.13 | 45d | 1 | 0.38mi |
| 259 Wolf Den Dr Jonesboro, AR | 3.0 | 2.0 | 1419 | $1,550 | $1.09 | 45d | 1 | 0.51mi |
| 5408 Mariposa Grove Dr Jonesboro, AR | 3.0 | 2.0 | 1209 | $1,595 | $1.32 | 45d | 1 | 1.35mi |
| 500 N Caraway Rd Jonesboro, AR | 2.0–3.0 | 2.0–3.0 | 1000 | $1,099 | $1.10 | 45d | 1 | 1.50mi |
Listing history 35 events
-
2026-06-21days on market $249,900 Active 233 DOM
-
2026-06-19days on market $249,900 Active 231 DOM
-
2026-06-18days on market $249,900 Active 230 DOM
-
2026-06-17days on market $249,900 Active 229 DOM
-
2026-06-16days on market $249,900 Active 228 DOM
-
2026-06-15days on market $249,900 Active 227 DOM
-
2026-06-14days on market $249,900 Active 225 DOM
-
2026-06-13days on market $249,900 Active 224 DOM
-
2026-06-10days on market $249,900 Active 222 DOM
-
2026-06-09days on market $249,900 Active 221 DOM
-
2026-06-08days on market $249,900 Active 220 DOM
-
2026-06-07days on market $249,900 Active 219 DOM
-
2026-06-05days on market $249,900 Active 216 DOM
-
2026-06-03days on market $249,900 Active 215 DOM
-
2026-06-02days on market $249,900 Active 214 DOM
-
2026-06-01days on market $249,900 Active 213 DOM
-
2026-05-31days on market $249,900 Active 212 DOM
-
2026-05-30days on market $249,900 Active 211 DOM
-
2025-10-31$249,900 Active 416-char remark
Show marketing remark (416 chars)
This move-in ready 4 bedroom, 2 bathroom home has 1,724 SqFt and sits on 0.18+/- of an acre. Additional features include a fenced in backyard, a 10x12 back patio, a covered front porch, and a 2-car garage. Inside you'll find a large living room, plenty of cabinets in the kitchen plus a pantry, and natural lighting throughout. Conveniently located near NEA Hospital and Arkansas State. Call to set a showing today!!
-
2025-10-31historical
Show marketing remark (416 chars)
This move-in ready 4 bedroom, 2 bathroom home has 1,724 SqFt and sits on 0.18+/- of an acre. Additional features include a fenced in backyard, a 10x12 back patio, a covered front porch, and a 2-car garage. Inside you'll find a large living room, plenty of cabinets in the kitchen plus a pantry, and natural lighting throughout. Conveniently located near NEA Hospital and Arkansas State. Call to set a showing today!!
-
2025-10-31$249,900 New Listing
Show marketing remark (416 chars)
This move-in ready 4 bedroom, 2 bathroom home has 1,724 SqFt and sits on 0.18+/- of an acre. Additional features include a fenced in backyard, a 10x12 back patio, a covered front porch, and a 2-car garage. Inside you'll find a large living room, plenty of cabinets in the kitchen plus a pantry, and natural lighting throughout. Conveniently located near NEA Hospital and Arkansas State. Call to set a showing today!!
-
2025-08-14price $249,900
-
2025-08-14price $249,900
-
2025-06-30$259,900 Active
-
2025-06-30$259,900 New Listing
-
2019-08-12soldstatus $165,000
-
2019-08-09soldstatus $165,000
-
2019-03-25$169,900
-
2018-01-09soldstatus $268,876
-
2017-12-28soldstatus $903,037
-
2017-09-15$162,900
-
2017-08-09soldstatus $153,750
-
2017-06-02soldstatus $147,900
-
2017-06-02soldstatus $147,900
-
2016-06-27$147,900
ⓘ Source: listings_history table (triggers on properties + properties_extension) + one-shot
backfill from property_details.listing_events for pre-trigger history.
Tax reassessment forecast AR · Resets to sale price
- Current annual tax
- $1,288 · $107/mo
- Projected year-2 tax
- $1,599 · $133/mo
- Expected delta
- +$311/yr (+$26/mo · 24.1%)
ⓘ Screening estimate from a state-policy table — verify with the county assessor before closing.
Climate risk First Street
- Flood 1/10 Low FEMA zone X · 0% chance over 30 yrs
- Wildfire 3/10 Moderate
- Heat 5/10 Major 7 d/yr ≥108°F today · 21 d/yr by 30 yrs out
- Wind 4/10 Moderate 8% chance of damaging wind over 30 yrs
- Air quality 2/10 Low 0 unhealthy d/yr today · 1 by 30 yrs out
Nearby sold comps map
Loading sold comps map…
Walkable amenities ~0.75 mi
Loading nearby amenities…
Taxation est. · year 1
- Rental income
- $21,942
- − Mortgage interest
- −$13,998
- − Property taxes
- −$1,288
- − Insurance
- −$1,250
- − Repairs & maintenance
- −$1,755
- − Management
- −$1,755
- − Depreciation
- −$7,270
- Taxable loss
- −$5,375
- Est. tax savings @ 24.0%
- +$1,290
- After-tax cash flow
- $360/yr
For passive investors: Depreciation is non-cash, so a rental often shows a tax loss while cash-flowing — sheltering income. Rental losses are passive: they offset passive income freely, and up to $25,000/yr can offset ordinary (W-2) income if you actively participate and your MAGI is under $100k (phasing out to $0 by $150k); unused losses carry forward. On sale, claimed depreciation is recaptured at up to 25%, and gains may owe capital-gains tax (a 1031 exchange can defer both). Figures are a year-1 estimate at your 24.0% rate — not tax advice; consult a CPA.
Schools (NCES district)
- District
- Nettleton School District
- NCES district ID
- 0510440
- Math proficiency
- 21% ▼ -16.00%
- Reading proficiency
- 24% ▼ -12.00%
- Median HH income
- $39,754
- Composite
- 19.0/100
- National rank
- #8846
- State rank
- #199 of 238 in AR
Livability — Jonesboro
- Score
- 65/100
- State rank
- #145
- US rank
- #12692
Category grades
Schools grade is shown separately in the Schools card above.
Census & demographics
- Census place
- Jonesboro, AR
- County
- Craighead County · 97,185 people
- City population
- 91,245
- Metro
- Jonesboro, AR
- Population (ZIP)
- 18,675
- Household income
- $92,440
- Rent vs Own
- Severe rent burden
- 443.0
Population outlook (Craighead County) Hauer SSP2
- Today (2025)
- 122,235 people
- By 2030
- 131,338 · +7.4%
- By 2040
- 149,862 · +22.6%
- By 2050
- 168,034 · +37.5%
- By 2075
- 208,094 · +70.2%
- By 2100
- 233,251 · +90.8%
Race, ethnicity, and origin ACS 2023
- Neighborhood character
- Predominantly White (78%)
- Race & ethnicity
- White 78% Two or more races 10% Black 9% Hispanic / Latino 3% Asian 1%
- Common ancestry
- Slovak 2% Italian 1% Serbian 1%
- Foreign-born
- 4% · Canada
- Languages at home
- 93% English-only · Spanish 4% Arabic 1%
Political lean MEDSL · Craighead
- 2024 margin
- Solid R (+37.4) · D 30.1% · R 67.5% · Other 2.4%
- 2008→2024 swing
- -12.9pp toward R · 2008: -24.5pp · 2024: -37.4pp
- All cycles
- 2024: R+37.4 2020: R+35.4 2016: R+35.2 2012: R+31.1 2008: R+24.5
Not yet ingested
- Civics
- —
Market trends
- HPI YoY
- ▲ 9.42%
- Current HPI
- 277.37
- Rent YoY
- —
- Metro
- Jonesboro, AR
- State GDP YoY
- ▲ 3.80%
- F500 in state
- 10
Industry mix (Fortune 500 HQ in AR)
| Industry | F500 HQs | Revenue |
|---|---|---|
| Retail | 1 | $681B |
|
||
| Food / Agriculture | 1 | $53B |
|
||
| Retail / Energy | 1 | $22B |
|
||
| Transportation / Logistics | 1 | $12B |
|
||
| Energy | 1 | $4B |
|
||
Price history
+69.0% since first listed17 events — show timeline
- 2025-10-31 Listed $249,900 NEABOR MLS
- 2025-10-31 Listed $249,900 CARMLS
- 2025-10-31 Listing Removed — CARMLS
- 2025-08-14 Price Changed $249,900 CARMLS
- 2025-08-14 Price Changed $249,900 NEABOR MLS
- 2025-06-30 Listed $259,900 NEABOR MLS
- 2025-06-30 Listed $259,900 CARMLS
- 2019-08-12 Sold (Public Records) $165,000 Public Records
- 2019-08-09 Sold (MLS) $165,000 NEABOR MLS
- 2019-03-25 Listed $169,900 NEABOR MLS
- 2018-01-09 Sold (Public Records) $268,876 Public Records
- 2017-12-28 Sold (Public Records) $903,037 Public Records
- 2017-09-15 Listed $162,900 NEABOR MLS
- 2017-08-09 Sold (Public Records) $153,750 Public Records
- 2017-06-02 Sold (Public Records) $147,900 Public Records
- 2017-06-02 Sold (MLS) $147,900 NEABOR MLS
- 2016-06-27 Listed $147,900 NEABOR MLS
Property tax history
+31.9%/yrLatest (2025): $1,288 · +12.9% YoY. Source: county tax records.
Cash-flow waterfall
monthlySold comps — $/sqft
last 12 mo · ≤1 miLoading sold comps…