 Triplex
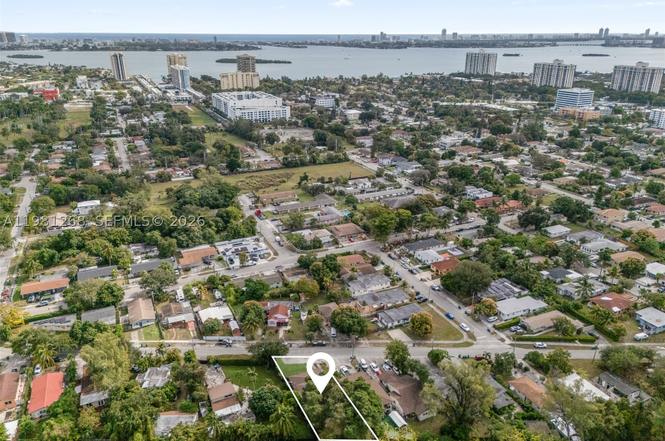
11330 Peachtree Dr · Biscayne Park, FL
Flood risk 5/10 · Moderate
- FEMA flood zone
- X (unshaded)
- Chance of flooding over 30 yrs
- 0.23%
- Est. flood insurance / yr
- $507 – $1,088
Fire risk 1/10 · Minimal
- Est. fire insurance / yr
- $947 – $1,759
Heat risk 10/10 · Severe
- Hot days now (above 103°F)
- 7 days/yr
- Hot days in 30 yrs
- 27 days/yr
Wind risk 10/10 · Severe
- Chance of severe wind over 30 yrs
- 99.0%
Air-quality risk 2/10 · Minimal
- Unhealthy air days now
- 1 days/yr
- Unhealthy air days in 30 yrs
- 2 days/yr
Risk factors via First Street. Map © Google.
Why this score? — see what drove the B- grade
The composite is a weighted blend of 9 inputs, each scored 0–100. Each bar is that input's sub-score; the figure is the points it added to the 100-point composite (weight × sub-score).
- Cash flow +29.4/30.0
- DSCR +10.0/10.0
- 1% rule +8.1/10.0
- ARV discount +7.5/15.0
- Schools +4.2/10.0
- Livability +3.9/5.0
- Condition / age +2.5/5.0
- Rent growth +2.3/5.0
- Appreciation +0.0/10.0
$899,000
🖨 Deal sheet (PDF) 📄 Offer letter ✓ Due diligence
Multi-family units
County records classify this as Multi-Family (2-4 Unit). Listing-text estimate: 3 units. confirmed
Listing remarks
Prime Investment Opportunity in North Miami! This income producing triplex is a standout! Ideally located right between Miami Shores and Biscayne Park , in a high growth area with significant city investment planned over the next few years. The property features a 2021 roof, updated kitchens and bathrooms, durable vinyl flooring, and modern appliances. Currently rented to long term tenants, this property delivers a strong cap rate. Don’t miss this chance to capitalize on North Miami’s growth potential!
Key facts
- 4 parking spots
- Built 1981
- Listed 102 days
Property features AI
Finance
- Other: Rent includes gardener
- Financial info: Total annual rental income reported: $76,800; Unit rents reported: two units at $2,000/month, one unit at $2,400/month; Two units are leased; one unit is month-to-month
- HOA & community:
Exterior
- Parking: Total of 4 parking spaces; Open parking for individual units
- Security:
- Utilities: Cable available; Public sewer
- Home design: 2-story building; Resale property; Zoning: 5700
- Construction: Block construction; Shingle roof
- Exterior features: Less than quarter acre lot; Open parking
Interior
- Kitchen:
- Bedrooms: Three 2-bedroom units (each unit listed with 2 bedrooms)
- Flooring: Vinyl
- Bathrooms: Each unit has 1 full bathroom
- Heating & cooling: Central heating; Central electric cooling
- Interior features: Vinyl flooring
- Laundry & utility:
Neighborhood map
What this means for you Summary
Snapshot
- This is a 3 × 2-bed/1.0-bath units multifamily listed at $899k.
Deal economics
- At list price, monthly cash flow is $3k ($38k/yr) — positive. Per door: $1k/mo.
- The deal already cash-flows at list — no discount required.
- Meets the 1% rule at list price ($12k rent vs $899k).
- Recommended offer: $818k (9.0% below list) — sets the bar for market timing.
Location & tenants
- Location reads 77/100 on livability (#208 in FL, #3,222 nationally) — a middle-class / working-renter tenant base. Strengths: crime A+, employment A+, health & safety A+; Watch: amenities F, cost of living F.
- Miami-Dade (suburban): math 45% / reading 54% proficiency, ranked #40 of 73 in FL (top 55%) — families likely to look elsewhere, expect single-tenant / working-renter base with shorter leases; 64% free/reduced lunch — lower-income household profile, screen leases tightly.
- Zoned schools: W. J. Bryan Elementary (math 28% / reading 40%, grade F, #1,744 of 2,144 statewide, top 82%, 622 students, 75% FRL); North Miami Middle School (math 25% / reading 31%, grade F, #486 of 571 statewide, top 86%, 807 students, 71% FRL); North Miami Beach Senior High (math 13% / reading 24%, grade F, #568 of 667 statewide, top 85%, 1,149 students, 66% FRL).
- Zoned-school proficiency averages 27% at this address vs 50% district-wide (-23 pts) — the specific schools serving this property underperform the Miami-Dade average; the district grade overstates school quality for this exact location.
- Market conditions: Rents soft (-0.7%/yr); 340 active listings in the ZIP; 3 comparable units currently listed for rent nearby; rentals at typical pace (median 15d on market — plan ~3-4 weeks tenant-placement turnaround); 10,051 units permitted in Miami-Dade County in 2024 (7,758 in 5+ unit buildings).
- At $11,787/mo this rent would consume 243% of the median local household income ($58k/yr) (locally 3226% of renters already pay >50% of income on rent) — very limited rent-growth headroom before tenants either downsize or default.
Forward outlook
- Local home prices are declining (-3.0%/yr); year-one equity from $6k of loan paydown is wiped out by about $27k of value loss. Plan a longer hold.
- Miami-Dade County population projected at +28% by 2050 — long-run rental-demand tailwind backs the buy-and-hold thesis.
Negotiation context
- It's been on market 102 days — a 9% lower offer ($818k) is reasonable based on typical stale-listing flexibility.
- 7 sale attempts since 4y ago with the ask held roughly flat each time — persistent listings suggest the price (not the market) is what's stuck; bring a comps-based counter.
- Current owner paid $770k; 17% above their basis — modest negotiation headroom, anchor on the comps not their cost.
Risks & watch-outs
- Climate carrying-cost: moderate flood risk; severe wind risk, 99% chance of damaging wind over 30y; extreme-heat days projected 7→27/yr by 2055 (HVAC capex compounding) — expect insurance premiums to compound above CPI over the hold.
Questions for the listing agent
- It's been on market 102 days. Have you received any prior offers? Is the seller open to a 9% concession, seller financing, or rate buy-down credit?
- Can we see the unit-by-unit rent roll, current vacancy, and any below-market leases? What's the average tenancy length?
- What capital expenditures (roof, boiler, parking lot, exteriors) have been made in the last 5 years, and what's planned in the next 2?
- Why hasn't it sold? Are there any deal-killer items the seller is aware of (foundation, flood, title, zoning, code violations)?
- Is there a deadline driving the sale (1031 exchange, divorce, estate, relocation)? That informs how much negotiation room exists.
- Schools are B-rated — typically a magnet for longer-tenancy family renters. What's the average tenant stay here, and is there a school-zone premium baked into asking?
- What's the average days-on-market for RENTAL listings here right now (not sales)? A rising rental-DOM trend means longer vacancies and softer asking-rent achievability than the comps imply.
- What's the recent tenant-quality profile in this submarket — average credit score on applications, eviction rate, late-payment / NSF rate, and stable-employment percentage? A property-management company in the area should have these aggregated.
- How much new apartment / multifamily construction is in the pipeline within 1–3 miles? Heavy new supply (>2% of stock underway) typically softens rents 12–24 months out; light construction supports rent growth.
Investment metrics
- 1% rule
- 1.31% ✓
- Cap rate
- 10.57%
- Cash-on-cash
- 15.27%
- DSCR
- 1.68
- GRM
- 6.4
CMA / ARV
No comps found within radius.
Projected returns pro-forma
-3.0% appreciation · 0.0% rent growth · sell at horizon
- IRR
- 2.6%
- Equity multiple
- 1.09×
- Total profit
- $23,845
- Equity at exit
- $134,044
- IRR
- 9.0%
- Equity multiple
- 1.60×
- Total profit
- $150,351
- Equity at exit
- $77,729
Cash invested: $251,720 (down + closing). Projections, not guarantees.
Landlord ↔ Tenant lean methodology
- Overall (STATE)
- 87 Strongly Landlord-Friendly
- State Florida
- 87 Strongly Landlord-Friendly · R+3
- County
- — inherits STATE
- City
- — inherits STATE
ZIP-level market 33161
- Rents YoY
- -0.7%
- Active inventory
- 340
- Price-to-rent
- 19.1×
Monthly cashflow live
- Estimated rent
- $11,787 medium interval (Pro) →
- Mortgage (P&I)
- −$4,714
- Tax from tax record
- −$1,020 /mo · $12,246/yr
- Insurance
- −$375
- HOA
- −$0
- Vacancy / Maint / Mgmt
- −$2,475
- Net cashflow
- $3,202
Break-even live
Sensitivity live
| Price | -10% $3,711 | -5% $3,457 | +0% $3,202 | +5% $2,948 | +10% $2,693 |
|---|---|---|---|---|---|
| Rent | -10% $2,271 | -5% $2,737 | +0% $3,202 | +5% $3,668 | +10% $4,133 |
| Rate | -1.0pp $3,655 | -0.5pp $3,431 | base $3,202 | +0.5pp $2,969 | +1.0pp $2,732 |
3-unit breakdown (identical units grouped — click to expand)
| Units | Beds | Baths | Est. rent |
|---|---|---|---|
| 3× units | 2 | 1 | $11,787 |
| #1 | 2 | 1 | $3,929 |
| #2 | 2 | 1 | $3,929 |
| #3 | 2 | 1 | $3,929 |
| Total (3 units) | $11,787 | ||
UW: 25.0% down · 7.5% · 30yr · 1.5% tax · 5.0% vac · 8.0% maint · 8.0% mgmt
Financing live
Cash to close
- Down payment
- $224,750
- Closing costs
- $26,970
- Reserves months
- —
- Total cash needed
- —
Loan-product check · same deal, 3 products live
Conventional
25% down · 7.5% · 30yr
- Down + closing
- —
- Monthly P&I
- —
- Monthly cashflow
- —
- DSCR
- —
- Eligible?
- —
Personal DTI + credit; lowest rate.
DSCR
20% down · 8.5% · 30yr
- Down + closing
- —
- Monthly P&I
- —
- Monthly cashflow
- —
- DSCR
- —
- Eligible?
- —
No personal income docs; deal must DSCR.
Hard money
10% down · 12.0% · 12mo
- Down + closing
- —
- Monthly P&I
- —
- Monthly cashflow
- —
- DSCR
- —
- Eligible?
- —
Short-term bridge; refi at stabilization.
Rent comps 3 comps
| Address | Beds | Baths | Sqft | Rent | $/sqft | DOM | Units | Dist |
|---|---|---|---|---|---|---|---|---|
| 1234 NE 101st St Miami Shores, FL | 6.0 | 6.0 | 4010 | $29,500 | $7.36 | 14d | 1 | 0.85mi |
| 1234 NE 101st St Miami Shores, FL | 6.0 | 6.0 | 4010 | $29,500 | $7.36 | 12d | 1 | 0.85mi |
| 9101 N Bayshore Dr Miami, FL | 6.0 | 5.0 | 3446 | $38,500 | $11.17 | 26d | 1 | 1.45mi |
Listing history 37 events
-
2026-06-21days on market $899,000 Active 102 DOM
-
2026-06-18days on market $899,000 Active 99 DOM
-
2026-06-17days on market $899,000 Active 98 DOM
-
2026-06-16days on market $899,000 Active 97 DOM
-
2026-06-15days on market $899,000 Active 96 DOM
-
2026-06-13days on market $899,000 Active 94 DOM
-
2026-06-09days on market $899,000 Active 90 DOM
-
2026-06-08days on market $899,000 Active 89 DOM
-
2026-06-07days on market $899,000 Active 88 DOM
-
2026-06-04days on market $899,000 Active 85 DOM
-
2026-06-03days on market $899,000 Active 84 DOM
-
2026-06-02days on market $899,000 Active 83 DOM
-
2026-06-01days on market $899,000 Active 82 DOM
-
2026-05-31days on market $899,000 Active 81 DOM
-
2026-04-22price $899,000
-
2026-03-11$910,000 Active
-
2026-03-03historical
-
2026-01-27price $910,000
-
2025-09-04$949,000 Active
-
2025-08-31historical
-
2025-05-21price $949,000
-
2025-05-09status Active
-
2025-04-22historical Active Under Contract
-
2025-02-26price $960,000
-
2025-01-13$990,000 Active
-
2024-10-05historical
-
2024-07-01price $990,000
-
2024-05-20price $1,020,000
-
2024-01-30$1,070,000 Active
-
2024-01-10historical
-
2023-11-22$1,170,000 Active
-
2022-08-31soldstatus $770,000
-
2022-08-26soldstatus $770,000 Closed
-
2022-08-18status Pending
-
2022-06-14price $789,000
-
2022-06-02price $770,000
-
2022-05-23$789,000 Active
ⓘ Source: listings_history table (triggers on properties + properties_extension) + one-shot
backfill from property_details.listing_events for pre-trigger history.
Tax reassessment forecast FL · Resets to sale price
- Current annual tax
- $12,246 · $1,020/mo
- Projected year-2 tax
- $12,246 · $1,020/mo
- Expected delta
- $0/yr ($0/mo · 0.0%)
ⓘ Screening estimate from a state-policy table — verify with the county assessor before closing.
Climate risk First Street
- Flood 5/10 Major FEMA zone X (unshaded) · 23% chance over 30 yrs
- Wildfire 1/10 Low
- Heat 10/10 Extreme 7 d/yr ≥103°F today · 27 d/yr by 30 yrs out
- Wind 10/10 Extreme 99% chance of damaging wind over 30 yrs
- Air quality 2/10 Low 1 unhealthy d/yr today · 2 by 30 yrs out
Nearby sold comps map
Loading sold comps map…
Walkable amenities ~0.75 mi
Loading nearby amenities…
Taxation est. · year 1
- Rental income
- $141,444
- − Mortgage interest
- −$50,358
- − Property taxes
- −$12,246
- − Insurance
- −$4,495
- − Repairs & maintenance
- −$11,316
- − Management
- −$11,316
- − Depreciation
- −$26,153
- Taxable income
- $25,561
- Est. tax owed @ 24.0%
- −$6,135
- After-tax cash flow
- $32,292/yr
For passive investors: Depreciation is non-cash, so a rental often shows a tax loss while cash-flowing — sheltering income. Rental losses are passive: they offset passive income freely, and up to $25,000/yr can offset ordinary (W-2) income if you actively participate and your MAGI is under $100k (phasing out to $0 by $150k); unused losses carry forward. On sale, claimed depreciation is recaptured at up to 25%, and gains may owe capital-gains tax (a 1031 exchange can defer both). Figures are a year-1 estimate at your 24.0% rate — not tax advice; consult a CPA.
Schools (NCES district)
- District
- Miami-Dade
- NCES district ID
- 1200390
- Math proficiency
- 45% ▼ -16.00%
- Reading proficiency
- 54% ▼ -5.00%
- Median HH income
- $43,928
- Composite
- 41.76/100
- National rank
- #3397
- State rank
- #40 of 73 in FL
Livability — Biscayne Park
- Score
- 77/100
- State rank
- #208
- US rank
- #3222
Category grades
Schools grade is shown separately in the Schools card above.
Census & demographics
- County
- Miami-Dade County · 2,697,751 people
- Metro
- Miami-Fort Lauderdale-Pompano Beach, FL
- Population (ZIP)
- 54,814
- Household income
- $58,325
- Rent vs Own
- Severe rent burden
- 3226.0
Population outlook (Miami-Dade County) Hauer SSP2
- Today (2025)
- 3,126,439 people
- By 2030
- 3,325,765 · +6.4%
- By 2040
- 3,697,561 · +18.3%
- By 2050
- 4,012,134 · +28.3%
- By 2075
- 4,605,612 · +47.3%
- By 2100
- 4,866,598 · +55.7%
Race, ethnicity, and origin ACS 2023
- Neighborhood character
- Diverse neighborhood (Simpson 0.58)
- Race & ethnicity
- Black 56% Hispanic / Latino 31% Two or more races 18% White 8% Asian 2%
- Hispanic origin (detail)
- Puerto Rican 4% Cuban 7% Dominican 4% Salvadoran 1%
- Common ancestry
- Hispanic 35% Estonian 1% Lithuanian 1%
- Foreign-born
- 51% · Canada, Jamaica, Dominican Republic
- Languages at home
- 25% English-only · French/Haitian/Cajun 41% Spanish 30% Other Indo-European 2%
Political lean MEDSL · Miami-Dade
- 2024 margin
- R (+11.4) · D 43.9% · R 55.4%
- 2008→2024 swing
- -27.6pp toward R · 2008: 16.1pp · 2024: -11.4pp
- All cycles
- 2024: R+11.4 2020: D+7.3 2016: D+29.6 2012: D+23.7 2008: D+16.1
Not yet ingested
- Civics
- —
Market trends
- HPI YoY
- ▼ -492.86%
- Current HPI
- 630.6932
- Rent YoY
- ▼ -0.73%
- Metro
- Miami-Fort Lauderdale-Pompano Beach, FL
- State GDP YoY
- ▲ 3.28%
- F500 in state
- 36
Industry mix (Fortune 500 HQ in FL)
| Industry | F500 HQs | Revenue |
|---|---|---|
| Industrial Technology | 2 | $29B |
|
||
| Insurance | 2 | $17B |
|
||
| Retail | 1 | $60B |
|
||
| Technology Distribution | 1 | $58B |
|
||
| Homebuilding | 1 | $35B |
|
||
| Technology Manufacturing | 1 | $35B |
|
||
Price history
+13.9% since first listed23 events — show timeline
- 2026-04-22 Price Changed $899,000 MARMLS
- 2026-03-11 Listed $910,000 MARMLS
- 2026-03-03 Listing Removed — MARMLS
- 2026-01-27 Price Changed $910,000 MARMLS
- 2025-09-04 Listed $949,000 MARMLS
- 2025-08-31 Listing Removed — MARMLS
- 2025-05-21 Price Changed $949,000 MARMLS
- 2025-05-09 Relisted — MARMLS
- 2025-04-22 Contingent — MARMLS
- 2025-02-26 Price Changed $960,000 MARMLS
- 2025-01-13 Listed $990,000 MARMLS
- 2024-10-05 Listing Removed — MARMLS
- 2024-07-01 Price Changed $990,000 MARMLS
- 2024-05-20 Price Changed $1,020,000 MARMLS
- 2024-01-30 Listed $1,070,000 MARMLS
- 2024-01-10 Listing Removed — MARMLS
- 2023-11-22 Listed $1,170,000 MARMLS
- 2022-08-31 Sold (Public Records) $770,000 Public Records
- 2022-08-26 Sold (MLS) $770,000 MARMLS
- 2022-08-18 Pending — MARMLS
- 2022-06-14 Price Changed $789,000 MARMLS
- 2022-06-02 Price Changed $770,000 MARMLS
- 2022-05-23 Listed $789,000 MARMLS
Property tax history
+8.2%/yrLatest (2025): $12,246 · -0.7% YoY. Source: county tax records.
Cash-flow waterfall
monthlySold comps — $/sqft
last 12 mo · ≤1 miLoading sold comps…