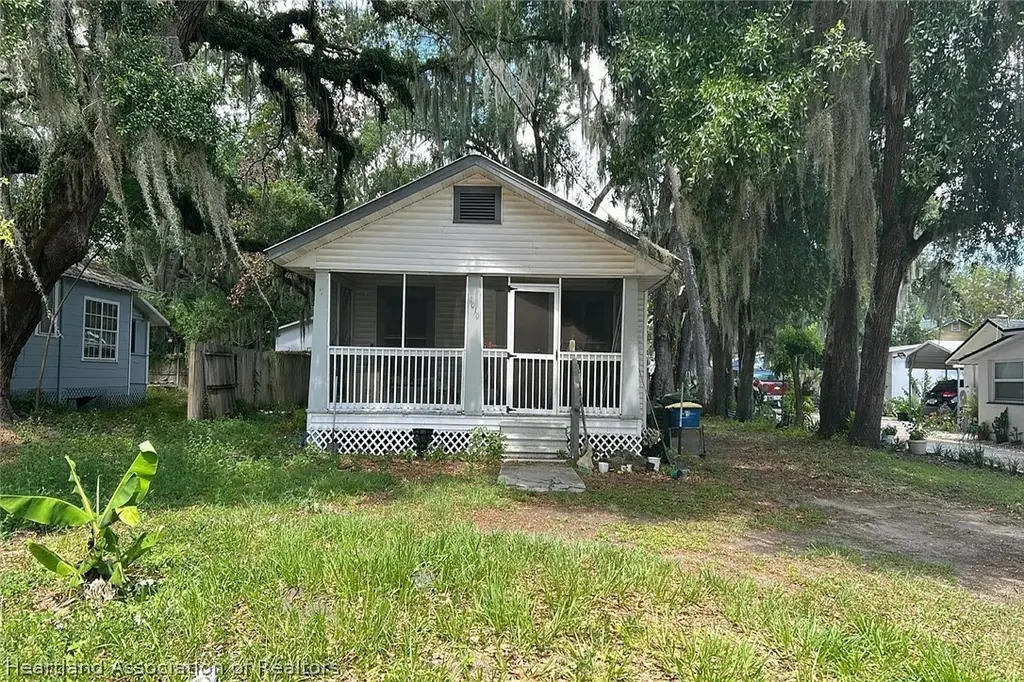
1010 S Dudley Ave · Bartow, FL
Flood risk 1/10 · Minimal
- FEMA flood zone
- X (unshaded)
- Chance of flooding over 30 yrs
- 0.0%
- Est. flood insurance / yr
- $507 – $1,088
Fire risk 3/10 · Minor
- Est. fire insurance / yr
- $947 – $1,759
Heat risk 8/10 · Major
- Hot days now (above 108°F)
- 7 days/yr
- Hot days in 30 yrs
- 24 days/yr
Wind risk 9/10 · Severe
- Chance of severe wind over 30 yrs
- 99.0%
Air-quality risk 2/10 · Minimal
- Unhealthy air days now
- 2 days/yr
- Unhealthy air days in 30 yrs
- 2 days/yr
Risk factors via First Street. Map © Google.
Why this score? — see what drove the D+ grade
The composite is a weighted blend of 9 inputs, each scored 0–100. Each bar is that input's sub-score; the figure is the points it added to the 100-point composite (weight × sub-score).
- Cash flow +15.0/30.0
- ARV discount +7.5/15.0
- 1% rule +5.0/10.0
- DSCR +5.0/10.0
- Schools +3.5/10.0
- Livability +3.4/5.0
- Rent growth +3.2/5.0
- Condition / age +2.5/5.0
- Appreciation +0.0/10.0
$5,000
🖨 Deal sheet 📄 Offer letter ✓ Due diligence
Listing remarks MLS
Charming historic bungalow has been completely remodeled and is MOVE IN READY! 3 Bedrooms, 1 Bathroom, with a large yard and close to downtown Bartow. Beautiful hardwood floors have been left exposed so new buyer and refinish them to their liking, or cover them with more modern flooring if they wish. I have a 4 pt INSPECTION showing the Metal roof is 4 year old, , Water Heater is 2 years old AND is completly repiped with CPVC.
Key facts
- 6,534 sq ft lot
- Built 1925
- Listed 6 days
Property features AI
Finance
- Other: Zoning: R-2
Exterior
- Parking: Driveway; On-street parking
- Utilities: Other water source; Other sewer
- Home design: Single-family residence; One story; Residential property
- Construction: See remarks for construction materials; Other roof
- Exterior features: Front porch
Interior
- Flooring: Other flooring
- Bathrooms: 1 full bathroom
- Heating & cooling: No heating; No cooling
- Interior features: One total room; Other flooring
Neighborhood map
What this means for you Summary
Snapshot
- This is a 2-bed/1.0-bath single-family listed at $5k.
Deal economics
- At list price, monthly cash flow is $1k ($13k/yr) — positive.
- The deal already cash-flows at list — no discount required.
- Meets the 1% rule at list price ($1k rent vs $5k).
Location & tenants
- Location reads 68/100 on livability (#526 in FL) — a middle-class / working-renter tenant base. Strengths: cost of living A+, housing A+; Watch: employment C-, crime D-, amenities F.
- Polk (suburban): math 39% / reading 43% proficiency, ranked #62 of 73 in FL (top 85%) — families likely to look elsewhere, expect single-tenant / working-renter base with shorter leases.
- Market conditions: Rents rising (+2.7%/yr); 386 active listings in the ZIP; 14 comparable units currently listed for rent nearby; rentals at typical pace (median 23d on market — plan ~3-4 weeks tenant-placement turnaround); 10,384 units permitted in Polk County in 2024 (1,716 in 5+ unit buildings).
Forward outlook
- Local home prices are declining (-3.0%/yr); year-one equity from $35 of loan paydown is wiped out by about $150 of value loss. Plan a longer hold.
- Polk County population projected at +33% by 2050 — long-run rental-demand tailwind backs the buy-and-hold thesis.
- At projected returns (-3.0% appreciation + 2.7% rent growth), your $1k cash investment doubles in ~1 year — after that, you're playing with house money.
Negotiation context
- Only 7 days on market — expect competitive offers; lowballing is unlikely to land.
- 3 sale attempts since 16y ago with the ask held roughly flat each time — persistent listings suggest the price (not the market) is what's stuck; bring a comps-based counter.
Risks & watch-outs
- Watch-outs: built in 1925 — expect roof / HVAC / electrical / plumbing capex.
- Climate carrying-cost: severe wind risk, 99% chance of damaging wind over 30y; extreme-heat days projected 7→24/yr by 2055 (HVAC capex compounding) — expect insurance premiums to compound above CPI over the hold.
Questions for the listing agent
- Built in 1925 — when were the roof, HVAC, electrical panel, plumbing, and water heater last replaced?
- Is there a deadline driving the sale (1031 exchange, divorce, estate, relocation)? That informs how much negotiation room exists.
- Crime grade is D in this area — have there been break-ins, vandalism, or insurance claims at this property in the last 3 years? What carrier currently insures it and at what premium?
- The area grade is low — what's the realistic commute time and amenity access for the typical tenant pool here? Any planned neighborhood developments (good or bad) we should know about?
- What's the average days-on-market for RENTAL listings here right now (not sales)? A rising rental-DOM trend means longer vacancies and softer asking-rent achievability than the comps imply.
- What's the recent tenant-quality profile in this submarket — average credit score on applications, eviction rate, late-payment / NSF rate, and stable-employment percentage? A property-management company in the area should have these aggregated.
- How much new for-sale + rental construction is in the pipeline within 1–3 miles? Heavy new supply typically softens prices + rents 12–24 months out; constrained supply supports both.
Investment metrics
- 1% rule
- 29.00% ✓
- Cap rate
- 272.92%
- Cash-on-cash
- 952.25%
- DSCR
- 43.37
- GRM
- 0.3
CMA / ARV
No comps found within radius.
Projected returns pro-forma
-3.0% appreciation · 2.72% rent growth · sell at horizon
- IRR
- —
- Equity multiple
- 50.69×
- Total profit
- $69,562
- Equity at exit
- $746
- IRR
- —
- Equity multiple
- 108.22×
- Total profit
- $150,111
- Equity at exit
- $432
Cash invested: $1,400 (down + closing). Projections, not guarantees.
Landlord ↔ Tenant lean methodology
- Overall (STATE)
- 87 Strongly Landlord-Friendly
- State Florida
- 87 Strongly Landlord-Friendly · R+3
- County
- — inherits STATE
- City
- — inherits STATE
ZIP-level market 33830
- Home prices YoY
- -19.8%
- Rents YoY
- 2.7%
- Active inventory
- 386
- Price-to-rent
- 0.3×
Monthly cashflow live
- Estimated rent
- $1,450 high interval (Pro) →
- Mortgage (P&I)
- −$26
- Tax est. 1.5%
- −$6 /mo · $75/yr
- Insurance
- −$2
- HOA
- −$0
- Vacancy / Maint / Mgmt
- −$305
- Net cashflow
- $1,111
Break-even live
UW: 25.0% down · 7.5% · 30yr · 1.5% tax · 5.0% vac · 8.0% maint · 8.0% mgmt
Financing live
Cash to close
- Down payment
- $1,250
- Closing costs
- $150
- Reserves months
- —
- Total cash needed
- —
Loan-product check · same deal, 3 products live
Conventional
25% down · 7.5% · 30yr
- Down + closing
- —
- Monthly P&I
- —
- Monthly cashflow
- —
- DSCR
- —
- Eligible?
- —
Personal DTI + credit; lowest rate.
DSCR
20% down · 8.5% · 30yr
- Down + closing
- —
- Monthly P&I
- —
- Monthly cashflow
- —
- DSCR
- —
- Eligible?
- —
No personal income docs; deal must DSCR.
Hard money
10% down · 12.0% · 12mo
- Down + closing
- —
- Monthly P&I
- —
- Monthly cashflow
- —
- DSCR
- —
- Eligible?
- —
Short-term bridge; refi at stabilization.
Rent comps 14 comps
| Address | Beds | Baths | Sqft | Rent | $/sqft | DOM | Units | Dist |
|---|---|---|---|---|---|---|---|---|
| 670 Garden St Bartow, FL | 2.0 | 1.0 | 850 | $1,295 | $1.52 | 23d | 1 | 0.09mi |
| 820 S Floral Ave Bartow, FL | 2.0 | 1.5 | 1112 | $1,200 | $1.08 | 23d | 1 | 0.21mi |
| 740 E Pearl St Apt E Bartow, FL | 2.0 | 1.5 | 1000 | $1,470 | $1.47 | 23d | 1 | 0.66mi |
| 740 E Pearl St Unit C Bartow, FL | 2.0 | 1.0 | 900 | $1,360 | $1.51 | 23d | 1 | 0.67mi |
| 855 E Vine St Unit A Bartow, FL | 3.0 | 2.0 | 1040 | $1,850 | $1.78 | 23d | 1 | 0.71mi |
| 1135 Polk St Bartow, FL | 2.0 | 1.0 | 768 | $1,150 | $1.50 | 21d | 1 | 1.04mi |
| 885 Ruby Ave Unit NA Bartow, FL | 3.0 | 1.0 | 807 | $1,600 | $1.98 | 2d | 1 | 1.12mi |
| 980 Waldon Ave Bartow, FL | 3.0 | 2.0 | 1050 | $1,550 | $1.48 | 23d | 1 | 1.20mi |
| 1715 Martin Luther King Jr Blvd Bartow, FL | 2.0 | 1.0 | 624 | $1,200 | $1.92 | 23d | 1 | 1.31mi |
| 1715 1/2 Martin Luther King Junior Blvd Bartow, FL | 2.0 | 1.0 | 624 | $1,200 | $1.92 | 23d | 1 | 1.31mi |
| 1465 E Boulevard St Bartow, FL | 3.0 | 1.0 | 1000 | $1,295 | $1.29 | 23d | 1 | 1.46mi |
| 2060 Martin Luther King Jr Blvd Bartow, FL | 2.0 | 1.0 | 1120 | $1,200 | $1.07 | 23d | 1 | 1.48mi |
| 1350 N Wilson Ave Bartow, FL | 1.0–2.0 | 1.0–2.0 | 892 | $1,649 | $1.85 | 2d | 6 | 1.49mi |
| 1290 Henson Ln Bartow, FL | 2.0 | 1.0 | 743 | $850 | $1.14 | 11d | 1 | 1.50mi |
Listing history 5 events
-
2026-06-15days on market $5,000 Active 7 DOM
-
2026-06-13days on market $5,000 Active 5 DOM
-
2026-06-10days on market $5,000 Active 2 DOM
-
2026-06-08remarks 295-char remark
-
2026-06-08$5,000 Active 1 DOM
ⓘ Source: listings_history table (triggers on properties + properties_extension) + one-shot
backfill from property_details.listing_events for pre-trigger history.
Climate risk First Street
- Flood 1/10 Low FEMA zone X (unshaded) · 0% chance over 30 yrs
- Wildfire 3/10 Moderate
- Heat 8/10 Severe 7 d/yr ≥108°F today · 24 d/yr by 30 yrs out
- Wind 9/10 Extreme 99% chance of damaging wind over 30 yrs
- Air quality 2/10 Low 2 unhealthy d/yr today · 2 by 30 yrs out
Nearby sold comps map
Loading sold comps map…
Walkable amenities ~0.75 mi
Loading nearby amenities…
Taxation est. · year 1
- Rental income
- $17,400
- − Mortgage interest
- −$280
- − Property taxes
- −$75
- − Insurance
- −$25
- − Repairs & maintenance
- −$1,392
- − Management
- −$1,392
- − Depreciation
- −$145
- Taxable income
- $14,091
- Est. tax owed @ 24.0%
- −$3,382
- After-tax cash flow
- $9,950/yr
For passive investors: Depreciation is non-cash, so a rental often shows a tax loss while cash-flowing — sheltering income. Rental losses are passive: they offset passive income freely, and up to $25,000/yr can offset ordinary (W-2) income if you actively participate and your MAGI is under $100k (phasing out to $0 by $150k); unused losses carry forward. On sale, claimed depreciation is recaptured at up to 25%, and gains may owe capital-gains tax (a 1031 exchange can defer both). Figures are a year-1 estimate at your 24.0% rate — not tax advice; consult a CPA.
Schools (NCES district)
- District
- Polk
- NCES district ID
- 1201590
- Math proficiency
- 39% ▼ -11.00%
- Reading proficiency
- 43% ▼ -4.00%
- Median HH income
- $43,979
- Composite
- 34.74/100
- National rank
- #5132
- State rank
- #62 of 73 in FL
Livability — Bartow
- Score
- 68/100
- State rank
- #526
- US rank
- #9835
Category grades
Schools grade is shown separately in the Schools card above.
Census & demographics
- Census place
- Bartow, FL
- County
- Polk County · 740,051 people
- City population
- 33,740
- Metro
- Lakeland-Winter Haven, FL
- Population (ZIP)
- 33,740
- Household income
- $63,918
- Rent vs Own
- Severe rent burden
- 681.0
Population outlook (Polk County) Hauer SSP2
- Today (2025)
- 752,975 people
- By 2030
- 804,621 · +6.9%
- By 2040
- 906,117 · +20.3%
- By 2050
- 1,000,476 · +32.9%
- By 2075
- 1,197,520 · +59.0%
- By 2100
- 1,271,518 · +68.9%
Race, ethnicity, and origin ACS 2023
- Neighborhood character
- Diverse neighborhood (Simpson 0.62)
- Race & ethnicity
- White 55% Hispanic / Latino 22% Black 18% Two or more races 13% Asian 2%
- Hispanic origin (detail)
- Mexican 13% Puerto Rican 5%
- Common ancestry
- Italian 3% Slovak 1% Lithuanian 1%
- Foreign-born
- 8% · Canada
- Languages at home
- 81% English-only · Spanish 17% Other Indo-European 1% Other Asian/Pacific 1%
Political lean MEDSL · Polk
- 2024 margin
- Strong R (+20.7) · D 39.2% · R 59.9%
- 2008→2024 swing
- -14.6pp toward R · 2008: -6.1pp · 2024: -20.7pp
- All cycles
- 2024: R+20.7 2020: R+14.4 2016: R+14.1 2012: R+6.8 2008: R+6.1
Not yet ingested
- Civics
- —
Market trends
- HPI YoY
- ▼ -82.47%
- Current HPI
- 333.3392
- Rent YoY
- ▲ 2.72%
- Metro
- Lakeland-Winter Haven, FL
- State GDP YoY
- ▲ 3.28%
- F500 in state
- 36
Industry mix (Fortune 500 HQ in FL)
| Industry | F500 HQs | Revenue |
|---|---|---|
| Industrial Technology | 2 | $29B |
|
||
| Insurance | 2 | $17B |
|
||
| Retail | 1 | $60B |
|
||
| Technology Distribution | 1 | $58B |
|
||
| Homebuilding | 1 | $35B |
|
||
| Technology Manufacturing | 1 | $35B |
|
||
Price history
-94.0% since first listed10 events — show timeline
- 2026-06-08 Listed $5,000 HAOR as distributed by MLS GRID
- 2022-07-18 Sold (MLS) $185,000 Stellar MLS as Distributed by MLS Grid
- 2022-06-09 Pending — Stellar MLS as Distributed by MLS Grid
- 2022-06-04 Price Changed $151,900 Stellar MLS as Distributed by MLS Grid
- 2022-05-27 Price Changed $154,900 Stellar MLS as Distributed by MLS Grid
- 2022-05-04 Listed $159,900 Stellar MLS as Distributed by MLS Grid
- 2022-04-20 Sold (Public Records) $115,652 Public Records
- 2010-08-02 Sold (MLS) $15,000 Stellar MLS as Distributed by MLS Grid
- 2010-03-29 Listed $14,000 Stellar MLS as Distributed by MLS Grid
- 2005-12-19 Sold (Public Records) $83,300 Public Records
Property tax history
+21.5%/yrLatest (2025): $3,053 · +0.4% YoY. Source: county tax records.
Cash-flow waterfall
monthlySold comps — $/sqft
last 12 mo · ≤1 miLoading sold comps…