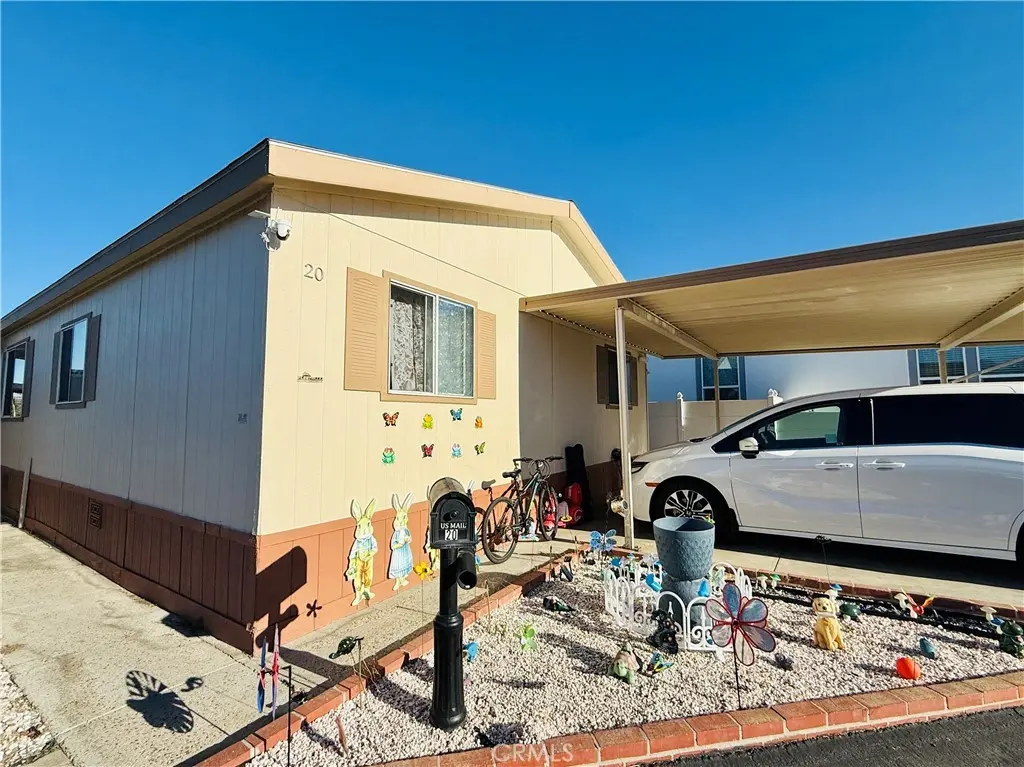
1560 S Otterbein Ave #20 · Rowland Heights, CA
Flood risk 1/10 · Minimal
- FEMA flood zone
- X (unshaded)
- Chance of flooding over 30 yrs
- 0.0%
- Est. flood insurance / yr
- $507 – $1,088
Fire risk 2/10 · Minimal
- Est. fire insurance / yr
- $659 – $1,223
Heat risk 6/10 · Moderate
- Hot days now (above 99°F)
- 7 days/yr
- Hot days in 30 yrs
- 22 days/yr
Wind risk 1/10 · Minimal
- Chance of severe wind over 30 yrs
- —
Air-quality risk 7/10 · Major
- Unhealthy air days now
- 13 days/yr
- Unhealthy air days in 30 yrs
- 14 days/yr
Risk factors via First Street. Map © Google.
Why this score? — see what drove the C+ grade
The composite is a weighted blend of 9 inputs, each scored 0–100. Each bar is that input's sub-score; the figure is the points it added to the 100-point composite (weight × sub-score).
- Cash flow +30.0/30.0
- DSCR +10.0/10.0
- 1% rule +9.1/10.0
- Rent growth +5.0/5.0
- Schools +4.5/10.0
- Livability +2.5/5.0
- Condition / age +2.2/5.0
- ARV discount +0.0/15.0
- Appreciation +0.0/10.0
$250,000
🖨 Deal sheet 📄 Offer letter ✓ Due diligence
Listing remarks MLS
* * * Beautiful Mobile Home Built in 2001 * * * Well Maintained, Quiet Location * * * Large living space, 1,391Sq. Ft. (52' x 26'8" = 1,391Sq. Ft. ), 4 bedrooms and 2 full bathrooms, double-paned windows and blinds throughout, bright and airy, open floor plan, high ceilings. Wonderful kitchen with skylight, breakfast bar, dishwasher and stove. Living room with high ceilings, tile flooring, formal dining room with tile flooring, indoor laundry room with built-in cabinets. Large master bathroom with hot tub and separate shower area. Central air conditioning and heating. 2 parking space in the front, low space fee: $990per month (including trash and sewer). Community pool and clubhouse, quiet family park, close to Rowland Park, supermarket, public transportation and schools. Easy access to 60, 10 and 57 freeways. * * * Don't miss this great deal! * * *
Key facts
- Open floor plan
- Double paned windows
- Large living space
Tags
Neighborhood map
What this means for you Summary
Snapshot
- This is a 3-bed/2.0-bath manufactured listed at $250k. Condition is rated fair.
Deal economics
- At list price, monthly cash flow is $1k ($16k/yr) — positive.
- The deal already cash-flows at list — no discount required.
- Meets the 1% rule at list price ($4k rent vs $250k).
- Cap rate 12.6% vs local median 2.7% in Rowland Heights — top-decile yield for the area; either an underpriced asset or a hidden risk that comps aren't pricing in. Stress-test before assuming the spread holds.
Location & tenants
- Location reads 50/100 on livability (#1,123 in CA) — a working-class tenant base; expect higher turnover. Strengths: employment A; Watch: crime C-, amenities F, commute F.
- Rowland Unified (suburban): math 40% / reading 62% proficiency, ranked #134 of 517 in CA (top 26%) — acceptable for families but not a draw, mixed tenant base, ~2y average lease.
- Market conditions: Rents rising fast (+10.3%/yr); 102 active listings in the ZIP; 27 comparable units currently listed for rent nearby; rentals at typical pace (median 21d on market — plan ~3-4 weeks tenant-placement turnaround); solid renter incomes; 19,697 units permitted in Los Angeles County in 2024 (9,426 in 5+ unit buildings).
- At $3,518/mo this rent would consume 51% of the median local household income ($83k/yr) (locally 1440% of renters already pay >50% of income on rent) — very limited rent-growth headroom before tenants either downsize or default.
Forward outlook
- Local home prices are declining (-3.0%/yr); year-one equity from $2k of loan paydown is wiped out by about $8k of value loss. Plan a longer hold.
- Los Angeles County population projected at +9% by 2050 — modest demand growth; plan on rents tracking national, not racing it.
- At projected returns (-3.0% appreciation + 8.0% rent growth), your $70k cash investment doubles in ~5 years — after that, you're playing with house money.
Negotiation context
- Only 1 days on market — expect competitive offers; lowballing is unlikely to land.
- 3 sale attempts since 2y ago; this cycle's ask has dropped $78k (24%) from the opening price — seller is motivated, your offer sets the floor, not the list.
Risks & watch-outs
- Climate carrying-cost: extreme-heat days projected 7→22/yr by 2055 (HVAC capex compounding) — expect insurance premiums to compound above CPI over the hold.
Questions for the listing agent
- Have any recent inspections been done? Can we get a copy of the seller's disclosures and any deferred-maintenance estimates?
- Is there a deadline driving the sale (1031 exchange, divorce, estate, relocation)? That informs how much negotiation room exists.
- What's the average days-on-market for RENTAL listings here right now (not sales)? A rising rental-DOM trend means longer vacancies and softer asking-rent achievability than the comps imply.
- What's the recent tenant-quality profile in this submarket — average credit score on applications, eviction rate, late-payment / NSF rate, and stable-employment percentage? A property-management company in the area should have these aggregated.
- How much new for-sale + rental construction is in the pipeline within 1–3 miles? Heavy new supply typically softens prices + rents 12–24 months out; constrained supply supports both.
Investment metrics
- 1% rule
- 1.41% ✓
- Cap rate
- 12.56%
- Cash-on-cash
- 22.38%
- DSCR
- 2.00
- GRM
- 5.9
CMA / ARV
- ARV (median comp)
- $211,668
- List price
- $250,000
- Delta
- 54.96%
- Verdict
- OVERPRICED
- Comps
- 20 within 1.0 mi
Show comp detail 12 sales within ~0.75 mi
| Address | Dist | Beds/Ba | Sqft | Sold | Price | $/sf | Match |
|---|---|---|---|---|---|---|---|
| 1560 Otterbein Ave #12 | 0.00mi | 3/2.0 | 1,414 (-3%) | 4mo | $365,000 | $258 | 92 |
| 1560 S Otterbein Ave #58 | 0.00mi | 3/3.0 | 1,440 (-1%) | 8mo | $345,000 | $240 | 88 |
| 1560 S Otterbein Ave #113 | 0.00mi | 3/2.0 | 1,568 (+8%) | 4mo | $308,000 | $196 | 84 |
| 1441 Paso Real Ave #327 | 0.56mi | 3/2.0 | 1,440 (-1%) | 1mo | $200,000 | $139 | 71 |
| 1441 Paso Real Ave #255 | 0.56mi | 3/2.0 | 1,440 (-1%) | 8mo | $193,000 | $134 | 66 |
| 1441 Paso Real Ave #119 | 0.56mi | 3/2.0 | 1,392 (-4%) | 4mo | $220,000 | $158 | 63 |
| 1441 Paso Real Ave #246 | 0.56mi | 4/3.0 (+1) | 1,440 (-1%) | 0mo | $210,000 | $146 | 63 |
| 1441 Paso Real Ave #184 | 0.55mi | 3/2.0 | 1,493 (+2%) | 9mo | $285,470 | $191 | 63 |
| 1441 S Paso Real Ave #27 | 0.56mi | 4/2.0 (+1) | 1,440 (-1%) | 5mo | $195,000 | $135 | 63 |
| 1441 Paso Real Ave #203 | 0.56mi | 4/2.0 (+1) | 1,493 (+2%) | 4mo | $230,000 | $154 | 62 |
| 1560 S Otterbein Ave #170 | 0.00mi | 4/3.0 (+1) | 1,664 (+14%) | 7mo | $280,000 | $168 | 61 |
| 1440 Paso Real Ave #37 | 0.48mi | 2/2.0 (-1) | 1,344 (-8%) | 2mo | $175,000 | $130 | 58 |
Match score weights: distance 35% · size 25% · config 20% · recency 20%. Top-matched comps best support the ARV.
Projected returns pro-forma
-3.0% appreciation · 8.0% rent growth · sell at horizon
- IRR
- 20.3%
- Equity multiple
- 1.87×
- Total profit
- $61,137
- Equity at exit
- $37,276
- IRR
- 31.5%
- Equity multiple
- 4.49×
- Total profit
- $244,517
- Equity at exit
- $21,615
Cash invested: $70,000 (down + closing). Projections, not guarantees.
Landlord ↔ Tenant lean methodology
- Overall (STATE)
- 18 Strongly Tenant-Friendly
- State California
- 18 Strongly Tenant-Friendly · D+13
- County
- — inherits STATE
- City
- — inherits STATE
ZIP-level market 91748
- Rents YoY
- 10.3%
- Active inventory
- 102
- Price-to-rent
- 5.9×
Monthly cashflow live
- Estimated rent
- $3,518 high interval (Pro) →
- Mortgage (P&I)
- −$1,311
- Tax from tax record
- −$58 /mo · $700/yr
- Insurance
- −$104
- HOA
- −$0
- Vacancy / Maint / Mgmt
- −$739
- Net cashflow
- $1,306
Break-even live
UW: 25.0% down · 7.5% · 30yr · 1.5% tax · 5.0% vac · 8.0% maint · 8.0% mgmt
Financing live
Cash to close
- Down payment
- $62,500
- Closing costs
- $7,500
- Reserves months
- —
- Total cash needed
- —
Loan-product check · same deal, 3 products live
Conventional
25% down · 7.5% · 30yr
- Down + closing
- —
- Monthly P&I
- —
- Monthly cashflow
- —
- DSCR
- —
- Eligible?
- —
Personal DTI + credit; lowest rate.
DSCR
20% down · 8.5% · 30yr
- Down + closing
- —
- Monthly P&I
- —
- Monthly cashflow
- —
- DSCR
- —
- Eligible?
- —
No personal income docs; deal must DSCR.
Hard money
10% down · 12.0% · 12mo
- Down + closing
- —
- Monthly P&I
- —
- Monthly cashflow
- —
- DSCR
- —
- Eligible?
- —
Short-term bridge; refi at stabilization.
Rent comps 27 comps
| Address | Beds | Baths | Sqft | Rent | $/sqft | DOM | Units | Dist |
|---|---|---|---|---|---|---|---|---|
| 19231 Tranbarger St Rowland Heights, CA | 3.0 | 2.0 | 1170 | $3,200 | $2.74 | 43d | 1 | 0.11mi |
| 1316 Raleo Ave Rowland Heights, CA | 4.0 | 2.0 | 1200 | $5,000 | $4.17 | 15d | 1 | 0.25mi |
| 19050 Colima Rd Rowland Heights, CA | 1.0–2.0 | 1.0–2.0 | 833 | $2,595 | $3.12 | 22d | 2 | 0.31mi |
| 19319 Pilario St Rowland Heights, CA | 4.0 | 2.0 | 1480 | $3,750 | $2.53 | 43d | 1 | 0.35mi |
| 1809 Paso Real Ave Rowland Heights, CA | 4.0 | 2.0 | 1259 | $3,500 | $2.78 | 24d | 1 | 0.62mi |
| 1862 Hollandale Ave Rowland Heights, CA | 4.0 | 2.0 | 1588 | $4,250 | $2.68 | 17d | 1 | 0.64mi |
| 2143 Arcdale Ave Rowland Heights, CA | 3.0 | 2.0 | 1386 | $3,500 | $2.53 | 24d | 1 | 0.83mi |
| 2240 Electra Ave Rowland Heights, CA | 3.0 | 2.0 | 1256 | $3,200 | $2.55 | 17d | 1 | 0.83mi |
| 18567 Colima Rd Rowland Heights, CA | 1.0–2.0 | 1.0–2.0 | 845 | $2,400 | $2.84 | 3d | 26 | 0.86mi |
| 2847 Valley Blvd West Covina, CA | 1.0–2.0 | 1.0 | 879 | $3,040 | $3.46 | 2d | 7 | 0.87mi |
| 18617 Trot Ave Rowland Heights, CA | 3.0 | 2.0 | 1251 | $3,350 | $2.68 | 17d | 1 | 0.89mi |
| 2243 Otterbein Ave Rowland Heights, CA | 3.0 | 2.0 | 1286 | $3,600 | $2.80 | 43d | 1 | 0.89mi |
| 19358 Alcona St Rowland Heights, CA | 4.0 | 2.0 | 1613 | $3,950 | $2.45 | 43d | 1 | 0.90mi |
| 2817 E Valley Blvd West Covina, CA | 3.0 | 2.0 | 1050 | $3,100 | $2.95 | 43d | 1 | 0.90mi |
| 1808 Santa Ysabela Dr Rowland Heights, CA | 4.0 | 2.0 | 1175 | $3,500 | $2.98 | 20d | 1 | 0.93mi |
| 1439 S Jellick Ave Unit B Rowland Heights, CA | 2.0 | 1.5 | 1049 | $2,300 | $2.19 | 4d | 1 | 0.99mi |
| 2601 E Valley Blvd West Covina, CA | 1.0–2.0 | 1.0–2.0 | 925 | $2,650 | $2.86 | 7d | 3 | 1.03mi |
| 4037 S Ellesford Ave West Covina, CA | 4.0 | 2.0 | 1790 | $4,195 | $2.34 | 1d | 1 | 1.05mi |
| 19307 Oakview Ln Rowland Heights, CA | 4.0 | 2.0 | 1789 | $3,850 | $2.15 | 43d | 1 | 1.07mi |
| 18417 Santar St Rowland Heights, CA | 4.0 | 2.0 | 1142 | $3,300 | $2.89 | 17d | 1 | 1.08mi |
| 18658 Mescalero St Rowland Heights, CA | 3.0 | 2.0 | 1352 | $3,800 | $2.81 | 22d | 1 | 1.08mi |
| 18573 Farjardo St Rowland Heights, CA | 3.0 | 2.0 | 1300 | $3,750 | $2.88 | 43d | 1 | 1.14mi |
| 2454 Hillman Ln Rowland Heights, CA | 3.0 | 2.5 | 1506 | $3,800 | $2.52 | 43d | 1 | 1.24mi |
| 2415 Los Padres Dr Rowland Heights, CA | 3.0 | 2.0 | 1120 | $3,300 | $2.95 | 17d | 1 | 1.30mi |
| 18626 Barroso St Rowland Heights, CA | 3.0 | 2.0 | 1446 | $3,890 | $2.69 | 3d | 1 | 1.30mi |
| 684 Panorama Ln La Puente, CA | 3.0 | 3.5 | 1683 | $3,600 | $2.14 | 17d | 1 | 1.39mi |
| 684 Panorama Ln La Puente, CA | 3.0 | 3.5 | 1683 | $3,600 | $2.14 | 20d | 1 | 1.39mi |
Listing history 9 events
-
2026-06-18pricedays on market $250,000 Active 1 DOM
-
2026-05-31days on market $328,000 Active 171 DOM
-
2025-12-11$328,000 Active 883-char remark
Show marketing remark (883 chars)
* * * Beautiful Mobile Home Built in 2001 * * * Well Maintained, Quiet Location * * * Large living space, 1,391Sq. Ft. (52' x 26'8" = 1,391Sq. Ft. ), 4 bedrooms and 2 full bathrooms, double-paned windows and blinds throughout, bright and airy, open floor plan, high ceilings. Wonderful kitchen with skylight, breakfast bar, dishwasher and stove. Living room with high ceilings, tile flooring, formal dining room with tile flooring, indoor laundry room with built-in cabinets. Large master bathroom with hot tub and separate shower area. Central air conditioning and heating. 2 parking space in the front, low space fee: $990per month (including trash and sewer). Community pool and clubhouse, quiet family park, close to Rowland Park, supermarket, public transportation and schools. Easy access to 60, 10 and 57 freeways. * * * Don't miss this great deal! * * *
-
2025-02-24soldstatus $295,000 Closed Sale 531-char remark
Show marketing remark (531 chars)
Pride of ownership one owner home. Built in 2001 open floor plan with high ceilings and lots of windows. 4 bedrooms 2 full baths with spacious lovely kitchen layout connected to dining and living room area. Large master suite with full bathroom, 3 additional rooms are also generous size. Large shed, nice backyard and parking for 2 vehicles. Conveniently located near restaurants, shops, schools and parks! Easy access to the 60, 57, 605, & 71 freeways! Hi Lea Village Mobile Home Park is all-ages with a clubhouse and pool!
-
2025-02-24soldstatus $295,000 Closed Sale
Show marketing remark (531 chars)
Pride of ownership one owner home. Built in 2001 open floor plan with high ceilings and lots of windows. 4 bedrooms 2 full baths with spacious lovely kitchen layout connected to dining and living room area. Large master suite with full bathroom, 3 additional rooms are also generous size. Large shed, nice backyard and parking for 2 vehicles. Conveniently located near restaurants, shops, schools and parks! Easy access to the 60, 57, 605, & 71 freeways! Hi Lea Village Mobile Home Park is all-ages with a clubhouse and pool!
-
2024-12-14status Pending Sale 531-char remark
Show marketing remark (531 chars)
Pride of ownership one owner home. Built in 2001 open floor plan with high ceilings and lots of windows. 4 bedrooms 2 full baths with spacious lovely kitchen layout connected to dining and living room area. Large master suite with full bathroom, 3 additional rooms are also generous size. Large shed, nice backyard and parking for 2 vehicles. Conveniently located near restaurants, shops, schools and parks! Easy access to the 60, 57, 605, & 71 freeways! Hi Lea Village Mobile Home Park is all-ages with a clubhouse and pool!
-
2024-12-14status Pending Sale
Show marketing remark (531 chars)
Pride of ownership one owner home. Built in 2001 open floor plan with high ceilings and lots of windows. 4 bedrooms 2 full baths with spacious lovely kitchen layout connected to dining and living room area. Large master suite with full bathroom, 3 additional rooms are also generous size. Large shed, nice backyard and parking for 2 vehicles. Conveniently located near restaurants, shops, schools and parks! Easy access to the 60, 57, 605, & 71 freeways! Hi Lea Village Mobile Home Park is all-ages with a clubhouse and pool!
-
2024-11-12$320,000 Active 531-char remark
Show marketing remark (531 chars)
Pride of ownership one owner home. Built in 2001 open floor plan with high ceilings and lots of windows. 4 bedrooms 2 full baths with spacious lovely kitchen layout connected to dining and living room area. Large master suite with full bathroom, 3 additional rooms are also generous size. Large shed, nice backyard and parking for 2 vehicles. Conveniently located near restaurants, shops, schools and parks! Easy access to the 60, 57, 605, & 71 freeways! Hi Lea Village Mobile Home Park is all-ages with a clubhouse and pool!
-
2024-10-15$320,000 Active
ⓘ Source: listings_history table (triggers on properties + properties_extension) + one-shot
backfill from property_details.listing_events for pre-trigger history.
Tax reassessment forecast CA · Resets to sale price
- Current annual tax
- $700 · $58/mo
- Projected year-2 tax
- $1,900 · $158/mo
- Expected delta
- +$1,200/yr (+$100/mo · 171.5%)
ⓘ Screening estimate from a state-policy table — verify with the county assessor before closing.
Climate risk First Street
- Flood 1/10 Low FEMA zone X (unshaded) · 0% chance over 30 yrs
- Wildfire 2/10 Low
- Heat 6/10 Major 7 d/yr ≥99°F today · 22 d/yr by 30 yrs out
- Wind 1/10 Low
- Air quality 7/10 Severe 13 unhealthy d/yr today · 14 by 30 yrs out
Nearby sold comps map
Loading sold comps map…
Walkable amenities ~0.75 mi
Loading nearby amenities…
Taxation est. · year 1
- Rental income
- $42,216
- − Mortgage interest
- −$14,004
- − Property taxes
- −$700
- − Insurance
- −$1,250
- − Repairs & maintenance
- −$3,377
- − Management
- −$3,377
- − Depreciation
- −$7,273
- Taxable income
- $12,235
- Est. tax owed @ 24.0%
- −$2,936
- After-tax cash flow
- $12,732/yr
For passive investors: Depreciation is non-cash, so a rental often shows a tax loss while cash-flowing — sheltering income. Rental losses are passive: they offset passive income freely, and up to $25,000/yr can offset ordinary (W-2) income if you actively participate and your MAGI is under $100k (phasing out to $0 by $150k); unused losses carry forward. On sale, claimed depreciation is recaptured at up to 25%, and gains may owe capital-gains tax (a 1031 exchange can defer both). Figures are a year-1 estimate at your 24.0% rate — not tax advice; consult a CPA.
Condition & rehab AI · 12 photos
This mobile home requires moderate repairs and maintenance to improve its condition and increase its value.
Repairs flagged
- Major kitchen cabinets — severe wear and tear
- Major bathroom fixtures — dated and worn
- Major exterior siding — worn and in need of repainting
- Major landscaping — cluttered and in need of maintenance
Value-add opportunities
- Both paint interior walls — enhances curb appeal and interior aesthetics
- Both replace kitchen cabinets — modernizes the space and increases value
- Both replace bathroom fixtures — modernizes the space and increases value
- Both repair/replace windows — improves energy efficiency and enhances curb appeal
Renovation cost estimate screening
| Repair item | Severity | Est. cost |
|---|---|---|
| kitchen cabinets · severe wear and tear | Major | $15,000–50,000 |
| bathroom fixtures · dated and worn | Major | $15,000–50,000 |
| exterior siding · worn and in need of repainting | Major | $15,000–50,000 |
| landscaping · cluttered and in need of maintenance | Major | $15,000–50,000 |
| Total estimated repair cost · 4 items | $60,000–200,000 |
Value-add ROI direction
- Both paint interior walls — enhances curb appeal and interior aesthetics ↑
- Both replace kitchen cabinets — modernizes the space and increases value ↑
- Both replace bathroom fixtures — modernizes the space and increases value ↑
- Both repair/replace windows — improves energy efficiency and enhances curb appeal ↑
ⓘ Cost ranges are severity-bucket heuristics (US national rule-of-thumb). Get contractor quotes + a written scope before underwriting a rehab budget.
Schools (NCES district)
- District
- Rowland Unified
- NCES district ID
- 0633750
- Math proficiency
- 40% ▼ -1.00%
- Reading proficiency
- 62% ▲ 11.00%
- Median HH income
- $63,667
- Composite
- 44.83/100
- National rank
- #2733
- State rank
- #134 of 517 in CA
Livability — Rowland Heights
- Score
- 50/100
- State rank
- #1123
- US rank
- #25637
Category grades
Schools grade is shown separately in the Schools card above.
Census & demographics
- Census place
- Rowland Heights, CA
- County
- Los Angeles County · 9,444,647 people
- City population
- 42,463
- Metro
- Los Angeles-Long Beach-Anaheim, CA
- Population (ZIP)
- 42,463
- Household income
- $83,428
- Rent vs Own
- Severe rent burden
- 1440.0
Population outlook (Los Angeles County) Hauer SSP2
- Today (2025)
- 10,940,515 people
- By 2030
- 11,256,481 · +2.9%
- By 2040
- 11,729,929 · +7.2%
- By 2050
- 11,948,407 · +9.2%
- By 2075
- 11,818,114 · +8.0%
- By 2100
- 10,842,928 · -0.9%
Race, ethnicity, and origin ACS 2023
- Neighborhood character
- Majority Asian (59%)
- Race & ethnicity
- Asian 59% Hispanic / Latino 31% Two or more races 6% White 6% Black 1%
- Hispanic origin (detail)
- Mexican 25%
- Foreign-born
- 55% · China, Canada, South Korea
- Languages at home
- 25% English-only · Chinese 37% Spanish 22% Tagalog/Filipino 5%
Political lean MEDSL · Los Angeles
- 2024 margin
- Solid D (+32.9) · D 64.8% · R 31.9% · Other 3.3%
- 2008→2024 swing
- -7.4pp toward R · 2008: 40.4pp · 2024: 32.9pp
- All cycles
- 2024: D+32.9 2020: D+44.2 2016: D+48.0 2012: D+40.0 2008: D+40.4
Not yet ingested
- Civics
- —
Market trends
- HPI YoY
- ▼ -754.24%
- Current HPI
- 364.5923
- Rent YoY
- ▲ 10.27%
- Metro
- Los Angeles-Long Beach-Anaheim, CA
- State GDP YoY
- ▲ 3.21%
- F500 in state
- 116
Industry mix (Fortune 500 HQ in CA)
| Industry | F500 HQs | Revenue |
|---|---|---|
| Technology | 27 | $1,492B |
|
||
| Financial Services | 3 | $174B |
|
||
| Retail | 3 | $44B |
|
||
| Insurance | 3 | $26B |
|
||
| Media / Entertainment | 2 | $115B |
|
||
| Pharmaceuticals / Biotech | 2 | $62B |
|
||
Price history
+2.5% since first listed7 events — show timeline
- 2025-12-11 Listed $328,000 CRMLS
- 2025-02-24 Sold (MLS) $295,000 CRMLS
- 2025-02-24 Sold (MLS) $295,000 CRMLS
- 2024-12-14 Pending — CRMLS
- 2024-12-14 Pending — CRMLS
- 2024-11-12 Listed $320,000 CRMLS
- 2024-10-15 Listed $320,000 CRMLS
Property tax history
+5.6%/yrLatest (2025): $700 · +5.6% YoY. Source: county tax records.
Cash-flow waterfall
monthlySold comps — $/sqft
last 12 mo · ≤1 miLoading sold comps…