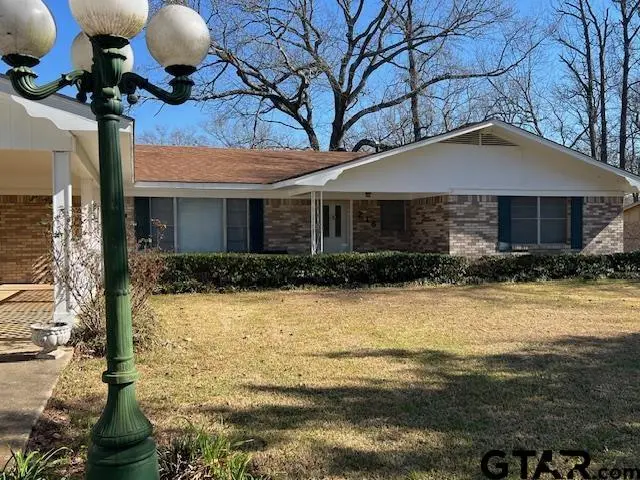
216 Arch Davis Rd · Pittsburg, TX
Flood risk 1/10 · Minimal
- FEMA flood zone
- X
- Chance of flooding over 30 yrs
- 0.0%
- Est. flood insurance / yr
- $507 – $1,088
Fire risk 5/10 · Moderate
- Est. fire insurance / yr
- $1,222 – $2,270
Heat risk 7/10 · Major
- Hot days now (above 111°F)
- 7 days/yr
- Hot days in 30 yrs
- 23 days/yr
Wind risk 6/10 · Moderate
- Chance of severe wind over 30 yrs
- 27.0%
Air-quality risk 2/10 · Minimal
- Unhealthy air days now
- 1 days/yr
- Unhealthy air days in 30 yrs
- 1 days/yr
Risk factors via First Street. Map © Google.
Why this score? — see what drove the D grade
The composite is a weighted blend of 9 inputs, each scored 0–100. Each bar is that input's sub-score; the figure is the points it added to the 100-point composite (weight × sub-score).
- Cash flow +16.0/30.0
- DSCR +5.0/10.0
- 1% rule +4.1/10.0
- Schools +4.1/10.0
- Livability +3.8/5.0
- ARV discount +2.7/15.0
- Rent growth +2.5/5.0
- Condition / age +2.5/5.0
- Appreciation +0.0/10.0
$199,000
🖨 Deal sheet (PDF) 📄 Offer letter ✓ Due diligence
Listing remarks MLS
Built in 1973 and full of potential, this 1,706 sq. ft. home sits on a generous . 44-acre lot just minutes from town. Offering three bedrooms and two baths, the layout provides comfortable living space with great opportunity to update and make it your own. A bright sunroom adds additional living space. .. perfect for morning coffee, hobbies or relaxing your-round. The home features built-in shelves and cabinets throughout, providing abundant storage and character. Outside, you'll find two outbuildings ideal for a workshop, storage or hobby space. The spacious lot offers room for gardening, outdoor entertaining or simply enjoying the peaceful setting. This property is ready for some tender loving care and updates, making it w wonderful opportunity for buyers looking to add personal touches and build equity. This home is ready for its next chapter.
Key facts
- Generous lot
- Outdoor entertaining
- Outbuildings
Tags
Neighborhood map
What this means for you Summary
Snapshot
- This is a 3-bed/2.0-bath single-family listed at $199k.
Deal economics
- At list price, monthly cash flow is $99 ($1k/yr) — positive.
- The deal already cash-flows at list — no discount required.
- To meet the 1% rule (rent ≥ 1% of price), the offer needs to be $182k (8.7% below list).
- Recommended offer: $181k (9.0% below list) — sets the bar for market timing.
- Cap rate 6.9% vs local median 5.1% in Pittsburg — top-decile yield for the area; either an underpriced asset or a hidden risk that comps aren't pricing in. Stress-test before assuming the spread holds.
Location & tenants
- Location reads 75/100 on livability (#144 in TX, #4,098 nationally) — a middle-class / working-renter tenant base. Strengths: cost of living A+, housing A+, health & safety A; Watch: crime C-, amenities D+, employment D+.
- Pittsburg ISD (town): math 54% / reading 44% proficiency, ranked #216 of 826 in TX (top 26%) — families likely to look elsewhere, expect single-tenant / working-renter base with shorter leases; 68% free/reduced lunch — lower-income household profile, screen leases tightly.
- Zoned schools: Pittsburg El (math 34% / reading 35%, grade F, #1,995 of 4,322 statewide, top 50%, 545 students, 80% FRL); Pittsburg J H (math 48% / reading 43%, grade D+, #470 of 1,662 statewide, top 29%, 349 students, 82% FRL); Pittsburg H S (math 62% / reading 52%, grade C, #333 of 1,632 statewide, top 22%, 726 students, 78% FRL).
- Market conditions: 313 active listings in the ZIP; 3 units permitted in Camp County in 2024 (0 in 5+ unit buildings).
Forward outlook
- Local home prices are declining (-3.0%/yr); year-one equity from $1k of loan paydown is wiped out by about $6k of value loss. Plan a longer hold.
- Camp County population projected at +13% by 2050 — modest demand growth; plan on rents tracking national, not racing it.
Negotiation context
- It's been on market 111 days — a 9% lower offer ($181k) is reasonable based on typical stale-listing flexibility.
Risks & watch-outs
- Climate carrying-cost: major wind risk, 27% chance of damaging wind over 30y; moderate wildfire risk; extreme-heat days projected 7→23/yr by 2055 (HVAC capex compounding) — expect insurance premiums to compound above CPI over the hold.
Questions for the listing agent
- It's been on market 111 days. Have you received any prior offers? Is the seller open to a 9% concession, seller financing, or rate buy-down credit?
- Built in 1973 — when were the roof, HVAC, electrical panel, plumbing, and water heater last replaced?
- Why hasn't it sold? Are there any deal-killer items the seller is aware of (foundation, flood, title, zoning, code violations)?
- Is there a deadline driving the sale (1031 exchange, divorce, estate, relocation)? That informs how much negotiation room exists.
- Schools are B-rated — typically a magnet for longer-tenancy family renters. What's the average tenant stay here, and is there a school-zone premium baked into asking?
- The area grade is low — what's the realistic commute time and amenity access for the typical tenant pool here? Any planned neighborhood developments (good or bad) we should know about?
- What's the average days-on-market for RENTAL listings here right now (not sales)? A rising rental-DOM trend means longer vacancies and softer asking-rent achievability than the comps imply.
- What's the recent tenant-quality profile in this submarket — average credit score on applications, eviction rate, late-payment / NSF rate, and stable-employment percentage? A property-management company in the area should have these aggregated.
- How much new for-sale + rental construction is in the pipeline within 1–3 miles? Heavy new supply typically softens prices + rents 12–24 months out; constrained supply supports both.
Investment metrics
- 1% rule
- 0.91% ✗
- Cap rate
- 6.89%
- Cash-on-cash
- 2.14%
- DSCR
- 1.10
- GRM
- 9.1
CMA / ARV
- ARV (median comp)
- $179,947
- List price
- $199,000
- Delta
- 10.59%
- Verdict
- OVERPRICED
- Comps
- 14 within 1.0 mi
Show comp detail 1 sale within ~0.75 mi
| Address | Dist | Beds/Ba | Sqft | Sold | Price | $/sf | Match |
|---|---|---|---|---|---|---|---|
| 608 Lafayette | 0.22mi | 3/2.0 | 1,844 (+8%) | 16mo | $100,000 | $54 | 63 |
Match score weights: distance 35% · size 25% · config 20% · recency 20%. Top-matched comps best support the ARV.
Projected returns pro-forma
-3.0% appreciation · 3.0% rent growth · sell at horizon
- IRR
- -12.9%
- Equity multiple
- 0.53×
- Total profit
- $-25,916
- Equity at exit
- $29,672
- IRR
- -3.9%
- Equity multiple
- 0.74×
- Total profit
- $-14,408
- Equity at exit
- $17,206
Cash invested: $55,720 (down + closing). Projections, not guarantees.
Landlord ↔ Tenant lean methodology
- Overall (STATE)
- 87 Strongly Landlord-Friendly
- State Texas
- 87 Strongly Landlord-Friendly · R+5
- County
- — inherits STATE
- City
- — inherits STATE
ZIP-level market 75686
- Home prices YoY
- -21.6%
- Active inventory
- 313
- Price-to-rent
- 9.1×
Monthly cashflow live
- Estimated rent
- $1,816 medium interval (Pro) →
- Mortgage (P&I)
- −$1,044
- Tax from tax record
- −$209 /mo · $2,505/yr
- Insurance
- −$83
- HOA
- −$0
- Vacancy / Maint / Mgmt
- −$381
- Net cashflow
- $99
Break-even live
Sensitivity live
| Price | -10% $212 | -5% $156 | +0% $99 | +5% $43 | +10% $-13 |
|---|---|---|---|---|---|
| Rent | -10% $-44 | -5% $28 | +0% $99 | +5% $171 | +10% $243 |
| Rate | -1.0pp $200 | -0.5pp $150 | base $99 | +0.5pp $48 | +1.0pp $-5 |
UW: 25.0% down · 7.5% · 30yr · 1.5% tax · 5.0% vac · 8.0% maint · 8.0% mgmt
Financing live
Cash to close
- Down payment
- $49,750
- Closing costs
- $5,970
- Reserves months
- —
- Total cash needed
- —
Loan-product check · same deal, 3 products live
Conventional
25% down · 7.5% · 30yr
- Down + closing
- —
- Monthly P&I
- —
- Monthly cashflow
- —
- DSCR
- —
- Eligible?
- —
Personal DTI + credit; lowest rate.
DSCR
20% down · 8.5% · 30yr
- Down + closing
- —
- Monthly P&I
- —
- Monthly cashflow
- —
- DSCR
- —
- Eligible?
- —
No personal income docs; deal must DSCR.
Hard money
10% down · 12.0% · 12mo
- Down + closing
- —
- Monthly P&I
- —
- Monthly cashflow
- —
- DSCR
- —
- Eligible?
- —
Short-term bridge; refi at stabilization.
Listing history 19 events
-
2026-06-21days on market $199,000 Active 111 DOM
-
2026-06-19days on market $199,000 Active 109 DOM
-
2026-06-18days on market $199,000 Active 108 DOM
-
2026-06-17days on market $199,000 Active 107 DOM
-
2026-06-16days on market $199,000 Active 106 DOM
-
2026-06-15days on market $199,000 Active 105 DOM
-
2026-06-14days on market $199,000 Active 103 DOM
-
2026-06-12days on market $199,000 Active 102 DOM
-
2026-06-09days on market $199,000 Active 99 DOM
-
2026-06-08days on market $199,000 Active 98 DOM
-
2026-06-07days on market $199,000 Active 97 DOM
-
2026-06-05days on market $199,000 Active 95 DOM
-
2026-06-03days on market $199,000 Active 93 DOM
-
2026-06-02days on market $199,000 Active 92 DOM
-
2026-06-01days on market $199,000 Active 91 DOM
-
2026-05-31days on market $199,000 Active 90 DOM
-
2026-05-30days on market $199,000 Active 89 DOM
-
2026-03-02$230,000 Active 858-char remark
Show marketing remark (858 chars)
Built in 1973 and full of potential, this 1,706 sq. ft. home sits on a generous . 44-acre lot just minutes from town. Offering three bedrooms and two baths, the layout provides comfortable living space with great opportunity to update and make it your own. A bright sunroom adds additional living space. .. perfect for morning coffee, hobbies or relaxing your-round. The home features built-in shelves and cabinets throughout, providing abundant storage and character. Outside, you'll find two outbuildings ideal for a workshop, storage or hobby space. The spacious lot offers room for gardening, outdoor entertaining or simply enjoying the peaceful setting. This property is ready for some tender loving care and updates, making it w wonderful opportunity for buyers looking to add personal touches and build equity. This home is ready for its next chapter.
-
2025-08-01price $269,000
ⓘ Source: listings_history table (triggers on properties + properties_extension) + one-shot
backfill from property_details.listing_events for pre-trigger history.
Tax reassessment forecast TX · Resets to sale price
- Current annual tax
- $2,505 · $209/mo
- Projected year-2 tax
- $3,642 · $303/mo
- Expected delta
- +$1,137/yr (+$95/mo · 45.4%)
ⓘ Screening estimate from a state-policy table — verify with the county assessor before closing.
Climate risk First Street
- Flood 1/10 Low FEMA zone X · 0% chance over 30 yrs
- Wildfire 5/10 Major
- Heat 7/10 Severe 7 d/yr ≥111°F today · 23 d/yr by 30 yrs out
- Wind 6/10 Major 27% chance of damaging wind over 30 yrs
- Air quality 2/10 Low 1 unhealthy d/yr today · 1 by 30 yrs out
Nearby sold comps map
Loading sold comps map…
Walkable amenities ~0.75 mi
Loading nearby amenities…
Taxation est. · year 1
- Rental income
- $21,791
- − Mortgage interest
- −$11,147
- − Property taxes
- −$2,505
- − Insurance
- −$995
- − Repairs & maintenance
- −$1,743
- − Management
- −$1,743
- − Depreciation
- −$5,789
- Taxable loss
- −$2,132
- Est. tax savings @ 24.0%
- +$512
- After-tax cash flow
- $1,704/yr
For passive investors: Depreciation is non-cash, so a rental often shows a tax loss while cash-flowing — sheltering income. Rental losses are passive: they offset passive income freely, and up to $25,000/yr can offset ordinary (W-2) income if you actively participate and your MAGI is under $100k (phasing out to $0 by $150k); unused losses carry forward. On sale, claimed depreciation is recaptured at up to 25%, and gains may owe capital-gains tax (a 1031 exchange can defer both). Figures are a year-1 estimate at your 24.0% rate — not tax advice; consult a CPA.
Schools (NCES district)
- District
- Pittsburg ISD
- NCES district ID
- 4835010
- Math proficiency
- 54% ▼ -16.00%
- Reading proficiency
- 44% ▼ -16.00%
- Median HH income
- $38,136
- Composite
- 40.87/100
- National rank
- #3627
- State rank
- #216 of 826 in TX
Livability — Pittsburg
- Score
- 75/100
- State rank
- #144
- US rank
- #4098
Category grades
Schools grade is shown separately in the Schools card above.
Census & demographics
- Census place
- Pittsburg, TX
- Population (ZIP)
- 13,427
Population outlook (Camp County) Hauer SSP2
- Today (2025)
- 13,403 people
- By 2030
- 13,741 · +2.5%
- By 2040
- 14,436 · +7.7%
- By 2050
- 15,135 · +12.9%
- By 2075
- 16,836 · +25.6%
- By 2100
- 17,582 · +31.2%
Race, ethnicity, and origin ACS 2023
- Neighborhood character
- Diverse neighborhood (Simpson 0.63)
- Race & ethnicity
- White 52% Hispanic / Latino 28% Two or more races 16% Black 14% Asian 1%
- Hispanic origin (detail)
- Mexican 25%
- Common ancestry
- Slovak 1% Scottish 1% Serbian 1%
- Foreign-born
- 11% · Canada, Vietnam, Dominican Republic
- Languages at home
- 79% English-only · Spanish 20% Vietnamese 1%
Political lean MEDSL · Camp
- 2024 margin
- Solid R (+53.6) · D 22.9% · R 76.5%
- 2008→2024 swing
- -30.3pp toward R · 2008: -23.3pp · 2024: -53.6pp
- All cycles
- 2024: R+53.6 2020: R+44.1 2016: R+42.7 2012: R+33.5 2008: R+23.3
Not yet ingested
- Civics
- —
Market trends
- HPI YoY
- ▼ -50.12%
- Current HPI
- 181.5522
- Rent YoY
- —
- Metro
- —
- State GDP YoY
- ▲ 3.95%
- F500 in state
- 110
Industry mix (Fortune 500 HQ in TX)
| Industry | F500 HQs | Revenue |
|---|---|---|
| Energy | 16 | $1,198B |
|
||
| Technology | 5 | $198B |
|
||
| Engineering / Construction | 4 | $72B |
|
||
| Energy Services | 3 | $60B |
|
||
| Utilities | 3 | $41B |
|
||
| Healthcare | 2 | $330B |
|
||
Price history
-14.5% since first listed2 events — show timeline
- 2026-03-02 Listed $230,000 GTAR
- 2025-08-01 Price Changed $269,000 GTAR
Property tax history
+2.8%/yrLatest (2025): $2,505 · +0.1% YoY. Source: county tax records.
Cash-flow waterfall
monthlySold comps — $/sqft
last 12 mo · ≤1 miLoading sold comps…