3310 White Indigo Rd · Winter Haven, FL
Flood risk 1/10 · Minimal
- FEMA flood zone
- X (unshaded)
- Chance of flooding over 30 yrs
- 0.0%
- Est. flood insurance / yr
- $507 – $1,088
Fire risk 5/10 · Moderate
- Est. fire insurance / yr
- $947 – $1,759
Heat risk 8/10 · Major
- Hot days now (above 107°F)
- 7 days/yr
- Hot days in 30 yrs
- 24 days/yr
Wind risk 10/10 · Severe
- Chance of severe wind over 30 yrs
- 99.0%
Air-quality risk 2/10 · Minimal
- Unhealthy air days now
- 0 days/yr
- Unhealthy air days in 30 yrs
- 2 days/yr
Risk factors via First Street. Map © Google.
Why this score? — see what drove the D- grade
The composite is a weighted blend of 9 inputs, each scored 0–100. Each bar is that input's sub-score; the figure is the points it added to the 100-point composite (weight × sub-score).
- Cash flow +9.7/30.0
- ARV discount +7.5/15.0
- Livability +3.7/5.0
- Schools +3.5/10.0
- 1% rule +3.2/10.0
- Rent growth +3.0/5.0
- DSCR +2.7/10.0
- Condition / age +2.5/5.0
- Appreciation +0.0/10.0
$296,900
🖨 Deal sheet (PDF) 📄 Offer letter ✓ Due diligence
Listing remarks
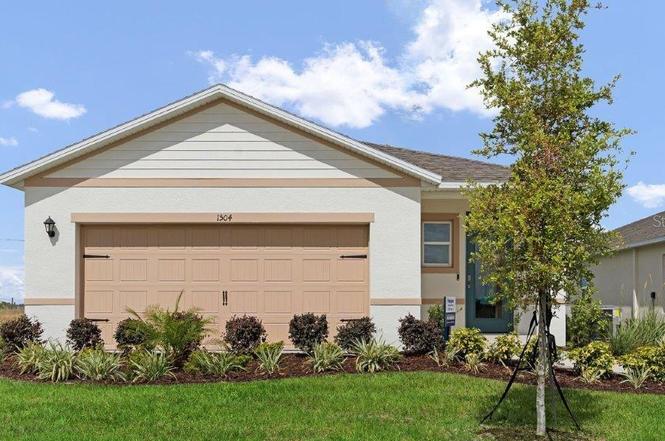
Pre-Construction. To be built. Introducing the Harper floorplan at Harmony at Lake Eloise, where every square foot is put to use with sophistication and comfort. Inside this 4 bedroom, 2 bathroom home, you’ll find 1,665 square feet of comfortable living. This meticulously designed residence combines modern convenience with timeless elegance, showcasing granite and tile floors throughout. As you step inside, you are greeted by an inviting foyer that leads you into the heart of the home. The open-concept layout seamlessly connects the living room, dining area, and kitchen, creating a perfect space for entertaining family and friends. The spacious living room features abundant natural li
Key facts
- Large windows
- Granite countertops
- Chef's kitchen
Tags
Property features AI
Finance
- Other: Home warranty provided; Lease restrictions apply
- Financial info: Monthly HOA $69 (total monthly fees listed $69); Total annual HOA fees $828
- HOA & community: HOA managed by Leland Management (monthly fee $69, required); Pets allowed; CDD present
Exterior
- Parking: Attached 2-car garage
- Utilities: Public water; Public sewer; Phone service available
- Home design: Single family residence; One story; South-facing; Pre‑construction (projected completion April 13, 2026); Attached property
- Construction: Block and stucco construction; Shingle roof; Slab foundation; New construction; Builder: D.R. Horton (Model: Harper); Builder license: cbc1265174; Permit number: 2025-110479; Lot about 0.13 acres
- Exterior features: Paved road access
Interior
- Kitchen: Dishwasher; Microwave; Refrigerator
- Bedrooms: 4 bedrooms
- Flooring: Carpet
- Bathrooms: 2 full bathrooms
- Heating & cooling: Central heating; Central air conditioning
- Interior features: Open floorplan
- Laundry & utility: Laundry room; Washer; Dryer; Irrigation equipment
Neighborhood map
What this means for you Summary
Snapshot
- This is a 4-bed/2.0-bath land listed at $297k.
Deal economics
- At list price, monthly cash flow is $-198 ($-2k/yr) — negative.
- To cash-flow at today's rent, offer at most $268k (9.6% below list).
- To meet the 1% rule (rent ≥ 1% of price), the offer needs to be $243k (18.0% below list).
- Recommended offer: $243k (18.0% below list) — sets the bar for 1% rule.
Location & tenants
- Location reads 74/100 on livability (#291 in FL, #4,898 nationally) — a middle-class / working-renter tenant base. Strengths: cost of living A+, housing A+, health & safety A; Watch: employment C-, amenities F, commute F.
- Polk (suburban): math 39% / reading 43% proficiency, ranked #62 of 73 in FL (top 85%) — families likely to look elsewhere, expect single-tenant / working-renter base with shorter leases.
- Zoned schools: John Snively Elementary (math 42% / reading 42%, grade F, #1,403 of 2,144 statewide, top 67%, 399 students, 72% FRL); Denison Middle School (math 24% / reading 25%, grade F, #522 of 571 statewide, top 93%, 738 students, 69% FRL); Lake Region High School (math 14% / reading 22%, grade F, #570 of 667 statewide, top 86%, 1,545 students, 61% FRL).
- Zoned-school proficiency averages 28% at this address vs 41% district-wide (-13 pts) — the specific schools serving this property underperform the Polk average; the district grade overstates school quality for this exact location.
- Market conditions: Rents rising (+1.9%/yr); 689 active listings in the ZIP; 10 comparable units currently listed for rent nearby; rentals at typical pace (median 21d on market — plan ~3-4 weeks tenant-placement turnaround); 10,384 units permitted in Polk County in 2024 (1,716 in 5+ unit buildings).
- This rent runs 41% of the median local income ($70k/yr) — at the standard rent-burdened threshold; future hikes will face affordability resistance.
Forward outlook
- Local home prices are declining (-3.0%/yr); year-one equity from $2k of loan paydown is wiped out by about $9k of value loss. Plan a longer hold.
- Polk County population projected at +33% by 2050 — long-run rental-demand tailwind backs the buy-and-hold thesis.
Negotiation context
- It's been on market 118 days — a 9% lower offer ($270k) is reasonable based on typical stale-listing flexibility.
Risks & watch-outs
- Climate carrying-cost: severe wind risk, 99% chance of damaging wind over 30y; moderate wildfire risk; extreme-heat days projected 7→24/yr by 2055 (HVAC capex compounding) — expect insurance premiums to compound above CPI over the hold.
Questions for the listing agent
- What do current leases actually rent for vs. the listed asking? Can we see a recent rent roll and the last 12 months of T-12 income?
- It's been on market 118 days. Have you received any prior offers? Is the seller open to a 18% concession, seller financing, or rate buy-down credit?
- What does the HOA fee cover, when was the last increase, and are there any pending special assessments or reserve-fund shortfalls?
- Why hasn't it sold? Are there any deal-killer items the seller is aware of (foundation, flood, title, zoning, code violations)?
- Is there a deadline driving the sale (1031 exchange, divorce, estate, relocation)? That informs how much negotiation room exists.
- The area grade is low — what's the realistic commute time and amenity access for the typical tenant pool here? Any planned neighborhood developments (good or bad) we should know about?
- What's the average days-on-market for RENTAL listings here right now (not sales)? A rising rental-DOM trend means longer vacancies and softer asking-rent achievability than the comps imply.
- What's the recent tenant-quality profile in this submarket — average credit score on applications, eviction rate, late-payment / NSF rate, and stable-employment percentage? A property-management company in the area should have these aggregated.
- How much new for-sale + rental construction is in the pipeline within 1–3 miles? Heavy new supply typically softens prices + rents 12–24 months out; constrained supply supports both.
Investment metrics
- 1% rule
- 0.82% ✗
- Cap rate
- 5.49%
- Cash-on-cash
- -2.86%
- DSCR
- 0.87
- GRM
- 10.2
CMA / ARV
No comps found within radius.
Projected returns pro-forma
-3.0% appreciation · 1.9% rent growth · sell at horizon
- IRR
- -22.3%
- Equity multiple
- 0.24×
- Total profit
- $-63,303
- Equity at exit
- $44,269
- IRR
- -19.4%
- Equity multiple
- 0.02×
- Total profit
- $-81,731
- Equity at exit
- $25,670
Cash invested: $83,132 (down + closing). Projections, not guarantees.
Landlord ↔ Tenant lean methodology
- Overall (STATE)
- 87 Strongly Landlord-Friendly
- State Florida
- 87 Strongly Landlord-Friendly · R+3
- County
- — inherits STATE
- City
- — inherits STATE
ZIP-level market 33884
- Home prices YoY
- -34.1%
- Rents YoY
- 1.9%
- Active inventory
- 689
- Price-to-rent
- 10.2×
Monthly cashflow live
- Estimated rent
- $2,434 high interval (Pro) →
- Mortgage (P&I)
- −$1,557
- Tax est. 1.5%
- −$371 /mo · $4,454/yr
- Insurance
- −$124
- HOA
- −$69
- Vacancy / Maint / Mgmt
- −$511
- Net cashflow
- $-198
Break-even live
Sensitivity live
| Price | -10% $7 | -5% $-95 | +0% $-198 | +5% $-301 | +10% $-403 |
|---|---|---|---|---|---|
| Rent | -10% $-390 | -5% $-294 | +0% $-198 | +5% $-102 | +10% $-6 |
| Rate | -1.0pp $-48 | -0.5pp $-122 | base $-198 | +0.5pp $-275 | +1.0pp $-353 |
UW: 25.0% down · 7.5% · 30yr · 1.5% tax · 5.0% vac · 8.0% maint · 8.0% mgmt
Financing live
Cash to close
- Down payment
- $74,225
- Closing costs
- $8,907
- Reserves months
- —
- Total cash needed
- —
Loan-product check · same deal, 3 products live
Conventional
25% down · 7.5% · 30yr
- Down + closing
- —
- Monthly P&I
- —
- Monthly cashflow
- —
- DSCR
- —
- Eligible?
- —
Personal DTI + credit; lowest rate.
DSCR
20% down · 8.5% · 30yr
- Down + closing
- —
- Monthly P&I
- —
- Monthly cashflow
- —
- DSCR
- —
- Eligible?
- —
No personal income docs; deal must DSCR.
Hard money
10% down · 12.0% · 12mo
- Down + closing
- —
- Monthly P&I
- —
- Monthly cashflow
- —
- DSCR
- —
- Eligible?
- —
Short-term bridge; refi at stabilization.
Rent comps 10 comps
| Address | Beds | Baths | Sqft | Rent | $/sqft | DOM | Units | Dist |
|---|---|---|---|---|---|---|---|---|
| 2587 Sage Valley Way Winter Haven, FL | 3.0 | 2.0 | 1535 | $2,300 | $1.50 | 16d | 1 | 0.38mi |
| 1504 Hummingbird Rd Winter Haven, FL | 4.0 | 2.5 | 1942 | $2,599 | $1.34 | 5d | 1 | 0.66mi |
| 1504 Hummingbird Rd Winter Haven, FL | 4.0 | 2.5 | 1942 | $2,599 | $1.34 | 25d | 1 | 0.66mi |
| 2249 9th St SE Winter Haven, FL | 3.0 | 2.0 | 1520 | $1,449 | $0.95 | 21d | 1 | 0.98mi |
| 2442 Taloncrest Ct Eagle Lake, FL | 4.0 | 2.0 | 1851 | $2,700 | $1.46 | 25d | 1 | 1.20mi |
| 2000 Golden Beak Dr Eagle Lake, FL | 3.0 | 2.0 | 1545 | $1,990 | $1.29 | 16d | 1 | 1.25mi |
| 109 Solis Dr Winter Haven, FL | 3.0 | 2.0 | 1625 | $2,086 | $1.28 | 5d | 1 | 1.34mi |
| 919 S AVE SE Unit 1325030P Eloise, FL | 3.0 | 2.0 | 1722 | $2,954 | $1.72 | 4d | 1 | 1.38mi |
| 301 Majestic Gardens Dr Winter Haven, FL | 3.0 | 2.0 | 1951 | $2,020 | $1.04 | 21d | 1 | 1.42mi |
| 2029 Carroll Ln Winter Haven, FL | 4.0 | 3.0 | 2097 | $2,500 | $1.19 | 23d | 1 | 1.47mi |
HOA detail
- Monthly dues
- $69 · $828/yr
Listing history 18 events
-
2026-06-22days on market $296,900 Active 118 DOM
-
2026-06-18days on market $296,900 Active 115 DOM
-
2026-06-17days on market $296,900 Active 114 DOM
-
2026-06-16days on market $296,900 Active 113 DOM
-
2026-06-15days on market $296,900 Active 112 DOM
-
2026-06-13pricedays on market $296,900 Active 110 DOM
-
2026-06-10days on market $298,900 Active 107 DOM
-
2026-06-09days on market $298,900 Active 106 DOM
-
2026-06-08days on market $298,900 Active 105 DOM
-
2026-06-07days on market $298,900 Active 104 DOM
-
2026-06-05days on market $298,900 Active 101 DOM
-
2026-06-03days on market $298,900 Active 99 DOM
-
2026-06-01days on market $298,900 Active 98 DOM
-
2026-05-31days on market $298,900 Active 97 DOM
-
2026-05-08price $302,890
-
2026-04-17price $301,890
-
2026-03-31price $304,990
-
2026-02-23$302,990 Active
ⓘ Source: listings_history table (triggers on properties + properties_extension) + one-shot
backfill from property_details.listing_events for pre-trigger history.
Climate risk First Street
- Flood 1/10 Low FEMA zone X (unshaded) · 0% chance over 30 yrs
- Wildfire 5/10 Major
- Heat 8/10 Severe 7 d/yr ≥107°F today · 24 d/yr by 30 yrs out
- Wind 10/10 Extreme 99% chance of damaging wind over 30 yrs
- Air quality 2/10 Low 0 unhealthy d/yr today · 2 by 30 yrs out
Nearby sold comps map
Loading sold comps map…
Walkable amenities ~0.75 mi
Loading nearby amenities…
Taxation est. · year 1
- Rental income
- $29,208
- − Mortgage interest
- −$16,631
- − Property taxes
- −$4,454
- − Insurance
- −$1,484
- − Repairs & maintenance
- −$2,337
- − Management
- −$2,337
- − HOA
- −$828
- − Depreciation
- −$8,637
- Taxable loss
- −$7,499
- Est. tax savings @ 24.0%
- +$1,800
- After-tax cash flow
- $-575/yr
For passive investors: Depreciation is non-cash, so a rental often shows a tax loss while cash-flowing — sheltering income. Rental losses are passive: they offset passive income freely, and up to $25,000/yr can offset ordinary (W-2) income if you actively participate and your MAGI is under $100k (phasing out to $0 by $150k); unused losses carry forward. On sale, claimed depreciation is recaptured at up to 25%, and gains may owe capital-gains tax (a 1031 exchange can defer both). Figures are a year-1 estimate at your 24.0% rate — not tax advice; consult a CPA.
Schools (NCES district)
- District
- Polk
- NCES district ID
- 1201590
- Math proficiency
- 39% ▼ -11.00%
- Reading proficiency
- 43% ▼ -4.00%
- Median HH income
- $43,979
- Composite
- 34.74/100
- National rank
- #5132
- State rank
- #62 of 73 in FL
Livability — Winter Haven
- Score
- 74/100
- State rank
- #291
- US rank
- #4898
Category grades
Schools grade is shown separately in the Schools card above.
Census & demographics
- Census place
- Winter Haven, FL
- County
- Polk County · 740,051 people
- City population
- 121,740
- Metro
- Lakeland-Winter Haven, FL
- Population (ZIP)
- 37,561
- Household income
- $70,443
- Rent vs Own
- Severe rent burden
- 949.0
Population outlook (Polk County) Hauer SSP2
- Today (2025)
- 752,975 people
- By 2030
- 804,621 · +6.9%
- By 2040
- 906,117 · +20.3%
- By 2050
- 1,000,476 · +32.9%
- By 2075
- 1,197,520 · +59.0%
- By 2100
- 1,271,518 · +68.9%
Race, ethnicity, and origin ACS 2023
- Neighborhood character
- Diverse neighborhood (Simpson 0.55)
- Race & ethnicity
- White 63% Hispanic / Latino 19% Black 14% Two or more races 7% Asian 2%
- Hispanic origin (detail)
- Mexican 2% Puerto Rican 10% Cuban 2%
- Common ancestry
- Romanian 2% Lithuanian 2% Hispanic 2%
- Foreign-born
- 7% · Canada, Jamaica
- Languages at home
- 84% English-only · Spanish 12% French/Haitian/Cajun 1% Other Indo-European 1%
Political lean MEDSL · Polk
- 2024 margin
- Strong R (+20.7) · D 39.2% · R 59.9%
- 2008→2024 swing
- -14.6pp toward R · 2008: -6.1pp · 2024: -20.7pp
- All cycles
- 2024: R+20.7 2020: R+14.4 2016: R+14.1 2012: R+6.8 2008: R+6.1
Not yet ingested
- Civics
- —
Market trends
- HPI YoY
- ▼ -134.69%
- Current HPI
- 260.1421
- Rent YoY
- ▲ 1.90%
- Metro
- Lakeland-Winter Haven, FL
- State GDP YoY
- ▲ 3.28%
- F500 in state
- 36
Industry mix (Fortune 500 HQ in FL)
| Industry | F500 HQs | Revenue |
|---|---|---|
| Industrial Technology | 2 | $29B |
|
||
| Insurance | 2 | $17B |
|
||
| Retail | 1 | $60B |
|
||
| Technology Distribution | 1 | $58B |
|
||
| Homebuilding | 1 | $35B |
|
||
| Technology Manufacturing | 1 | $35B |
|
||
Price history
-0.0% since first listed4 events — show timeline
- 2026-05-08 Price Changed $302,890 Stellar MLS as Distributed by MLS Grid
- 2026-04-17 Price Changed $301,890 Stellar MLS as Distributed by MLS Grid
- 2026-03-31 Price Changed $304,990 Stellar MLS as Distributed by MLS Grid
- 2026-02-23 Listed $302,990 Stellar MLS as Distributed by MLS Grid
Cash-flow waterfall
monthlySold comps — $/sqft
last 12 mo · ≤1 miLoading sold comps…