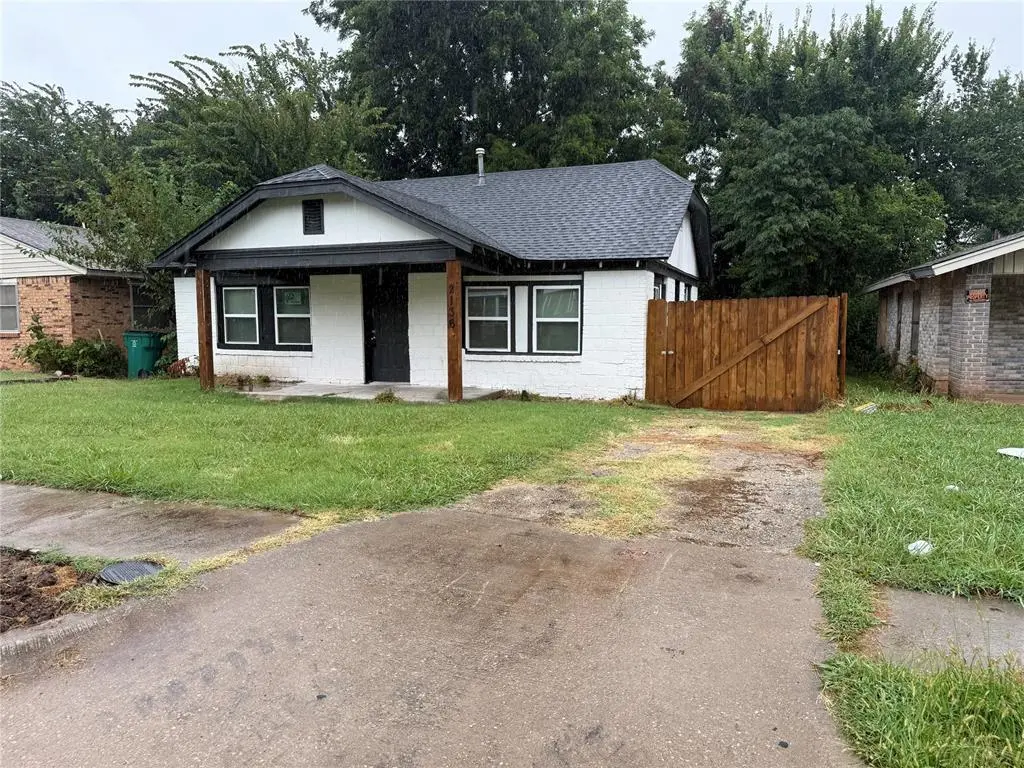
2136 N Jordan Ave · Oklahoma City, OK
Flood risk 1/10 · Minimal
- FEMA flood zone
- X (unshaded)
- Chance of flooding over 30 yrs
- 0.0%
- Est. flood insurance / yr
- $507 – $1,088
Fire risk 1/10 · Minimal
- Est. fire insurance / yr
- $2,463 – $4,575
Heat risk 5/10 · Moderate
- Hot days now (above 107°F)
- 6 days/yr
- Hot days in 30 yrs
- 16 days/yr
Wind risk 2/10 · Minimal
- Chance of severe wind over 30 yrs
- 3.0%
Air-quality risk 2/10 · Minimal
- Unhealthy air days now
- 1 days/yr
- Unhealthy air days in 30 yrs
- 2 days/yr
Risk factors via First Street. Map © Google.
Why this score? — see what drove the B- grade
The composite is a weighted blend of 9 inputs, each scored 0–100. Each bar is that input's sub-score; the figure is the points it added to the 100-point composite (weight × sub-score).
- Cash flow +26.2/30.0
- ARV discount +15.0/15.0
- DSCR +8.9/10.0
- 1% rule +6.0/10.0
- Livability +4.0/5.0
- Rent growth +3.0/5.0
- Condition / age +2.5/5.0
- Schools +0.7/10.0
- Appreciation +0.0/10.0
$104,999
🖨 Deal sheet (PDF) 📄 Offer letter ✓ Due diligence
Listing remarks MLS
Move-in ready 2 BR / 2 BA single-family home on a well-maintained lot in North East Oklahoma City. Open-concept living and dining with abundant natural light, remodeled kitchen featuring nice countertops, and tile backsplash. Spacious primary suite with private bath and ample closet space. Updated flooring throughout, energy-efficient windows, and central HVAC. Fully fenced backyard with lots of potential— ideal for entertaining and pets. The backyard includes private driveway parking. Convenient location near shopping, parks, schools and quick access to major routes. This Home is For Sale By Owner.
Key facts
- Remodeled kitchen
- Updated flooring
- Convenient location
Tags
Neighborhood map
What this means for you Summary
Snapshot
- This is a 3-bed/1.0-bath single-family listed at $105k.
Deal economics
- At list price, monthly cash flow is $267 ($3k/yr) — positive.
- The deal already cash-flows at list — no discount required.
- Meets the 1% rule at list price ($1k rent vs $105k).
- Recommended offer: $96k (9.0% below list) — sets the bar for market timing.
- Cap rate 9.3% vs local median 3.7% in Oklahoma City — top-decile yield for the area; either an underpriced asset or a hidden risk that comps aren't pricing in. Stress-test before assuming the spread holds.
Location & tenants
- Location reads 80/100 on livability (#3 in OK, #1,635 nationally) — a professional / high-income tenant draw. Strengths: amenities A+, commute A+, cost of living A+; Watch: schools F, crime F.
- Oklahoma City (urban): math 7% / reading 10% proficiency, ranked #254 of 270 in OK (top 94%) — low school quality limits family demand, transient renter base, plan for 1-2y turnover; 82% free/reduced lunch — lower-income household profile, screen leases tightly.
- Market conditions: Rents rising (+2.1%/yr); 81 active listings in the ZIP; 40 comparable units currently listed for rent nearby; rentals at typical pace (median 24d on market — plan ~3-4 weeks tenant-placement turnaround); 48% of comp listings sitting > 30 days — soft ceiling on asking rent; lower-income renter base — watch delinquency; 5,365 units permitted in Oklahoma County in 2024 (569 in 5+ unit buildings).
- This rent runs 34% of the median local income ($40k/yr) — at the standard rent-burdened threshold; future hikes will face affordability resistance.
Forward outlook
- Local home prices are declining (-3.0%/yr); year-one equity from $726 of loan paydown is wiped out by about $3k of value loss. Plan a longer hold.
- Oklahoma County population projected at +41% by 2050 — long-run rental-demand tailwind backs the buy-and-hold thesis.
Negotiation context
- It's been on market 100 days — a 9% lower offer ($96k) is reasonable based on typical stale-listing flexibility.
- 3 sale attempts; this cycle's ask has dropped $25k (19%) from the opening price — seller is motivated, your offer sets the floor, not the list.
Risks & watch-outs
- Watch-outs: built in 1944 — expect roof / HVAC / electrical / plumbing capex.
- Climate carrying-cost: extreme-heat days projected 6→16/yr by 2055 (HVAC capex compounding) — expect insurance premiums to compound above CPI over the hold.
Questions for the listing agent
- It's been on market 100 days. Have you received any prior offers? Is the seller open to a 9% concession, seller financing, or rate buy-down credit?
- Built in 1944 — when were the roof, HVAC, electrical panel, plumbing, and water heater last replaced?
- Why hasn't it sold? Are there any deal-killer items the seller is aware of (foundation, flood, title, zoning, code violations)?
- Is there a deadline driving the sale (1031 exchange, divorce, estate, relocation)? That informs how much negotiation room exists.
- Schools are F-rated, which usually means shorter tenancies and higher turnover. Who's the typical renter profile here, and what's been the actual vacancy rate?
- Crime grade is F in this area — have there been break-ins, vandalism, or insurance claims at this property in the last 3 years? What carrier currently insures it and at what premium?
- What's the average days-on-market for RENTAL listings here right now (not sales)? A rising rental-DOM trend means longer vacancies and softer asking-rent achievability than the comps imply.
- What's the recent tenant-quality profile in this submarket — average credit score on applications, eviction rate, late-payment / NSF rate, and stable-employment percentage? A property-management company in the area should have these aggregated.
- How much new for-sale + rental construction is in the pipeline within 1–3 miles? Heavy new supply typically softens prices + rents 12–24 months out; constrained supply supports both.
Investment metrics
- 1% rule
- 1.10% ✓
- Cap rate
- 9.35%
- Cash-on-cash
- 10.92%
- DSCR
- 1.49
- GRM
- 7.5
CMA / ARV
- ARV (median comp)
- $145,469
- List price
- $104,999
- Delta
- -27.82%
- Verdict
- UNDERPRICED
- Comps
- 20 within 1.0 mi
Show comp detail 12 sales within ~0.75 mi
| Address | Dist | Beds/Ba | Sqft | Sold | Price | $/sf | Match |
|---|---|---|---|---|---|---|---|
| 2131 N Jordan Ave | 0.03mi | 2/1.0 (-1) | 1,031 (+1%) | 2mo | $88,000 | $85 | 90 |
| 1542 NE 20th St | 0.11mi | 2/1.0 (-1) | 981 (-4%) | 2mo | $135,000 | $138 | 82 |
| 2221 N Lottie Ave | 0.38mi | 2/1.0 (-1) | 1,024 (+0%) | 2mo | $45,000 | $44 | 75 |
| 2204 N Jordan Ave | 0.05mi | 2/1.0 (-1) | 1,121 (+10%) | 3mo | $57,500 | $51 | 74 |
| 1600 E Madison St | 0.20mi | 3/1.0 | 1,134 (+11%) | 5mo | $95,000 | $84 | 68 |
| 1450 NE 16th Ter | 0.42mi | 3/1.0 | 1,096 (+8%) | 4mo | $135,000 | $123 | 65 |
| 1716 N Highland Dr | 0.66mi | 3/1.0 | 1,040 (+2%) | 7mo | $145,000 | $139 | 60 |
| 1720 Wickliff St | 0.33mi | 2/1.5 (-1) | 902 (-12%) | 0mo | $100,000 | $111 | 58 |
| 2715 N Missouri Ave | 0.50mi | 3/1.0 | 1,141 (+12%) | 6mo | $140,000 | $123 | 51 |
| 1521 NE 11th St | 0.73mi | 2/1.0 (-1) | 972 (-5%) | 4mo | $65,000 | $67 | 49 |
| 1449 NE 14th St | 0.50mi | 2/1.0 (-1) | 884 (-13%) | 2mo | $100,000 | $113 | 48 |
| 1620 NE 12th St | 0.63mi | 2/2.0 (-1) | 1,170 (+15%) | 2mo | $200,000 | $171 | 36 |
Match score weights: distance 35% · size 25% · config 20% · recency 20%. Top-matched comps best support the ARV.
Projected returns pro-forma
-3.0% appreciation · 2.13% rent growth · sell at horizon
- IRR
- -0.9%
- Equity multiple
- 0.97×
- Total profit
- $-1,017
- Equity at exit
- $15,656
- IRR
- 7.9%
- Equity multiple
- 1.57×
- Total profit
- $16,868
- Equity at exit
- $9,078
Cash invested: $29,400 (down + closing). Projections, not guarantees.
Landlord ↔ Tenant lean methodology
- Overall (STATE)
- 83 Strongly Landlord-Friendly
- State Oklahoma
- 83 Strongly Landlord-Friendly · R+20
- County
- — inherits STATE
- City
- — inherits STATE
ZIP-level market 73111
- Home prices YoY
- -13.6%
- Rents YoY
- 2.1%
- Active inventory
- 81
- Price-to-rent
- 7.5×
Monthly cashflow live
- Estimated rent
- $1,159 high interval (Pro) →
- Mortgage (P&I)
- −$551
- Tax from tax record
- −$54 /mo · $649/yr
- Insurance
- −$44
- HOA
- −$0
- Vacancy / Maint / Mgmt
- −$243
- Net cashflow
- $267
Break-even live
Sensitivity live
| Price | -10% $327 | -5% $297 | +0% $267 | +5% $238 | +10% $208 |
|---|---|---|---|---|---|
| Rent | -10% $176 | -5% $222 | +0% $267 | +5% $313 | +10% $359 |
| Rate | -1.0pp $320 | -0.5pp $294 | base $267 | +0.5pp $240 | +1.0pp $213 |
UW: 25.0% down · 7.5% · 30yr · 1.5% tax · 5.0% vac · 8.0% maint · 8.0% mgmt
Financing live
Cash to close
- Down payment
- $26,250
- Closing costs
- $3,150
- Reserves months
- —
- Total cash needed
- —
Loan-product check · same deal, 3 products live
Conventional
25% down · 7.5% · 30yr
- Down + closing
- —
- Monthly P&I
- —
- Monthly cashflow
- —
- DSCR
- —
- Eligible?
- —
Personal DTI + credit; lowest rate.
DSCR
20% down · 8.5% · 30yr
- Down + closing
- —
- Monthly P&I
- —
- Monthly cashflow
- —
- DSCR
- —
- Eligible?
- —
No personal income docs; deal must DSCR.
Hard money
10% down · 12.0% · 12mo
- Down + closing
- —
- Monthly P&I
- —
- Monthly cashflow
- —
- DSCR
- —
- Eligible?
- —
Short-term bridge; refi at stabilization.
Rent comps 40 comps
| Address | Beds | Baths | Sqft | Rent | $/sqft | DOM | Units | Dist |
|---|---|---|---|---|---|---|---|---|
| 1722 NE 20th St Oklahoma City, OK | 2.0 | 1.0 | 800 | $1,070 | $1.34 | 44d | 1 | 0.15mi |
| 1727 NE 19th St Oklahoma City, OK | 3.0 | 1.0 | 892 | $995 | $1.12 | 44d | 1 | 0.19mi |
| 1609 NE 18th St Oklahoma City, OK | 2.0 | 1.0 | 899 | $900 | $1.00 | 4d | 1 | 0.21mi |
| 1401 NE 22nd St Oklahoma City, OK | 2.0 | 1.0 | 728 | $1,100 | $1.51 | 24d | 1 | 0.25mi |
| 1439 NE 24th St Oklahoma City, OK | 3.0 | 1.0 | 874 | $1,025 | $1.17 | 16d | 1 | 0.26mi |
| 1426 NE 24th St Oklahoma City, OK | 4.0 | 1.0 | 1280 | $1,200 | $0.94 | 3d | 1 | 0.28mi |
| 1801 N Jordan Ave Oklahoma City, OK | 2.0 | 1.0 | 1080 | $1,000 | $0.93 | 15d | 1 | 0.28mi |
| 1812 NE 24th St Oklahoma City, OK | 3.0 | 1.0 | 1071 | $1,175 | $1.10 | 3d | 1 | 0.29mi |
| 1712 NE 25th St Oklahoma City, OK | 4.0 | 1.0 | 1100 | $1,550 | $1.41 | 44d | 1 | 0.33mi |
| 1904 NE 25th St Oklahoma City, OK | 2.0 | 1.0 | 939 | $950 | $1.01 | 4d | 1 | 0.41mi |
| 1450 NE 16th Ter Oklahoma City, OK | 3.0 | 1.0 | 1096 | $1,295 | $1.18 | 44d | 1 | 0.43mi |
| 2312 N Everest Ave Oklahoma City, OK | 3.0 | 1.0 | 1100 | $1,299 | $1.18 | 44d | 1 | 0.43mi |
| 1921 NE 25th St Unit 3 Oklahoma City, OK | 2.0 | 1.0 | 900 | $875 | $0.97 | 20d | 1 | 0.45mi |
| 1931 NE 25th St Unit 10 Oklahoma City, OK | 2.0 | 1.0 | 900 | $875 | $0.97 | 24d | 1 | 0.47mi |
| 1438 NE 27th St Oklahoma City, OK | 3.0 | 1.0 | 736 | $1,000 | $1.36 | 44d | 1 | 0.48mi |
| 2107 Hardin Dr Oklahoma City, OK | 3.0 | 1.0 | 999 | $875 | $0.88 | 44d | 1 | 0.49mi |
| 2709 N Fonshill Ave Oklahoma City, OK | 2.0 | 1.0 | 949 | $1,100 | $1.16 | 24d | 1 | 0.50mi |
| 2300 Granada Blvd Oklahoma City, OK | 3.0 | 1.0 | 999 | $1,000 | $1.00 | 12d | 1 | 0.51mi |
| 1220 NE 17th St Oklahoma City, OK | 2.0 | 1.0 | 1100 | $1,195 | $1.09 | 44d | 1 | 0.51mi |
| 2225 Glen Ellyn St Oklahoma City, OK | 2.0 | 1.0 | 1095 | $925 | $0.84 | 44d | 1 | 0.51mi |
| 2128 N Stonewall Ave Unit 1 Oklahoma City, OK | 2.0 | 1.0 | 960 | $800 | $0.83 | 3d | 1 | 0.54mi |
| 2148 N Stonewall Ave Oklahoma City, OK | 2.0 | 1.0 | 1055 | $875 | $0.83 | 4d | 1 | 0.54mi |
| 2112 NE 23rd St Oklahoma City, OK | 3.0 | 1.0 | 1117 | $1,070 | $0.96 | 17d | 1 | 0.54mi |
| 2132 NE 19th St Oklahoma City, OK | 2.0 | 1.0 | 850 | $950 | $1.12 | 44d | 1 | 0.55mi |
| 1200 NE 17th St Unit B Oklahoma City, OK | 2.0 | 1.0 | 1002 | $2,100 | $2.10 | 44d | 1 | 0.55mi |
| 2908 N Fonshill Ave Oklahoma City, OK | 3.0 | 2.0 | 1325 | $1,225 | $0.92 | 44d | 1 | 0.56mi |
| 2143 NE 19th St Oklahoma City, OK | 2.0 | 1.0 | 1265 | $945 | $0.75 | 44d | 1 | 0.57mi |
| 2200 Hardin Dr Oklahoma City, OK | 3.0 | 1.0 | 1091 | $1,025 | $0.94 | 44d | 1 | 0.58mi |
| 1444 NE 13th St Unit 1446 Oklahoma City, OK | 2.0 | 2.0 | 1167 | $1,199 | $1.03 | 17d | 1 | 0.59mi |
| 2308 NE 21st St Oklahoma City, OK | 3.0 | 1.0 | 1400 | $1,250 | $0.89 | 3d | 1 | 0.72mi |
| 1637 Bishop Bobby L Williams Dr Oklahoma City, OK | 2.0 | 1.0 | 820 | $1,150 | $1.40 | 44d | 1 | 0.73mi |
| 1633 NE 11th St Oklahoma City, OK | 3.0 | 2.0 | 1284 | $1,945 | $1.51 | 2d | 1 | 0.74mi |
| 939 East Dr Oklahoma City, OK | 2.0 | 1.0 | 1039 | $1,100 | $1.06 | 24d | 1 | 0.75mi |
| 2313 NE 23rd St Oklahoma City, OK | 3.0 | 2.5 | 1500 | $1,095 | $0.73 | 44d | 1 | 0.75mi |
| 2020 NE 30th St Oklahoma City, OK | 3.0 | 1.0 | 1056 | $1,150 | $1.09 | 44d | 1 | 0.76mi |
| 2105 NE 12th St Oklahoma City, OK | 3.0 | 2.0 | 1180 | $1,650 | $1.40 | 22d | 1 | 0.80mi |
| 2132 Miramar Blvd Oklahoma City, OK | 2.0 | 1.0 | 768 | $800 | $1.04 | 3d | 1 | 0.80mi |
| 1801 E Park Pl Oklahoma City, OK | 2.0 | 1.0 | 734 | $695 | $0.95 | 44d | 1 | 0.80mi |
| 2265 NE 16th Ter Oklahoma City, OK | 4.0 | 2.0 | 1356 | $1,400 | $1.03 | 44d | 1 | 0.81mi |
| 1148 N Lottie Ave Oklahoma City, OK | 2.0 | 1.0 | 1040 | $1,150 | $1.11 | 3d | 1 | 0.84mi |
Listing history 10 events
-
2026-04-22price $104,999 612-char remark
Show marketing remark (612 chars)
Move-in ready 2 BR / 2 BA single-family home on a well-maintained lot in North East Oklahoma City. Open-concept living and dining with abundant natural light, remodeled kitchen featuring nice countertops, and tile backsplash. Spacious primary suite with private bath and ample closet space. Updated flooring throughout, energy-efficient windows, and central HVAC. Fully fenced backyard with lots of potential— ideal for entertaining and pets. The backyard includes private driveway parking. Convenient location near shopping, parks, schools and quick access to major routes. This Home is For Sale By Owner.
-
2026-04-14price $109,999 612-char remark
Show marketing remark (612 chars)
Move-in ready 2 BR / 2 BA single-family home on a well-maintained lot in North East Oklahoma City. Open-concept living and dining with abundant natural light, remodeled kitchen featuring nice countertops, and tile backsplash. Spacious primary suite with private bath and ample closet space. Updated flooring throughout, energy-efficient windows, and central HVAC. Fully fenced backyard with lots of potential— ideal for entertaining and pets. The backyard includes private driveway parking. Convenient location near shopping, parks, schools and quick access to major routes. This Home is For Sale By Owner.
-
2026-03-25price $114,999 612-char remark
Show marketing remark (612 chars)
Move-in ready 2 BR / 2 BA single-family home on a well-maintained lot in North East Oklahoma City. Open-concept living and dining with abundant natural light, remodeled kitchen featuring nice countertops, and tile backsplash. Spacious primary suite with private bath and ample closet space. Updated flooring throughout, energy-efficient windows, and central HVAC. Fully fenced backyard with lots of potential— ideal for entertaining and pets. The backyard includes private driveway parking. Convenient location near shopping, parks, schools and quick access to major routes. This Home is For Sale By Owner.
-
2026-02-17$129,900 Active 612-char remark
Show marketing remark (612 chars)
Move-in ready 2 BR / 2 BA single-family home on a well-maintained lot in North East Oklahoma City. Open-concept living and dining with abundant natural light, remodeled kitchen featuring nice countertops, and tile backsplash. Spacious primary suite with private bath and ample closet space. Updated flooring throughout, energy-efficient windows, and central HVAC. Fully fenced backyard with lots of potential— ideal for entertaining and pets. The backyard includes private driveway parking. Convenient location near shopping, parks, schools and quick access to major routes. This Home is For Sale By Owner.
-
2025-12-15historical
-
2025-12-09price $140,000
-
2025-11-24price $145,999
-
2025-10-29status Active
-
2025-10-19status Pending
-
2025-08-25$149,000 Active
ⓘ Source: listings_history table (triggers on properties + properties_extension) + one-shot
backfill from property_details.listing_events for pre-trigger history.
Tax reassessment forecast OK · Resets to sale price
- Current annual tax
- $649 · $54/mo
- Projected year-2 tax
- $945 · $79/mo
- Expected delta
- +$296/yr (+$25/mo · 45.6%)
ⓘ Screening estimate from a state-policy table — verify with the county assessor before closing.
Climate risk First Street
- Flood 1/10 Low FEMA zone X (unshaded) · 0% chance over 30 yrs
- Wildfire 1/10 Low
- Heat 5/10 Major 6 d/yr ≥107°F today · 16 d/yr by 30 yrs out
- Wind 2/10 Low 3% chance of damaging wind over 30 yrs
- Air quality 2/10 Low 1 unhealthy d/yr today · 2 by 30 yrs out
Nearby sold comps map
Loading sold comps map…
Walkable amenities ~0.75 mi
Loading nearby amenities…
Taxation est. · year 1
- Rental income
- $13,912
- − Mortgage interest
- −$5,882
- − Property taxes
- −$649
- − Insurance
- −$525
- − Repairs & maintenance
- −$1,113
- − Management
- −$1,113
- − Depreciation
- −$3,055
- Taxable income
- $1,576
- Est. tax owed @ 24.0%
- −$378
- After-tax cash flow
- $2,831/yr
For passive investors: Depreciation is non-cash, so a rental often shows a tax loss while cash-flowing — sheltering income. Rental losses are passive: they offset passive income freely, and up to $25,000/yr can offset ordinary (W-2) income if you actively participate and your MAGI is under $100k (phasing out to $0 by $150k); unused losses carry forward. On sale, claimed depreciation is recaptured at up to 25%, and gains may owe capital-gains tax (a 1031 exchange can defer both). Figures are a year-1 estimate at your 24.0% rate — not tax advice; consult a CPA.
Schools (NCES district)
- District
- Oklahoma City
- NCES district ID
- 4022770
- Math proficiency
- 7% ▼ -5.00%
- Reading proficiency
- 10% ▼ -6.00%
- Median HH income
- $35,606
- Composite
- 7.0/100
- National rank
- #9970
- State rank
- #254 of 270 in OK
Livability — Oklahoma City
- Score
- 80/100
- State rank
- #3
- US rank
- #1635
Category grades
Schools grade is shown separately in the Schools card above.
Census & demographics
- Census place
- Oklahoma City, OK
- County
- Oklahoma County · 771,644 people
- City population
- 498,656
- Metro
- Oklahoma City, OK
- Population (ZIP)
- 10,727
- Household income
- $40,340
- Rent vs Own
- Severe rent burden
- 804.0
Population outlook (Oklahoma County) Hauer SSP2
- Today (2025)
- 911,875 people
- By 2030
- 982,413 · +7.7%
- By 2040
- 1,130,468 · +24.0%
- By 2050
- 1,288,422 · +41.3%
- By 2075
- 1,711,482 · +87.7%
- By 2100
- 2,088,448 · +129.0%
Race, ethnicity, and origin ACS 2023
- Neighborhood character
- Predominantly Black (76%)
- Race & ethnicity
- Black 76% White 13% Two or more races 7% Hispanic / Latino 6% Native American 2%
- Hispanic origin (detail)
- Mexican 4%
- Foreign-born
- 2% · Canada
- Languages at home
- 94% English-only · Spanish 6%
Political lean MEDSL · Oklahoma
- 2024 margin
- Toss-up / Even · D 48.0% · R 49.7% · Other 2.3%
- 2008→2024 swing
- +15.1pp toward D · 2008: -16.8pp · 2024: -1.7pp
- All cycles
- 2024: R+1.7 2020: R+1.1 2016: R+10.5 2012: R+16.7 2008: R+16.8
Not yet ingested
- Civics
- —
Market trends
- HPI YoY
- ▼ -34.64%
- Current HPI
- 220.6395
- Rent YoY
- ▲ 2.13%
- Metro
- Oklahoma City, OK
- State GDP YoY
- ▲ 1.55%
- F500 in state
- 6
Industry mix (Fortune 500 HQ in OK)
| Industry | F500 HQs | Revenue |
|---|---|---|
| Energy | 3 | $48B |
|
||
Price history
-29.5% since first listed10 events — show timeline
- 2026-04-22 Price Changed $104,999 MLSOK
- 2026-04-14 Price Changed $109,999 MLSOK
- 2026-03-25 Price Changed $114,999 MLSOK
- 2026-02-17 Listed $129,900 MLSOK
- 2025-12-15 Listing Removed — MLSOK
- 2025-12-09 Price Changed $140,000 MLSOK
- 2025-11-24 Price Changed $145,999 MLSOK
- 2025-10-29 Relisted — MLSOK
- 2025-10-19 Pending — MLSOK
- 2025-08-25 Listed $149,000 MLSOK
Property tax history
+22.8%/yrLatest (2025): $649 · +364.8% YoY. Source: county tax records.
Cash-flow waterfall
monthlySold comps — $/sqft
last 12 mo · ≤1 miLoading sold comps…