8832 Rust St #1 · Willow Springs, IL
Flood risk 1/10 · Minimal
- FEMA flood zone
- X (unshaded)
- Chance of flooding over 30 yrs
- 0.0%
- Est. flood insurance / yr
- $507 – $1,088
Fire risk 2/10 · Minimal
- Est. fire insurance / yr
- $804 – $1,492
Heat risk 2/10 · Minimal
- Hot days now (above 102°F)
- 7 days/yr
- Hot days in 30 yrs
- 15 days/yr
Wind risk 2/10 · Minimal
- Chance of severe wind over 30 yrs
- 0.0%
Air-quality risk 3/10 · Minor
- Unhealthy air days now
- 3 days/yr
- Unhealthy air days in 30 yrs
- 3 days/yr
Risk factors via First Street. Map © Google.
Why this score? — see what drove the F grade
The composite is a weighted blend of 9 inputs, each scored 0–100. Each bar is that input's sub-score; the figure is the points it added to the 100-point composite (weight × sub-score).
- Cash flow +12.2/30.0
- DSCR +3.6/10.0
- 1% rule +3.5/10.0
- Livability +3.5/5.0
- Schools +3.4/10.0
- ARV discount +3.0/15.0
- Rent growth +2.5/5.0
- Condition / age +2.5/5.0
- Appreciation +0.0/10.0
$460,000
🖨 Deal sheet 📄 Offer letter ✓ Due diligence
Listing remarks
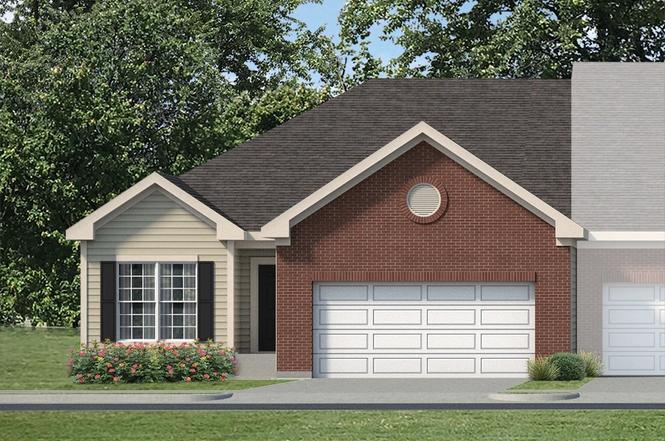
New Construction Douglas Ranch Model End Unit Town home with 2 br, study, 2 Bath, Unfinished Basement, 2 car attached garage. Approx. 1590 Sq. ft. This beautiful Ranch model has a Large eat in kitchen with Formal Dining Room, Great room, Master Bedroom with full bath, Second large bedroom, study or third bedroom and full bath in hall way, laundry room off of 2 car garage. Only 3 units available.
Key facts
- Douglas ranch model
- Large eat in kitchen
- Formal dining room
Tags
Property features AI
Finance
- Other: Property in Willow Springs (Township: Lyons); Directions: Willow Springs Road to Archer, East on Archer to Rust St.
- HOA & community: Monthly association fee; Pets allowed (cats and dogs), max pet weight listed at 99 lbs; No master association fee required
Exterior
- Parking: Attached garage with 2 garage spaces; Asphalt driveway; Garage door opener
- Utilities: Lake Michigan water source; Public sewer
- Home design: Attached single property; Townhouse - ranch model (Douglas); Condo ownership; Entry on level 1; New construction / proposed construction
- Construction: Vinyl siding and brick exterior; Asphalt roof; Concrete perimeter foundation; Built as new/proposed construction
- Exterior features: Common lot; School bus, commuter bus and commuter train access, close to interstate
Interior
- Kitchen: Range; Microwave; Dishwasher; Disposal; Range hood; Eating area / table space in kitchen
- Bedrooms: Master bedroom (main level); Second bedroom (main level)
- Flooring: Carpet in bedrooms and master; Vinyl flooring in foyer, dining room, family room, kitchen and laundry
- Bathrooms: 2 full bathrooms
- Heating & cooling: Forced air heating; Central air conditioning
- Interior features: 6 total rooms; Separate dining room; Unfinished full basement; Some photos are virtually staged
- Laundry & utility: Main-level laundry room
Neighborhood map
What this means for you Summary
Snapshot
- This is a 2-bed/2.0-bath townhouse listed at $460k.
Deal economics
- At list price, monthly cash flow is $-91 ($-1k/yr) — negative.
- To cash-flow at today's rent, offer at most $447k (2.9% below list).
- To meet the 1% rule (rent ≥ 1% of price), the offer needs to be $391k (15.0% below list).
- Recommended offer: $391k (15.0% below list) — sets the bar for 1% rule.
Location & tenants
- Location reads 70/100 on livability (#371 in IL) — a middle-class / working-renter tenant base. Strengths: crime A+, employment A+, housing A+; Watch: schools D+, cost of living D+, amenities F.
- Cons Hsd 230 (suburban): math 35% / reading 39% proficiency, ranked #146 of 620 in IL (top 24%) — families likely to look elsewhere, expect single-tenant / working-renter base with shorter leases.
- Market conditions: 18 active listings in the ZIP; 2 comparable units currently listed for rent nearby; 6,272 units permitted in Cook County in 2024 (4,658 in 5+ unit buildings).
Forward outlook
- Local home prices are declining (-3.0%/yr); year-one equity from $3k of loan paydown is wiped out by about $14k of value loss. Plan a longer hold.
Negotiation context
- It's been on market 122 days — a 12% lower offer ($405k) is reasonable based on typical stale-listing flexibility.
- 3 sale attempts with the ask held roughly flat each time — persistent listings suggest the price (not the market) is what's stuck; bring a comps-based counter.
Questions for the listing agent
- What do current leases actually rent for vs. the listed asking? Can we see a recent rent roll and the last 12 months of T-12 income?
- It's been on market 122 days. Have you received any prior offers? Is the seller open to a 15% concession, seller financing, or rate buy-down credit?
- Why hasn't it sold? Are there any deal-killer items the seller is aware of (foundation, flood, title, zoning, code violations)?
- Is there a deadline driving the sale (1031 exchange, divorce, estate, relocation)? That informs how much negotiation room exists.
- Schools are D-rated, which usually means shorter tenancies and higher turnover. Who's the typical renter profile here, and what's been the actual vacancy rate?
- The area grade is low — what's the realistic commute time and amenity access for the typical tenant pool here? Any planned neighborhood developments (good or bad) we should know about?
- What's the average days-on-market for RENTAL listings here right now (not sales)? A rising rental-DOM trend means longer vacancies and softer asking-rent achievability than the comps imply.
- What's the recent tenant-quality profile in this submarket — average credit score on applications, eviction rate, late-payment / NSF rate, and stable-employment percentage? A property-management company in the area should have these aggregated.
- How much new for-sale + rental construction is in the pipeline within 1–3 miles? Heavy new supply typically softens prices + rents 12–24 months out; constrained supply supports both.
Investment metrics
- 1% rule
- 0.85% ✗
- Cap rate
- 6.06%
- Cash-on-cash
- -0.85%
- DSCR
- 0.96
- GRM
- 9.8
CMA / ARV
- ARV (on-the-fly)
- $418,170
- Comps found
- 1
Show comp detail 1 sale within ~0.75 mi
| Address | Dist | Beds/Ba | Sqft | Sold | Price | $/sf | Match |
|---|---|---|---|---|---|---|---|
| 22 N Nolton Ave | 0.00mi | 3/2.0 (+1) | 1,600 (+1%) | 21mo | $420,000 | $263 | 76 |
Match score weights: distance 35% · size 25% · config 20% · recency 20%. Top-matched comps best support the ARV.
Projected returns pro-forma
-3.0% appreciation · 3.0% rent growth · sell at horizon
- IRR
- -17.7%
- Equity multiple
- 0.38×
- Total profit
- $-80,274
- Equity at exit
- $68,587
- IRR
- -9.8%
- Equity multiple
- 0.40×
- Total profit
- $-77,121
- Equity at exit
- $39,772
Cash invested: $128,800 (down + closing). Projections, not guarantees.
Landlord ↔ Tenant lean methodology
- Overall (STATE)
- 43 Moderately Tenant-Leaning
- State Illinois
- 43 Moderately Tenant-Leaning · D+7
- County
- — inherits STATE
- City
- — inherits STATE
ZIP-level market 60480
- Home prices YoY
- -29.3%
- Active inventory
- 18
- Price-to-rent
- 9.8×
Monthly cashflow live
- Estimated rent
- $3,909 medium interval (Pro) →
- Mortgage (P&I)
- −$2,412
- Tax est. 1.5%
- −$575 /mo · $6,900/yr
- Insurance
- −$192
- HOA
- −$0
- Vacancy / Maint / Mgmt
- −$821
- Net cashflow
- $-91
Break-even live
UW: 25.0% down · 7.5% · 30yr · 1.5% tax · 5.0% vac · 8.0% maint · 8.0% mgmt
Financing live
Cash to close
- Down payment
- $115,000
- Closing costs
- $13,800
- Reserves months
- —
- Total cash needed
- —
Loan-product check · same deal, 3 products live
Conventional
25% down · 7.5% · 30yr
- Down + closing
- —
- Monthly P&I
- —
- Monthly cashflow
- —
- DSCR
- —
- Eligible?
- —
Personal DTI + credit; lowest rate.
DSCR
20% down · 8.5% · 30yr
- Down + closing
- —
- Monthly P&I
- —
- Monthly cashflow
- —
- DSCR
- —
- Eligible?
- —
No personal income docs; deal must DSCR.
Hard money
10% down · 12.0% · 12mo
- Down + closing
- —
- Monthly P&I
- —
- Monthly cashflow
- —
- DSCR
- —
- Eligible?
- —
Short-term bridge; refi at stabilization.
Rent comps 2 comps
| Address | Beds | Baths | Sqft | Rent | $/sqft | DOM | Units | Dist |
|---|---|---|---|---|---|---|---|---|
| 8900 Archer Ave Willow Springs, IL | 1.0–2.0 | 1.0–2.0 | 1174 | $4,375 | $3.73 | 1d | 6 | 1.23mi |
| 8900 Willow Glen Dr Willow Springs, IL | 1.0–2.0 | 1.0–2.5 | 1357 | $3,495 | $2.57 | 1d | 18 | 1.26mi |
Listing history 18 events
-
2026-06-18days on market $460,000 Active 122 DOM
-
2026-06-17days on market $460,000 Active 121 DOM
-
2026-06-16days on market $460,000 Active 120 DOM
-
2026-06-15days on market $460,000 Active 119 DOM
-
2026-06-13days on market $460,000 Active 117 DOM
-
2026-06-09days on market $460,000 Active 113 DOM
-
2026-06-08days on market $460,000 Active 112 DOM
-
2026-06-07days on market $460,000 Active 111 DOM
-
2026-06-04days on market $460,000 Active 108 DOM
-
2026-06-03days on market $460,000 Active 107 DOM
-
2026-06-02days on market $460,000 Active 106 DOM
-
2026-06-01days on market $460,000 Active 105 DOM
-
2026-05-31days on market $460,000 Active 104 DOM
-
2026-02-16$460,000 Active
-
2026-02-13historical
-
2025-02-13historical
-
2025-02-13Active
-
2025-02-07Active
ⓘ Source: listings_history table (triggers on properties + properties_extension) + one-shot
backfill from property_details.listing_events for pre-trigger history.
Climate risk First Street
- Flood 1/10 Low FEMA zone X (unshaded) · 0% chance over 30 yrs
- Wildfire 2/10 Low
- Heat 2/10 Low 7 d/yr ≥102°F today · 15 d/yr by 30 yrs out
- Wind 2/10 Low 0% chance of damaging wind over 30 yrs
- Air quality 3/10 Moderate 3 unhealthy d/yr today · 3 by 30 yrs out
Nearby sold comps map
Loading sold comps map…
Walkable amenities ~0.75 mi
Loading nearby amenities…
Taxation est. · year 1
- Rental income
- $46,906
- − Mortgage interest
- −$25,767
- − Property taxes
- −$6,900
- − Insurance
- −$2,300
- − Repairs & maintenance
- −$3,753
- − Management
- −$3,753
- − Depreciation
- −$13,382
- Taxable loss
- −$8,948
- Est. tax savings @ 24.0%
- +$2,147
- After-tax cash flow
- $1,056/yr
For passive investors: Depreciation is non-cash, so a rental often shows a tax loss while cash-flowing — sheltering income. Rental losses are passive: they offset passive income freely, and up to $25,000/yr can offset ordinary (W-2) income if you actively participate and your MAGI is under $100k (phasing out to $0 by $150k); unused losses carry forward. On sale, claimed depreciation is recaptured at up to 25%, and gains may owe capital-gains tax (a 1031 exchange can defer both). Figures are a year-1 estimate at your 24.0% rate — not tax advice; consult a CPA.
Schools (NCES district)
- District
- Cons Hsd 230
- NCES district ID
- 1708400
- Math proficiency
- 35% ▼ -8.00%
- Reading proficiency
- 39% ▼ -6.00%
- Median HH income
- $73,953
- Composite
- 34.29/100
- National rank
- #5244
- State rank
- #146 of 620 in IL
Livability — Willow Springs
- Score
- 70/100
- State rank
- #371
- US rank
- #7733
Category grades
Schools grade is shown separately in the Schools card above.
Census & demographics
- Population (ZIP)
- 5,319
Population outlook (Cook County) Hauer SSP2
- Today (2025)
- 5,347,519 people
- By 2030
- 5,357,703 · +0.2%
- By 2040
- 5,324,924 · -0.4%
- By 2050
- 5,230,762 · -2.2%
- By 2075
- 4,785,735 · -10.5%
- By 2100
- 4,188,836 · -21.7%
Race, ethnicity, and origin ACS 2023
- Neighborhood character
- Predominantly White (83%)
- Race & ethnicity
- White 83% Hispanic / Latino 15% Two or more races 6%
- Hispanic origin (detail)
- Mexican 12%
- Common ancestry
- Romanian 22% Slovak 2% Iranian 2%
- Foreign-born
- 16% · Canada
- Languages at home
- 76% English-only · Spanish 9% Other Indo-European 8% Russian/Polish/Slavic 7%
Political lean MEDSL · Cook
- 2024 margin
- Solid D (+42.0) · D 70.4% · R 28.4% · Other 1.2%
- 2008→2024 swing
- -11.4pp toward R · 2008: 53.4pp · 2024: 42.0pp
- All cycles
- 2024: D+42.0 2020: D+50.3 2016: D+53.0 2012: D+49.4 2008: D+53.4
Not yet ingested
- Civics
- —
Market trends
- HPI YoY
- ▼ -82.60%
- Current HPI
- 199.44
- Rent YoY
- —
- Metro
- —
- State GDP YoY
- ▲ 1.59%
- F500 in state
- 60
Industry mix (Fortune 500 HQ in IL)
| Industry | F500 HQs | Revenue |
|---|---|---|
| Insurance | 4 | $201B |
|
||
| Consumer Goods | 4 | $87B |
|
||
| Industrial Machinery | 3 | $64B |
|
||
| Healthcare | 2 | $55B |
|
||
| Retail / Pharmacy | 1 | $148B |
|
||
| Agriculture / Food | 1 | $86B |
|
||
Price history
5 events — show timeline
- 2026-02-16 Listed $460,000 MRED as Distributed by MLS Grid
- 2026-02-13 Listing Removed — MRED as Distributed by MLS Grid
- 2025-02-13 Listing Removed — MRED as Distributed by MLS Grid
- 2025-02-13 Listed — MRED as Distributed by MLS Grid
- 2025-02-07 Listed — MRED as Distributed by MLS Grid
Cash-flow waterfall
monthlySold comps — $/sqft
last 12 mo · ≤1 miLoading sold comps…