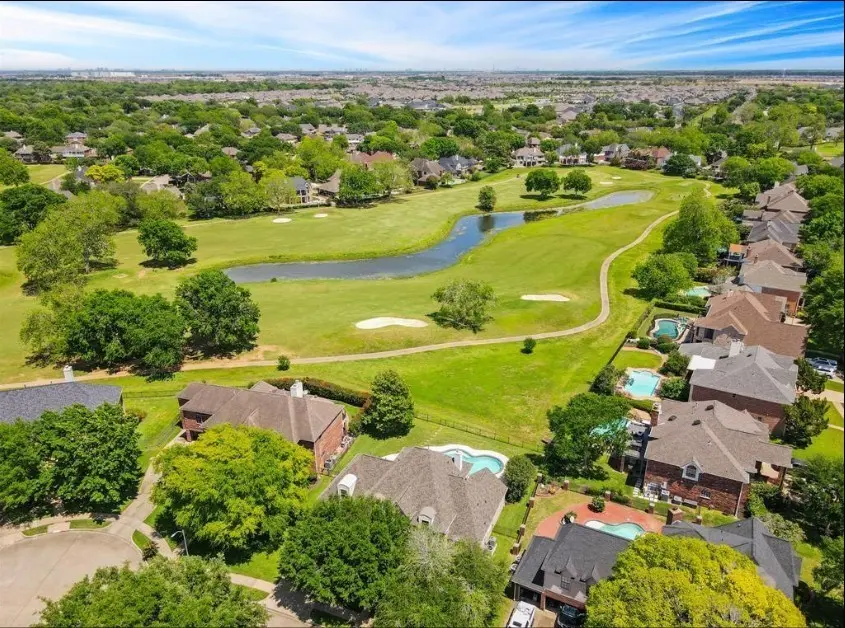
1711 Surrey Ct · Pecan Grove, TX
Flood risk 6/10 · Moderate
- FEMA flood zone
- X
- Chance of flooding over 30 yrs
- 0.7%
- Est. flood insurance / yr
- $507 – $1,088
Fire risk 1/10 · Minimal
- Est. fire insurance / yr
- $1,222 – $2,270
Heat risk 9/10 · Severe
- Hot days now (above 110°F)
- 7 days/yr
- Hot days in 30 yrs
- 23 days/yr
Wind risk 9/10 · Severe
- Chance of severe wind over 30 yrs
- 99.0%
Air-quality risk 2/10 · Minimal
- Unhealthy air days now
- 1 days/yr
- Unhealthy air days in 30 yrs
- 2 days/yr
Risk factors via First Street. Map © Google.
Why this score? — see what drove the F grade
The composite is a weighted blend of 9 inputs, each scored 0–100. Each bar is that input's sub-score; the figure is the points it added to the 100-point composite (weight × sub-score).
- ARV discount +10.2/15.0
- Schools +4.5/10.0
- Cash flow +4.1/30.0
- Livability +3.6/5.0
- Condition / age +2.5/5.0
- Rent growth +2.1/5.0
- 1% rule +1.0/10.0
- DSCR +0.0/10.0
- Appreciation +0.0/10.0
$379,999
🖨 Deal sheet 📄 Offer letter ✓ Due diligence
Listing remarks MLS
Fresh opportunity in Pecan Grove! Welcome to 1711 Surrey Ct, a beautifully updated home on one of the largest corner cul-de-sac lots in the community (15,531 sq. ft.), located in the desirable Pecan Grove golf course neighborhood—home to the Pecan Grove Golf Club. The property offers a total of 2,746 sq. ft., which includes the main home plus a 440 sq. ft. garage apartment with full bath, A/C, and mini kitchen—ideal for guests, multigenerational living, a home office, or income potential. Recent updates include a new roof, waterproof laminate flooring, quartz countertops, refreshed bathrooms, double oven, sleek vent hood, and fresh interior and exterior paint. Enjoy a bright game room, porte-cochere with privacy gate, tree-filled backyard, and new storage shed. Surrounded by parks, mature trees, and golf-course amenities, this move-in-ready home offers space, flexibility, and lifestyle at an excellent value. Schedule your showing today!
Key facts
- Quartz countertops
- Garage apartment
- Refreshed bathrooms
Tags
Neighborhood map
What this means for you Summary
Snapshot
- This is a 3-bed/3.0-bath single-family listed at $380k.
Deal economics
- At list price, monthly cash flow is $-1k ($-13k/yr) — negative.
- To cash-flow at today's rent, offer at most $194k (48.9% below list).
- To meet the 1% rule (rent ≥ 1% of price), the offer needs to be $227k (40.2% below list).
- Recommended offer: $194k (48.9% below list) — sets the bar for cash-flow.
- Cap rate 3.0% vs local median 2.1% in Pecan Grove — top-decile yield for the area; either an underpriced asset or a hidden risk that comps aren't pricing in. Stress-test before assuming the spread holds.
Location & tenants
- Location reads 72/100 on livability (#256 in TX) — a middle-class / working-renter tenant base. Strengths: employment A+, housing A+, crime A; Watch: amenities F, commute F, health & safety F.
- Fort Bend ISD (suburban): math 44% / reading 53% proficiency, ranked #140 of 826 in TX (top 17%) — families likely to look elsewhere, expect single-tenant / working-renter base with shorter leases.
- Market conditions: Rents soft (-1.6%/yr); 1222 active listings in the ZIP; 1 comparable units currently listed for rent nearby; high-income renter base; 12,093 units permitted in Fort Bend County in 2024 (815 in 5+ unit buildings).
Forward outlook
- Local home prices are declining (-3.0%/yr); year-one equity from $3k of loan paydown is wiped out by about $11k of value loss. Plan a longer hold.
- Fort Bend County population projected at +75% by 2050 — long-run rental-demand tailwind backs the buy-and-hold thesis.
Negotiation context
- It's been on market 132 days — a 12% lower offer ($334k) is reasonable based on typical stale-listing flexibility.
- 7 sale attempts since 2y ago with the ask held roughly flat each time — persistent listings suggest the price (not the market) is what's stuck; bring a comps-based counter.
Risks & watch-outs
- Climate carrying-cost: major flood risk; severe wind risk, 99% chance of damaging wind over 30y; extreme-heat days projected 7→23/yr by 2055 (HVAC capex compounding) — expect insurance premiums to compound above CPI over the hold.
Questions for the listing agent
- What do current leases actually rent for vs. the listed asking? Can we see a recent rent roll and the last 12 months of T-12 income?
- It's been on market 132 days. Have you received any prior offers? Is the seller open to a 49% concession, seller financing, or rate buy-down credit?
- What does the HOA fee cover, when was the last increase, and are there any pending special assessments or reserve-fund shortfalls?
- Why hasn't it sold? Are there any deal-killer items the seller is aware of (foundation, flood, title, zoning, code violations)?
- Is there a deadline driving the sale (1031 exchange, divorce, estate, relocation)? That informs how much negotiation room exists.
- The area grade is low — what's the realistic commute time and amenity access for the typical tenant pool here? Any planned neighborhood developments (good or bad) we should know about?
- What's the average days-on-market for RENTAL listings here right now (not sales)? A rising rental-DOM trend means longer vacancies and softer asking-rent achievability than the comps imply.
- What's the recent tenant-quality profile in this submarket — average credit score on applications, eviction rate, late-payment / NSF rate, and stable-employment percentage? A property-management company in the area should have these aggregated.
- How much new for-sale + rental construction is in the pipeline within 1–3 miles? Heavy new supply typically softens prices + rents 12–24 months out; constrained supply supports both.
Investment metrics
- 1% rule
- 0.60% ✗
- Cap rate
- 2.97%
- Cash-on-cash
- -11.86%
- DSCR
- 0.47
- GRM
- 13.9
CMA / ARV
- ARV (median comp)
- $403,896
- List price
- $379,999
- Delta
- -5.92%
- Verdict
- FAIR
- Comps
- 20 within 1.0 mi
Show comp detail 12 sales within ~0.75 mi
| Address | Dist | Beds/Ba | Sqft | Sold | Price | $/sf | Match |
|---|---|---|---|---|---|---|---|
| 1915 Rock Fence Dr | 0.31mi | 3/2.0 | 2,346 (+2%) | 2mo | $410,000 | $175 | 77 |
| 1115 Austin Colony Dr | 0.35mi | 4/2.5 (+1) | 2,320 (+1%) | 1mo | $389,000 | $168 | 75 |
| 2330 Wren Meadow Rd | 0.40mi | 4/2.5 (+1) | 2,320 (+1%) | 3mo | $265,000 | $114 | 71 |
| 1802 Quarterpath Dr | 0.39mi | 3/2.5 | 2,482 (+8%) | 1mo | $380,000 | $153 | 67 |
| 2010 Country Mile Ct | 0.67mi | 3/2.0 | 2,327 (+1%) | 1mo | $310,000 | $133 | 63 |
| 2203 Country Mile Ln | 0.70mi | 3/2.0 | 2,327 (+1%) | 0mo | $399,000 | $171 | 62 |
| 1126 Colonial Heights Dr | 0.57mi | 3/2.0 | 2,225 (-4%) | 3mo | $319,900 | $144 | 61 |
| 1222 Bittersweet Dr | 0.55mi | 4/2.5 (+1) | 2,361 (+2%) | 4mo | $365,000 | $155 | 60 |
| 1211 Atlanta Dr | 0.55mi | 3/2.5 | 2,130 (-8%) | 0mo | $265,000 | $124 | 59 |
| 2307 Country Place Dr | 0.48mi | 4/2.5 (+1) | 2,155 (-6%) | 1mo | $335,000 | $155 | 58 |
| 1207 Deerfield Rd | 0.53mi | 4/2.5 (+1) | 2,554 (+11%) | 1mo | $429,000 | $168 | 50 |
| 606 Old Colony Dr | 0.59mi | 4/2.0 (+1) | 2,004 (-13%) | 2mo | $199,900 | $100 | 40 |
Match score weights: distance 35% · size 25% · config 20% · recency 20%. Top-matched comps best support the ARV.
Projected returns pro-forma
-3.0% appreciation · 0.0% rent growth · sell at horizon
- IRR
- -41.8%
- Equity multiple
- -0.27×
- Total profit
- $-135,061
- Equity at exit
- $56,659
- IRR
- -94.5%
- Equity multiple
- -1.15×
- Total profit
- $-228,910
- Equity at exit
- $32,855
Cash invested: $106,400 (down + closing). Projections, not guarantees.
Landlord ↔ Tenant lean methodology
- Overall (STATE)
- 87 Strongly Landlord-Friendly
- State Texas
- 87 Strongly Landlord-Friendly · R+5
- County
- — inherits STATE
- City
- — inherits STATE
ZIP-level market 77406
- Home prices YoY
- -26.2%
- Rents YoY
- -1.6%
- Active inventory
- 1222
- Price-to-rent
- 13.9×
Monthly cashflow live
- Estimated rent
- $2,271 medium interval (Pro) →
- Mortgage (P&I)
- −$1,993
- Tax from tax record
- −$672 /mo · $8,061/yr
- Insurance
- −$158
- HOA
- −$23
- Vacancy / Maint / Mgmt
- −$477
- Net cashflow
- $-1,052
Break-even live
UW: 25.0% down · 7.5% · 30yr · 1.5% tax · 5.0% vac · 8.0% maint · 8.0% mgmt
Financing live
Cash to close
- Down payment
- $95,000
- Closing costs
- $11,400
- Reserves months
- —
- Total cash needed
- —
Loan-product check · same deal, 3 products live
Conventional
25% down · 7.5% · 30yr
- Down + closing
- —
- Monthly P&I
- —
- Monthly cashflow
- —
- DSCR
- —
- Eligible?
- —
Personal DTI + credit; lowest rate.
DSCR
20% down · 8.5% · 30yr
- Down + closing
- —
- Monthly P&I
- —
- Monthly cashflow
- —
- DSCR
- —
- Eligible?
- —
No personal income docs; deal must DSCR.
Hard money
10% down · 12.0% · 12mo
- Down + closing
- —
- Monthly P&I
- —
- Monthly cashflow
- —
- DSCR
- —
- Eligible?
- —
Short-term bridge; refi at stabilization.
Rent comps 1 comps
| Address | Beds | Baths | Sqft | Rent | $/sqft | DOM | Units | Dist |
|---|---|---|---|---|---|---|---|---|
| 707 Land Grant Dr Richmond, TX | 4.0 | 2.0 | 1994 | $2,595 | $1.30 | 43d | 1 | 0.52mi |
HOA detail
- Monthly dues
- $23 · $276/yr
- Likely covers
- water
Listing history 28 events
-
2026-06-13days on market $379,999 Pending 132 DOM
-
2026-06-09days on market $379,999 Pending 131 DOM
-
2026-06-07statusdays on market $379,999 Pending 129 DOM
-
2026-06-04days on market $379,999 Active 126 DOM
-
2026-06-03days on market $379,999 Active 125 DOM
-
2026-06-02days on market $379,999 Active 124 DOM
-
2026-06-01days on market $379,999 Active 123 DOM
-
2026-05-31days on market $379,999 Active 122 DOM
-
2026-04-07price $379,999 962-char remark
Show marketing remark (962 chars)
Fresh opportunity in Pecan Grove! Welcome to 1711 Surrey Ct, a beautifully updated home on one of the largest corner cul-de-sac lots in the community (15,531 sq. ft.), located in the desirable Pecan Grove golf course neighborhood—home to the Pecan Grove Golf Club. The property offers a total of 2,746 sq. ft., which includes the main home plus a 440 sq. ft. garage apartment with full bath, A/C, and mini kitchen—ideal for guests, multigenerational living, a home office, or income potential. Recent updates include a new roof, waterproof laminate flooring, quartz countertops, refreshed bathrooms, double oven, sleek vent hood, and fresh interior and exterior paint. Enjoy a bright game room, porte-cochere with privacy gate, tree-filled backyard, and new storage shed. Surrounded by parks, mature trees, and golf-course amenities, this move-in-ready home offers space, flexibility, and lifestyle at an excellent value. Schedule your showing today!
-
2026-01-29$393,000 Active 962-char remark
Show marketing remark (962 chars)
Fresh opportunity in Pecan Grove! Welcome to 1711 Surrey Ct, a beautifully updated home on one of the largest corner cul-de-sac lots in the community (15,531 sq. ft.), located in the desirable Pecan Grove golf course neighborhood—home to the Pecan Grove Golf Club. The property offers a total of 2,746 sq. ft., which includes the main home plus a 440 sq. ft. garage apartment with full bath, A/C, and mini kitchen—ideal for guests, multigenerational living, a home office, or income potential. Recent updates include a new roof, waterproof laminate flooring, quartz countertops, refreshed bathrooms, double oven, sleek vent hood, and fresh interior and exterior paint. Enjoy a bright game room, porte-cochere with privacy gate, tree-filled backyard, and new storage shed. Surrounded by parks, mature trees, and golf-course amenities, this move-in-ready home offers space, flexibility, and lifestyle at an excellent value. Schedule your showing today!
-
2026-01-16historical $3,000
-
2026-01-15historical
-
2025-12-24$3,000
-
2025-09-26$399,000 Active
-
2025-06-24status Pending
-
2025-04-25status Pending
-
2025-04-24historical
-
2025-03-16status Active
-
2025-03-11status Pending, Continue to Show
-
2025-03-09price $400,000
-
2025-02-16status Active
-
2025-02-06historical
-
2025-01-09$415,000 Active
-
2025-01-09historical
-
2024-11-27$425,000 Active
-
2024-11-27historical
-
2018-10-29soldstatus
-
1998-12-22soldstatus
ⓘ Source: listings_history table (triggers on properties + properties_extension) + one-shot
backfill from property_details.listing_events for pre-trigger history.
Tax reassessment forecast TX · Resets to sale price
- Current annual tax
- $8,061 · $672/mo
- Projected year-2 tax
- $8,061 · $672/mo
- Expected delta
- $0/yr ($0/mo · 0.0%)
ⓘ Screening estimate from a state-policy table — verify with the county assessor before closing.
Climate risk First Street
- Flood 6/10 Major FEMA zone X · 70% chance over 30 yrs
- Wildfire 1/10 Low
- Heat 9/10 Extreme 7 d/yr ≥110°F today · 23 d/yr by 30 yrs out
- Wind 9/10 Extreme 99% chance of damaging wind over 30 yrs
- Air quality 2/10 Low 1 unhealthy d/yr today · 2 by 30 yrs out
Nearby sold comps map
Loading sold comps map…
Walkable amenities ~0.75 mi
Loading nearby amenities…
Taxation est. · year 1
- Rental income
- $27,248
- − Mortgage interest
- −$21,286
- − Property taxes
- −$8,061
- − Insurance
- −$1,900
- − Repairs & maintenance
- −$2,180
- − Management
- −$2,180
- − HOA
- −$276
- − Depreciation
- −$11,055
- Taxable loss
- −$19,688
- Est. tax savings @ 24.0%
- +$4,725
- After-tax cash flow
- $-7,898/yr
For passive investors: Depreciation is non-cash, so a rental often shows a tax loss while cash-flowing — sheltering income. Rental losses are passive: they offset passive income freely, and up to $25,000/yr can offset ordinary (W-2) income if you actively participate and your MAGI is under $100k (phasing out to $0 by $150k); unused losses carry forward. On sale, claimed depreciation is recaptured at up to 25%, and gains may owe capital-gains tax (a 1031 exchange can defer both). Figures are a year-1 estimate at your 24.0% rate — not tax advice; consult a CPA.
Schools (NCES district)
- District
- Fort Bend ISD
- NCES district ID
- 4819650
- Math proficiency
- 44% ▼ -15.00%
- Reading proficiency
- 53% ▼ -4.00%
- Median HH income
- $82,360
- Composite
- 44.61/100
- National rank
- #2779
- State rank
- #140 of 826 in TX
Livability — Pecan Grove
- Score
- 72/100
- State rank
- #256
- US rank
- #6017
Category grades
Schools grade is shown separately in the Schools card above.
Census & demographics
- Census place
- Pecan Grove, TX
- County
- Fort Bend County · 836,777 people
- Metro
- Houston-The Woodlands-Sugar Land, TX
- Population (ZIP)
- 69,918
- Household income
- $141,869
- Rent vs Own
- Severe rent burden
- 575.0
Population outlook (Fort Bend County) Hauer SSP2
- Today (2025)
- 1,004,526 people
- By 2030
- 1,153,104 · +14.8%
- By 2040
- 1,453,718 · +44.7%
- By 2050
- 1,753,781 · +74.6%
- By 2075
- 2,455,772 · +144.5%
- By 2100
- 2,930,528 · +191.7%
Race, ethnicity, and origin ACS 2023
- Neighborhood character
- Highly diverse neighborhood (Simpson 0.72)
- Race & ethnicity
- White 43% Hispanic / Latino 26% Two or more races 15% Black 14% Asian 12%
- Hispanic origin (detail)
- Mexican 18% Puerto Rican 1%
- Common ancestry
- Lithuanian 2% Romanian 1% Iranian 1%
- Foreign-born
- 17% · Canada, Vietnam, China
- Languages at home
- 73% English-only · Spanish 14% Other Indo-European 3% Vietnamese 2%
Political lean MEDSL · Fort Bend
- 2024 margin
- Toss-up / Even · D 49.5% · R 47.9% · Other 2.6%
- 2008→2024 swing
- +4.0pp toward D · 2008: -2.4pp · 2024: 1.6pp
- All cycles
- 2024: D+1.6 2020: D+10.6 2016: D+6.6 2012: R+6.8 2008: R+2.4
Not yet ingested
- Civics
- —
Market trends
- HPI YoY
- ▼ -79.18%
- Current HPI
- 222.9525
- Rent YoY
- ▼ -1.61%
- Metro
- Houston-The Woodlands-Sugar Land, TX
- State GDP YoY
- ▲ 3.95%
- F500 in state
- 110
Industry mix (Fortune 500 HQ in TX)
| Industry | F500 HQs | Revenue |
|---|---|---|
| Energy | 16 | $1,198B |
|
||
| Technology | 5 | $198B |
|
||
| Engineering / Construction | 4 | $72B |
|
||
| Energy Services | 3 | $60B |
|
||
| Utilities | 3 | $41B |
|
||
| Healthcare | 2 | $330B |
|
||
Price history
-10.6% since first listed20 events — show timeline
- 2026-04-07 Price Changed $379,999 HARMLS
- 2026-01-29 Listed $393,000 HARMLS
- 2026-01-16 Rental Removed $3,000 HARMLS
- 2026-01-15 Listing Removed — HARMLS
- 2025-12-24 Listed for Rent $3,000 HARMLS
- 2025-09-26 Listed $399,000 HARMLS
- 2025-06-24 Pending — HARMLS
- 2025-04-25 Pending — HARMLS
- 2025-04-24 Listing Removed — HARMLS
- 2025-03-16 Relisted — HARMLS
- 2025-03-11 Pending — HARMLS
- 2025-03-09 Price Changed $400,000 HARMLS
- 2025-02-16 Relisted — HARMLS
- 2025-02-06 Listing Removed — HARMLS
- 2025-01-09 Listing Removed — HARMLS
- 2025-01-09 Listed $415,000 HARMLS
- 2024-11-27 Listed $425,000 HARMLS
- 2024-11-27 Coming Soon — HARMLS
- 2018-10-29 Sold (Public Records) — Public Records
- 1998-12-22 Sold (Public Records) — Public Records
Property tax history
+4.5%/yrLatest (2025): $8,061 · +17.0% YoY. Source: county tax records.
Cash-flow waterfall
monthlySold comps — $/sqft
last 12 mo · ≤1 miLoading sold comps…