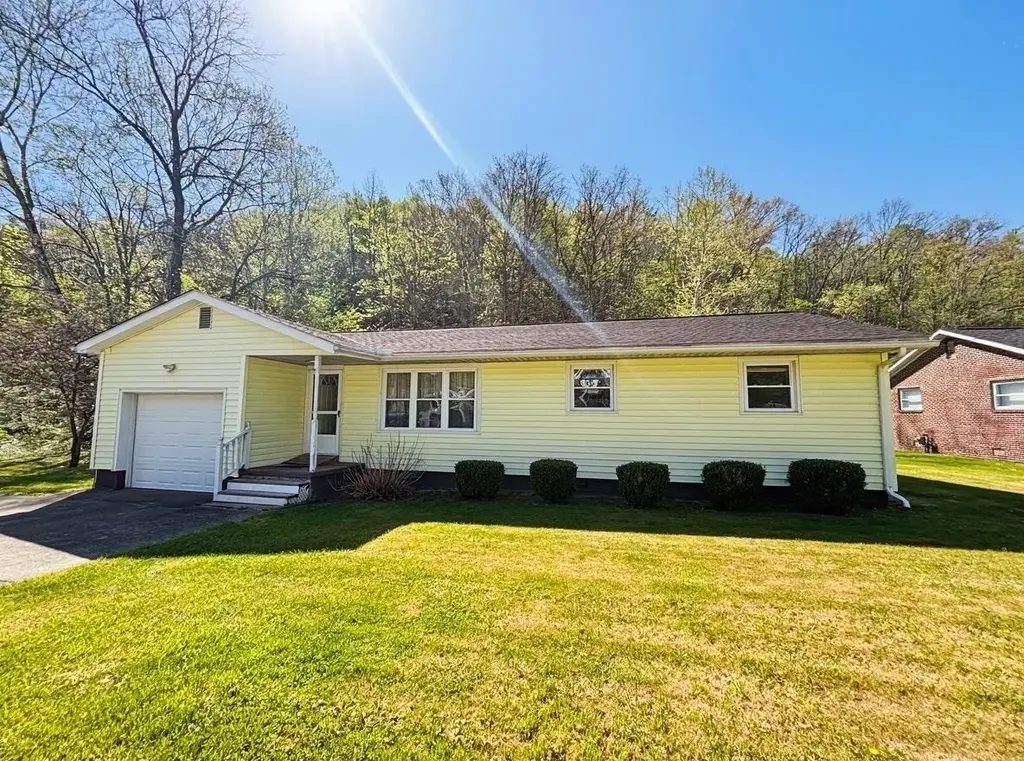
5462 16th Street Rd · Barboursville, WV
Flood risk 8/10 · Major
- FEMA flood zone
- X (unshaded)
- Chance of flooding over 30 yrs
- 0.99%
- Est. flood insurance / yr
- $507 – $1,088
Fire risk 5/10 · Moderate
- Est. fire insurance / yr
- $787 – $1,461
Heat risk 4/10 · Minor
- Hot days now (above 101°F)
- 7 days/yr
- Hot days in 30 yrs
- 19 days/yr
Wind risk 2/10 · Minimal
- Chance of severe wind over 30 yrs
- 1.0%
Air-quality risk 1/10 · Minimal
- Unhealthy air days now
- 0 days/yr
- Unhealthy air days in 30 yrs
- 0 days/yr
Risk factors via First Street. Map © Google.
Why this score? — see what drove the D+ grade
The composite is a weighted blend of 9 inputs, each scored 0–100. Each bar is that input's sub-score; the figure is the points it added to the 100-point composite (weight × sub-score).
- Cash flow +15.9/30.0
- ARV discount +7.5/15.0
- Rent growth +5.0/5.0
- DSCR +4.9/10.0
- Livability +4.1/5.0
- 1% rule +3.0/10.0
- Schools +3.0/10.0
- Condition / age +2.5/5.0
- Appreciation +0.0/10.0
$159,000
🖨 Deal sheet (PDF) 📄 Offer letter ✓ Due diligence
Listing remarks MLS
This move in ready Rancher sits on almost 1/2 acre lot, great location, completely updated. Includes newer roof, newer HVAC, new deck, updated bath and more. Must see before its gone!
Key facts
- Functional kitchen
- Large yard
- Quiet surroundings
Tags
Property features AI
Exterior
- Parking: Attached garage (1 car); Off-street parking
- Utilities: Public water; Septic tank
- Home design: Single-family residence; One story
- Construction: Vinyl siding; Shingle roof
- Exterior features: Deck; Level lot
Interior
- Kitchen: Dishwasher; Microwave; Range; Oven; Refrigerator
- Bathrooms: 1 full bathroom
- Heating & cooling: Central heating (natural gas); Central air conditioning
- Interior features: Dishwasher; Microwave; Range; Oven; Refrigerator; Crawl space basement
Neighborhood map
What this means for you Summary
Snapshot
- This is a 3-bed/1.0-bath single-family listed at $159k.
Deal economics
- At list price, monthly cash flow is $10 ($125/yr) — positive.
- The deal already cash-flows at list — no discount required.
- To meet the 1% rule (rent ≥ 1% of price), the offer needs to be $128k (19.6% below list).
- Recommended offer: $128k (19.6% below list) — sets the bar for 1% rule.
- Cap rate 6.9% vs local median 3.4% in Barboursville — top-decile yield for the area; either an underpriced asset or a hidden risk that comps aren't pricing in. Stress-test before assuming the spread holds.
Location & tenants
- Location reads 82/100 on livability (#8 in WV, #1,207 nationally) — a professional / high-income tenant draw. Strengths: cost of living A+, housing A+, health & safety A+; Watch: commute D+.
- Cabell County Schools (urban): math 31% / reading 42% proficiency, ranked #13 of 55 in WV (top 24%) — families likely to look elsewhere, expect single-tenant / working-renter base with shorter leases.
- Zoned schools: Davis Creek Elementary School (math 47% / reading 52%, grade D, #49 of 377 statewide, top 16%, 214 students, 0% FRL); Barboursville Middle School (math 32% / reading 56%, grade D, #11 of 109 statewide, top 9%, 679 students, 0% FRL); Cabell Midland High School (math 25% / reading 56%, grade F, #19 of 110 statewide, top 17%, 1,757 students, 0% FRL) — zoned schools average 0% FRL vs 47% district-wide (47 pts lower); this property's tenant base skews higher-income than the district average.
- Market conditions: Rents rising fast (+10.6%/yr); 128 active listings in the ZIP; 61 units permitted in Cabell County in 2024 (5 in 5+ unit buildings).
Forward outlook
- Local home prices are declining (-3.0%/yr); year-one equity from $1k of loan paydown is wiped out by about $5k of value loss. Plan a longer hold.
Negotiation context
- It's been on market 22 days — a 2% lower offer ($157k) is reasonable based on typical stale-listing flexibility.
- 2 sale attempts since 7y ago; this cycle's ask has dropped $11k (6%) from the opening price — seller is motivated, your offer sets the floor, not the list.
- Current owner paid $85k; list at $159k implies a 87% gain — meaningful room to come down on a strong offer.
Risks & watch-outs
- Watch-outs: flood insurance adds $66/mo.
- Climate carrying-cost: severe flood risk; moderate wildfire risk — expect insurance premiums to compound above CPI over the hold.
Questions for the listing agent
- Built in 1960 — when were the roof, HVAC, electrical panel, plumbing, and water heater last replaced?
- What's the actual annual flood-insurance premium (NFIP or private), and is the property in a SFHA with mandatory coverage?
- Is there a deadline driving the sale (1031 exchange, divorce, estate, relocation)? That informs how much negotiation room exists.
- The area grade is low — what's the realistic commute time and amenity access for the typical tenant pool here? Any planned neighborhood developments (good or bad) we should know about?
- What's the average days-on-market for RENTAL listings here right now (not sales)? A rising rental-DOM trend means longer vacancies and softer asking-rent achievability than the comps imply.
- What's the recent tenant-quality profile in this submarket — average credit score on applications, eviction rate, late-payment / NSF rate, and stable-employment percentage? A property-management company in the area should have these aggregated.
- How much new for-sale + rental construction is in the pipeline within 1–3 miles? Heavy new supply typically softens prices + rents 12–24 months out; constrained supply supports both.
Investment metrics
- 1% rule
- 0.80% ✗
- Cap rate
- 6.87%
- Cash-on-cash
- 2.07%
- DSCR
- 1.09
- GRM
- 10.4
CMA / ARV
No comps found within radius.
Projected returns pro-forma
-3.0% appreciation · 8.0% rent growth · sell at horizon
- IRR
- -10.9%
- Equity multiple
- 0.59×
- Total profit
- $-18,389
- Equity at exit
- $23,707
- IRR
- 4.0%
- Equity multiple
- 1.35×
- Total profit
- $15,416
- Equity at exit
- $13,747
Cash invested: $44,520 (down + closing). Projections, not guarantees.
Landlord ↔ Tenant lean methodology
- Overall (STATE)
- 83 Strongly Landlord-Friendly
- State West Virginia
- 83 Strongly Landlord-Friendly · R+22
- County
- — inherits STATE
- City
- — inherits STATE
ZIP-level market 25701
- Home prices YoY
- -8.7%
- Rents YoY
- 10.6%
- Active inventory
- 128
- Price-to-rent
- 10.4×
Monthly cashflow live
- Estimated rent
- $1,278 medium interval (Pro) →
- Mortgage (P&I)
- −$834
- Tax from tax record
- −$33 /mo · $395/yr
- Insurance
- −$66
- Flood insurance flood zone
- −$66 /mo · $798/yr
- HOA
- −$0
- Vacancy / Maint / Mgmt
- −$268
- Net cashflow
- $10
Break-even live
Sensitivity live
| Price | -10% $100 | -5% $55 | +0% $10 | +5% $-35 | +10% $-80 |
|---|---|---|---|---|---|
| Rent | -10% $-91 | -5% $-40 | +0% $10 | +5% $61 | +10% $111 |
| Rate | -1.0pp $90 | -0.5pp $51 | base $10 | +0.5pp $-31 | +1.0pp $-73 |
UW: 25.0% down · 7.5% · 30yr · 1.5% tax · 5.0% vac · 8.0% maint · 8.0% mgmt
Financing live
Cash to close
- Down payment
- $39,750
- Closing costs
- $4,770
- Reserves months
- —
- Total cash needed
- —
Loan-product check · same deal, 3 products live
Conventional
25% down · 7.5% · 30yr
- Down + closing
- —
- Monthly P&I
- —
- Monthly cashflow
- —
- DSCR
- —
- Eligible?
- —
Personal DTI + credit; lowest rate.
DSCR
20% down · 8.5% · 30yr
- Down + closing
- —
- Monthly P&I
- —
- Monthly cashflow
- —
- DSCR
- —
- Eligible?
- —
No personal income docs; deal must DSCR.
Hard money
10% down · 12.0% · 12mo
- Down + closing
- —
- Monthly P&I
- —
- Monthly cashflow
- —
- DSCR
- —
- Eligible?
- —
Short-term bridge; refi at stabilization.
Listing history 7 events
-
2026-05-09status Pending
-
2026-04-29price $159,000
-
2026-04-17$169,900 Active
-
2019-06-03soldstatus $85,000 183-char remark
Show marketing remark (183 chars)
This move in ready Rancher sits on almost 1/2 acre lot, great location, completely updated. Includes newer roof, newer HVAC, new deck, updated bath and more. Must see before its gone!
-
2019-06-03soldstatus $85,000
Show marketing remark (183 chars)
This move in ready Rancher sits on almost 1/2 acre lot, great location, completely updated. Includes newer roof, newer HVAC, new deck, updated bath and more. Must see before its gone!
-
2019-05-20$102,000 183-char remark
Show marketing remark (183 chars)
This move in ready Rancher sits on almost 1/2 acre lot, great location, completely updated. Includes newer roof, newer HVAC, new deck, updated bath and more. Must see before its gone!
-
2006-08-21soldstatus $68,000
ⓘ Source: listings_history table (triggers on properties + properties_extension) + one-shot
backfill from property_details.listing_events for pre-trigger history.
Tax reassessment forecast WV · Resets to sale price
- Current annual tax
- $395 · $33/mo
- Projected year-2 tax
- $938 · $78/mo
- Expected delta
- +$543/yr (+$45/mo · 137.3%)
ⓘ Screening estimate from a state-policy table — verify with the county assessor before closing.
Climate risk First Street
- Flood 8/10 Severe FEMA zone X (unshaded) · 99% chance over 30 yrs
- Wildfire 5/10 Major
- Heat 4/10 Moderate 7 d/yr ≥101°F today · 19 d/yr by 30 yrs out
- Wind 2/10 Low 100% chance of damaging wind over 30 yrs
- Air quality 1/10 Low 0 unhealthy d/yr today · 0 by 30 yrs out
Nearby sold comps map
Loading sold comps map…
Walkable amenities ~0.75 mi
Loading nearby amenities…
Taxation est. · year 1
- Rental income
- $15,340
- − Mortgage interest
- −$8,906
- − Property taxes
- −$395
- − Insurance
- −$1,592
- − Repairs & maintenance
- −$1,227
- − Management
- −$1,227
- − Depreciation
- −$4,625
- Taxable loss
- −$2,635
- Est. tax savings @ 24.0%
- +$632
- After-tax cash flow
- $757/yr
For passive investors: Depreciation is non-cash, so a rental often shows a tax loss while cash-flowing — sheltering income. Rental losses are passive: they offset passive income freely, and up to $25,000/yr can offset ordinary (W-2) income if you actively participate and your MAGI is under $100k (phasing out to $0 by $150k); unused losses carry forward. On sale, claimed depreciation is recaptured at up to 25%, and gains may owe capital-gains tax (a 1031 exchange can defer both). Figures are a year-1 estimate at your 24.0% rate — not tax advice; consult a CPA.
Schools (NCES district)
- District
- Cabell County Schools
- NCES district ID
- 5400180
- Math proficiency
- 31% ▼ -7.00%
- Reading proficiency
- 42% ▼ -6.00%
- Median HH income
- $36,426
- Composite
- 30.26/100
- National rank
- #6285
- State rank
- #13 of 55 in WV
Livability — Barboursville
- Score
- 82/100
- State rank
- #8
- US rank
- #1207
Category grades
Schools grade is shown separately in the Schools card above.
Census & demographics
- County
- Cabell County · 30,893 people
- Metro
- Huntington-Ashland, WV-KY-OH
- Population (ZIP)
- 21,197
- Household income
- $56,292
- Rent vs Own
- Severe rent burden
- 1186.0
Population outlook (Cabell County) Hauer SSP2
- Today (2025)
- 97,574 people
- By 2030
- 98,060 · +0.5%
- By 2040
- 98,817 · +1.3%
- By 2050
- 100,185 · +2.7%
- By 2075
- 105,895 · +8.5%
- By 2100
- 105,948 · +8.6%
Race, ethnicity, and origin ACS 2023
- Neighborhood character
- Predominantly White (82%)
- Race & ethnicity
- White 82% Black 8% Two or more races 6% Hispanic / Latino 2% Asian 2%
- Common ancestry
- Slovak 4% Italian 2% Serbian 2%
- Foreign-born
- 2% · China
- Languages at home
- 96% English-only · Spanish 2% Other Indo-European 1% Chinese 1%
Political lean MEDSL · Cabell
- 2024 margin
- Strong R (+21.9) · D 38.0% · R 59.9% · Other 2.0%
- 2008→2024 swing
- -11.8pp toward R · 2008: -10.1pp · 2024: -21.9pp
- All cycles
- 2024: R+21.9 2020: R+18.0 2016: R+25.5 2012: R+13.9 2008: R+10.1
Not yet ingested
- Civics
- —
Market trends
- HPI YoY
- ▼ -19.39%
- Current HPI
- 202.9629
- Rent YoY
- ▲ 10.58%
- Metro
- Huntington-Ashland, WV-KY-OH
- State GDP YoY
- —
- F500 in state
- 0
Price history
+133.8% since first listed7 events — show timeline
- 2026-05-09 Pending — HBRMLS
- 2026-04-29 Price Changed $159,000 HBRMLS
- 2026-04-17 Listed $169,900 HBRMLS
- 2019-06-03 Sold (Public Records) $85,000 Public Records
- 2019-06-03 Sold (MLS) $85,000 KVBOR
- 2019-05-20 Listed $102,000 KVBOR
- 2006-08-21 Sold (Public Records) $68,000 Public Records
Property tax history
-2.5%/yrLatest (2025): $395 · -4.3% YoY. Source: county tax records.
Cash-flow waterfall
monthlySold comps — $/sqft
last 12 mo · ≤1 miLoading sold comps…