1124 W Eddy School Rd · Kearney, MI
Flood risk 1/10 · Minimal
- FEMA flood zone
- —
- Chance of flooding over 30 yrs
- 0.0%
- Est. flood insurance / yr
- —
Fire risk 4/10 · Minor
- Est. fire insurance / yr
- $784 – $1,456
Heat risk 1/10 · Minimal
- Hot days now (above 94°F)
- 7 days/yr
- Hot days in 30 yrs
- 13 days/yr
Wind risk 1/10 · Minimal
- Chance of severe wind over 30 yrs
- —
Air-quality risk 2/10 · Minimal
- Unhealthy air days now
- 0 days/yr
- Unhealthy air days in 30 yrs
- 1 days/yr
Risk factors via First Street. Map © Google.
Why this score? — see what drove the D grade
The composite is a weighted blend of 9 inputs, each scored 0–100. Each bar is that input's sub-score; the figure is the points it added to the 100-point composite (weight × sub-score).
- Cash flow +16.7/30.0
- ARV discount +7.5/15.0
- DSCR +5.2/10.0
- Schools +4.3/10.0
- 1% rule +3.2/10.0
- Rent growth +2.5/5.0
- Livability +2.5/5.0
- Condition / age +2.5/5.0
- Appreciation +0.0/10.0
$120,000
🖨 Deal sheet 📄 Offer letter ✓ Due diligence
Listing remarks
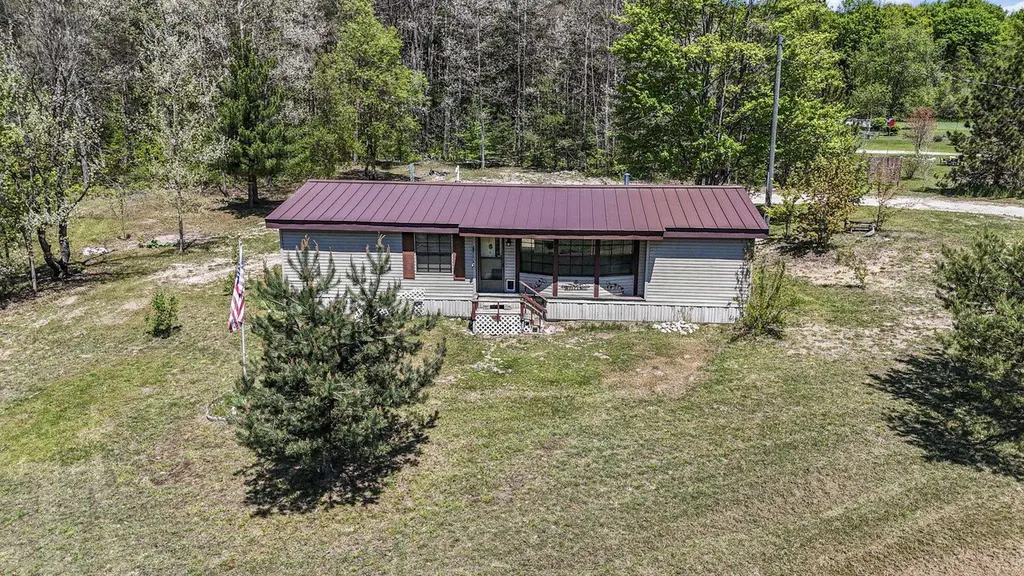
Set on 2.7 partly wooded acres just outside Bellaire, this 3 bed, 2 bath home offers peaceful Northern Michigan living with room to breathe. Wake up to deer moving through the tree line and birdsong you won't find closer to the city. The lot gives you space to garden, expand, or simply enjoy the natural surroundings. The home features a like-new metal roof, natural gas utilities, and solid potential to make it your own. Just under 5 minutes to boat launches on both Lake Bellaire and Intermediate Lake, about 15 minutes to Torch Lake, and close to everything Bellaire has to offer year round, from snowmobile trails in winter to paddle boarding in summer. A great opportunity to own a slice of N
Key facts
- Snowmobile trails
- Partly wooded acres
- Boat launches
Tags
Neighborhood map
What this means for you Summary
Snapshot
- This is a 3-bed/2.0-bath single-family listed at $120k.
Deal economics
- At list price, monthly cash flow is $75 ($898/yr) — positive.
- The deal already cash-flows at list — no discount required.
- To meet the 1% rule (rent ≥ 1% of price), the offer needs to be $98k (18.2% below list).
- Recommended offer: $98k (18.2% below list) — sets the bar for 1% rule.
Location & tenants
- Location reads: area grade D — affects rentability + tenant quality, not the cash-flow math above.
- Bellaire Public Schools (rural): math 40% / reading 55% proficiency, ranked #217 of 760 in MI (top 29%) — families likely to look elsewhere, expect single-tenant / working-renter base with shorter leases.
- Market conditions: 203 active listings in the ZIP; 101 units permitted in Antrim County in 2024 (0 in 5+ unit buildings).
Forward outlook
- Local home prices are declining (-3.0%/yr); year-one equity from $830 of loan paydown is wiped out by about $4k of value loss. Plan a longer hold.
- Antrim County population projected at -27% by 2050 — secular population decline; favor cash flow + early exit over multi-decade hold.
Negotiation context
- It's been on market 16 days — a 2% lower offer ($118k) is reasonable based on typical stale-listing flexibility.
- 2 sale attempts; this cycle's ask has dropped $45k (27%) from the opening price — seller is motivated, your offer sets the floor, not the list.
- Current owner paid $7k; list at $120k implies a 1614% gain — meaningful room to come down on a strong offer.
Questions for the listing agent
- Built in 1977 — when were the roof, HVAC, electrical panel, plumbing, and water heater last replaced?
- Is there a deadline driving the sale (1031 exchange, divorce, estate, relocation)? That informs how much negotiation room exists.
- The area grade is low — what's the realistic commute time and amenity access for the typical tenant pool here? Any planned neighborhood developments (good or bad) we should know about?
- What's the average days-on-market for RENTAL listings here right now (not sales)? A rising rental-DOM trend means longer vacancies and softer asking-rent achievability than the comps imply.
- What's the recent tenant-quality profile in this submarket — average credit score on applications, eviction rate, late-payment / NSF rate, and stable-employment percentage? A property-management company in the area should have these aggregated.
- How much new for-sale + rental construction is in the pipeline within 1–3 miles? Heavy new supply typically softens prices + rents 12–24 months out; constrained supply supports both.
Investment metrics
- 1% rule
- 0.82% ✗
- Cap rate
- 7.04%
- Cash-on-cash
- 2.67%
- DSCR
- 1.12
- GRM
- 10.2
CMA / ARV
- ARV (median comp)
- $358,977
- List price
- $120,000
- Delta
- -62.39%
- Verdict
- UNDERPRICED
- Comps
- 2 within 2.0 mi
Projected returns pro-forma
-3.0% appreciation · 3.0% rent growth · sell at horizon
- IRR
- -12.1%
- Equity multiple
- 0.56×
- Total profit
- $-14,742
- Equity at exit
- $17,892
- IRR
- -3.1%
- Equity multiple
- 0.79×
- Total profit
- $-6,959
- Equity at exit
- $10,375
Cash invested: $33,600 (down + closing). Projections, not guarantees.
Landlord ↔ Tenant lean methodology
- Overall (STATE)
- 62 Landlord-Friendly
- State Michigan
- 62 Landlord-Friendly · EVEN
- County
- — inherits STATE
- City
- — inherits STATE
ZIP-level market 49615
- Home prices YoY
- -16.5%
- Active inventory
- 203
- Price-to-rent
- 10.2×
Monthly cashflow live
- Estimated rent
- $982 medium interval (Pro) →
- Mortgage (P&I)
- −$629
- Tax from tax record
- −$21 /mo · $257/yr
- Insurance
- −$50
- HOA
- −$0
- Vacancy / Maint / Mgmt
- −$206
- Net cashflow
- $75
Break-even live
UW: 25.0% down · 7.5% · 30yr · 1.5% tax · 5.0% vac · 8.0% maint · 8.0% mgmt
Financing live
Cash to close
- Down payment
- $30,000
- Closing costs
- $3,600
- Reserves months
- —
- Total cash needed
- —
Loan-product check · same deal, 3 products live
Conventional
25% down · 7.5% · 30yr
- Down + closing
- —
- Monthly P&I
- —
- Monthly cashflow
- —
- DSCR
- —
- Eligible?
- —
Personal DTI + credit; lowest rate.
DSCR
20% down · 8.5% · 30yr
- Down + closing
- —
- Monthly P&I
- —
- Monthly cashflow
- —
- DSCR
- —
- Eligible?
- —
No personal income docs; deal must DSCR.
Hard money
10% down · 12.0% · 12mo
- Down + closing
- —
- Monthly P&I
- —
- Monthly cashflow
- —
- DSCR
- —
- Eligible?
- —
Short-term bridge; refi at stabilization.
Listing history 22 events
-
2026-06-18days on market $120,000 Active 16 DOM
-
2026-06-17days on market $120,000 Active 15 DOM
-
2026-06-16days on market $120,000 Active 14 DOM
-
2026-06-15days on market $120,000 Active 13 DOM
-
2026-06-13days on market $120,000 Active 11 DOM
-
2026-06-12days on market $120,000 Active 10 DOM
-
2026-06-09days on market $120,000 Active 7 DOM
-
2026-06-08days on market $120,000 Active 6 DOM
-
2026-06-07days on market $120,000 Active 5 DOM
-
2026-06-07days on market $120,000 Active 4 DOM
-
2026-06-02pricestatusdays on market $120,000 Active 1 DOM
-
2026-05-11historical
-
2026-05-11historical
-
2025-12-17price $135,000
-
2025-12-16price $135,000
-
2025-11-12price $145,000
-
2025-11-11price $145,000
-
2025-10-11price $154,000
-
2025-10-10price $154,000
-
2025-09-19$165,000 Active
-
2025-09-19$165,000 Active
-
2016-11-09soldstatus $7,000
ⓘ Source: listings_history table (triggers on properties + properties_extension) + one-shot
backfill from property_details.listing_events for pre-trigger history.
Tax reassessment forecast MI · Partial reset (capped growth)
- Current annual tax
- $257 · $21/mo
- Projected year-2 tax
- $1,052 · $88/mo
- Expected delta
- +$796/yr (+$66/mo · 309.6%)
ⓘ Screening estimate from a state-policy table — verify with the county assessor before closing.
Climate risk First Street
- Flood 1/10 Low 0% chance over 30 yrs
- Wildfire 4/10 Moderate
- Heat 1/10 Low 7 d/yr ≥94°F today · 13 d/yr by 30 yrs out
- Wind 1/10 Low
- Air quality 2/10 Low 0 unhealthy d/yr today · 1 by 30 yrs out
Nearby sold comps map
Loading sold comps map…
Walkable amenities ~0.75 mi
Loading nearby amenities…
Taxation est. · year 1
- Rental income
- $11,781
- − Mortgage interest
- −$6,722
- − Property taxes
- −$257
- − Insurance
- −$600
- − Repairs & maintenance
- −$942
- − Management
- −$942
- − Depreciation
- −$3,491
- Taxable loss
- −$1,174
- Est. tax savings @ 24.0%
- +$282
- After-tax cash flow
- $1,180/yr
For passive investors: Depreciation is non-cash, so a rental often shows a tax loss while cash-flowing — sheltering income. Rental losses are passive: they offset passive income freely, and up to $25,000/yr can offset ordinary (W-2) income if you actively participate and your MAGI is under $100k (phasing out to $0 by $150k); unused losses carry forward. On sale, claimed depreciation is recaptured at up to 25%, and gains may owe capital-gains tax (a 1031 exchange can defer both). Figures are a year-1 estimate at your 24.0% rate — not tax advice; consult a CPA.
Schools (NCES district)
- District
- Bellaire Public Schools
- NCES district ID
- 2604620
- Math proficiency
- 40% ▲ 10.00%
- Reading proficiency
- 55% ▲ 20.00%
- Median HH income
- $48,597
- Composite
- 42.67/100
- National rank
- #6796
- State rank
- #217 of 760 in MI
Livability — Kearney
No livability data for this city. (Only ~50 U.S. cities are tracked.)
Census & demographics
- Population (ZIP)
- 4,077
Population outlook (Antrim County) Hauer SSP2
- Today (2025)
- 21,804 people
- By 2030
- 20,814 · -4.5%
- By 2040
- 18,394 · -15.6%
- By 2050
- 15,981 · -26.7%
- By 2075
- 11,712 · -46.3%
- By 2100
- 7,651 · -64.9%
Race, ethnicity, and origin ACS 2023
- Neighborhood character
- Predominantly White (93%)
- Race & ethnicity
- White 93% Two or more races 4% Hispanic / Latino 2%
- Common ancestry
- Romanian 10% Iranian 6% Slovak 3%
- Foreign-born
- 1% · Canada, South Korea
- Languages at home
- 97% English-only · Spanish 2%
Political lean MEDSL · Antrim
- 2024 margin
- Strong R (+23.8) · D 37.5% · R 61.2% · Other 1.2%
- 2008→2024 swing
- -13.4pp toward R · 2008: -10.3pp · 2024: -23.8pp
- All cycles
- 2024: R+23.8 2020: R+23.8 2016: R+29.6 2012: R+21.3 2008: R+10.3
Not yet ingested
- Civics
- —
Market trends
- HPI YoY
- ▼ -60.89%
- Current HPI
- 309.0343
- Rent YoY
- —
- Metro
- —
- State GDP YoY
- ▲ 1.37%
- F500 in state
- 28
Industry mix (Fortune 500 HQ in MI)
| Industry | F500 HQs | Revenue |
|---|---|---|
| Automotive Parts | 3 | $48B |
|
||
| Automotive | 2 | $372B |
|
||
| Chemicals | 1 | $45B |
|
||
| Automotive Retail | 1 | $29B |
|
||
| Healthcare / Medical Devices | 1 | $23B |
|
||
| Automotive Technology | 1 | $20B |
|
||
Price history
+1828.6% since first listed11 events — show timeline
- 2026-05-11 Listing Removed — MiRealSource-MiMLS
- 2026-05-11 Listing Removed — REALCOMP
- 2025-12-17 Price Changed $135,000 MiRealSource-MiMLS
- 2025-12-16 Price Changed $135,000 REALCOMP
- 2025-11-12 Price Changed $145,000 MiRealSource-MiMLS
- 2025-11-11 Price Changed $145,000 REALCOMP
- 2025-10-11 Price Changed $154,000 MiRealSource-MiMLS
- 2025-10-10 Price Changed $154,000 REALCOMP
- 2025-09-19 Listed $165,000 MiRealSource-MiMLS
- 2025-09-19 Listed $165,000 REALCOMP
- 2016-11-09 Sold (Public Records) $7,000 Public Records
Property tax history
+6.2%/yrLatest (2025): $257 · -28.6% YoY. Source: county tax records.
Cash-flow waterfall
monthlySold comps — $/sqft
last 12 mo · ≤1 miLoading sold comps…