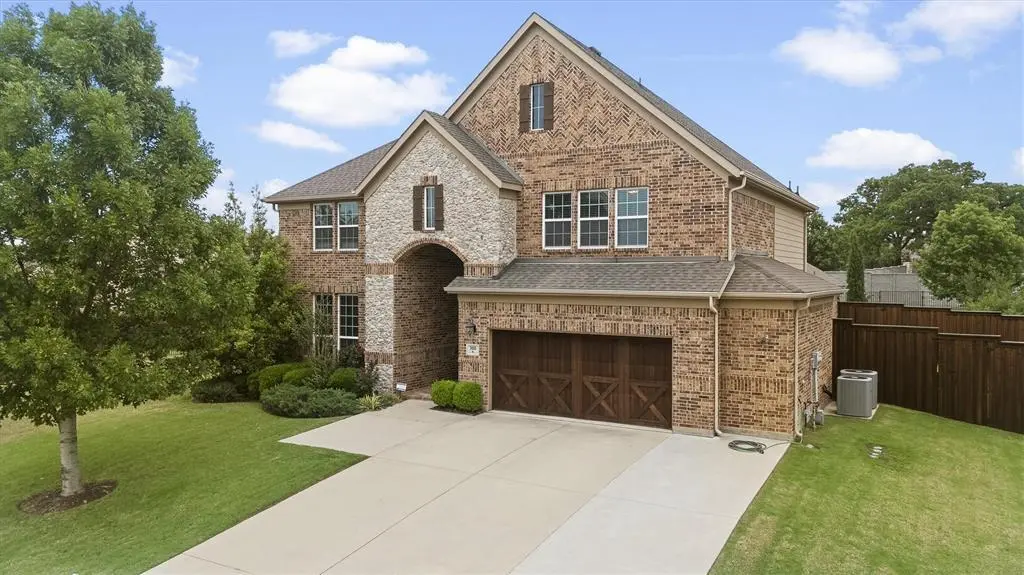
300 Pimlico Dr · Hickory Creek, TX
Flood risk 1/10 · Minimal
- FEMA flood zone
- X (unshaded)
- Chance of flooding over 30 yrs
- 0.0%
- Est. flood insurance / yr
- $507 – $1,088
Fire risk 4/10 · Minor
- Est. fire insurance / yr
- $1,222 – $2,270
Heat risk 7/10 · Major
- Hot days now (above 109°F)
- 7 days/yr
- Hot days in 30 yrs
- 23 days/yr
Wind risk 5/10 · Moderate
- Chance of severe wind over 30 yrs
- 26.0%
Air-quality risk 4/10 · Minor
- Unhealthy air days now
- 4 days/yr
- Unhealthy air days in 30 yrs
- 5 days/yr
Risk factors via First Street. Map © Google.
Why this score? — see what drove the C grade
The composite is a weighted blend of 9 inputs, each scored 0–100. Each bar is that input's sub-score; the figure is the points it added to the 100-point composite (weight × sub-score).
- Cash flow +26.0/30.0
- DSCR +8.8/10.0
- 1% rule +7.0/10.0
- ARV discount +5.6/15.0
- Livability +3.6/5.0
- Schools +3.4/10.0
- Rent growth +2.5/5.0
- Condition / age +2.5/5.0
- Appreciation +0.0/10.0
$859,900
🖨 Deal sheet 📄 Offer letter ✓ Due diligence
Listing remarks
Lake Lewisville's Premier Lakeside Community offering a Neighborhood lined with neatly manicured oversized yards, trees and Greenbelt space to make you feel relaxed the minute you drive in!! The community is a golf cart friendly space with access to all the parks for the Lake! As you enter you will notice soaring ceilings and a Beautiful view to your Backyard Retreat! The double doors to left of entering home offers multi-generational living space with two seperate bedrooms or living room and private ensuite bath! The home also features a mudroom to house bookbags, shoes and hats! The beautiful staircase leads to fun spaces to enjoy like a game room, media room and the secondary bedrooms!
Key facts
- Lakeside community
- Leisure living pool
- Mudroom
Tags
Property features AI
Finance
- Other: Easements for utilities; Will not subdivide
- Financial info: Listing accepts Cash, Conventional, FHA, and VA financing
- HOA & community: Mandatory association; Annual association fee covers full use of facilities; HOA management: Steeplechase of Hickory Creek; Community features include clubhouse, community pool, pool, lake, fishing, park, greenbelt
Exterior
- Parking: Attached 2-car garage with garage door opener (garage faces front); 2 covered parking spaces; Additional driveway/parking; Concrete driveway
- Security: Carbon monoxide detector(s); Smoke detector(s)
- Utilities: City water; City sewer; Individual gas meter; Individual water meter
- Home design: Single family residence; Two stories; Residential property; Smart home features present; Not attached to other properties; Subdivision setting
- Construction: Built in 2017; Brick construction; Composition roof; Slab foundation
- Exterior features: Covered and screened porch(es); Outdoor living center; Gutters; Outdoor lighting; Wood and wrought iron fencing; Sprinkler system; Landscaped yard; Greenbelt
Interior
- Kitchen: Built-in gas range; Gas cooktop; Double oven; Microwave; Dishwasher; Disposal; Granite countertops; Farm sink; Breakfast bar; Kitchen island; Walk-in pantry; Water line to refrigerator; Tankless water heater
- Bedrooms: 5 bedrooms; Primary bedroom on main level; Secondary primary-style bedroom on main level; Guest suite on main level; Additional bedrooms on second level
- Flooring: Carpet; Ceramic tile; Tile
- Bathrooms: 5 bathrooms total (3 full, 2 half); Primary bath with dual sinks, separate shower, separate vanities, linen closet, built-in cabinets, natural stone/granite
- Heating & cooling: Central air; Natural gas heating; ENERGY STAR qualified equipment
- Interior features: Cable TV available; Decorative lighting; Flat screen wiring; High-speed internet available; In-law suite floorplan; Kitchen island; Pantry; Vaulted ceilings; Walk-in closets; Electric shades; Window coverings; Four living areas; One dining area; Total room count: 14; Two levels
- Laundry & utility: Full-size washer/dryer area; Tankless water heater
Neighborhood map
What this means for you Summary
Snapshot
- This is a 3-bed/2.0-bath single-family listed at $860k.
Deal economics
- At list price, monthly cash flow is $2k ($26k/yr) — positive.
- The deal already cash-flows at list — no discount required.
- Meets the 1% rule at list price ($10k rent vs $860k).
- Recommended offer: $847k (1.5% below list) — sets the bar for market timing.
- Cap rate 9.3% vs local median 2.6% in Hickory Creek — top-decile yield for the area; either an underpriced asset or a hidden risk that comps aren't pricing in. Stress-test before assuming the spread holds.
Location & tenants
- Location reads 72/100 on livability (#238 in TX) — a middle-class / working-renter tenant base. Strengths: crime A+, employment A+, housing A+; Watch: cost of living D+, amenities F, commute F.
- Lake Dallas ISD (suburban): math 34% / reading 39% proficiency, ranked #413 of 826 in TX (top 50%) — families likely to look elsewhere, expect single-tenant / working-renter base with shorter leases.
- Zoned schools: Lake Dallas El (math 30% / reading 32%, grade F, #2,429 of 4,322 statewide, top 57%, 534 students, 63% FRL) — zoned schools average 63% FRL vs 36% district-wide (26 pts higher); higher-poverty schools than district average — tighter screening recommended.
- Market conditions: 130 active listings in the ZIP; 3 comparable units currently listed for rent nearby; rentals at typical pace (median 24d on market — plan ~3-4 weeks tenant-placement turnaround); 10,531 units permitted in Denton County in 2024 (2,713 in 5+ unit buildings).
Forward outlook
- Local home prices are declining (-3.0%/yr); year-one equity from $6k of loan paydown is wiped out by about $26k of value loss. Plan a longer hold.
- Denton County population projected at +66% by 2050 — long-run rental-demand tailwind backs the buy-and-hold thesis.
Negotiation context
- It's been on market 25 days — a 2% lower offer ($847k) is reasonable based on typical stale-listing flexibility.
- 5 sale attempts since 9y ago with the ask held roughly flat each time — persistent listings suggest the price (not the market) is what's stuck; bring a comps-based counter.
Risks & watch-outs
- Climate carrying-cost: moderate wind risk, 26% chance of damaging wind over 30y; extreme-heat days projected 7→23/yr by 2055 (HVAC capex compounding) — expect insurance premiums to compound above CPI over the hold.
Questions for the listing agent
- What does the HOA fee cover, when was the last increase, and are there any pending special assessments or reserve-fund shortfalls?
- Is there a deadline driving the sale (1031 exchange, divorce, estate, relocation)? That informs how much negotiation room exists.
- Schools are A-rated — typically a magnet for longer-tenancy family renters. What's the average tenant stay here, and is there a school-zone premium baked into asking?
- What's the average days-on-market for RENTAL listings here right now (not sales)? A rising rental-DOM trend means longer vacancies and softer asking-rent achievability than the comps imply.
- What's the recent tenant-quality profile in this submarket — average credit score on applications, eviction rate, late-payment / NSF rate, and stable-employment percentage? A property-management company in the area should have these aggregated.
- How much new for-sale + rental construction is in the pipeline within 1–3 miles? Heavy new supply typically softens prices + rents 12–24 months out; constrained supply supports both.
Investment metrics
- 1% rule
- 1.20% ✓
- Cap rate
- 9.30%
- Cash-on-cash
- 10.73%
- DSCR
- 1.48
- GRM
- 6.9
CMA / ARV
- ARV (median comp)
- $825,051
- List price
- $859,900
- Delta
- 4.22%
- Verdict
- FAIR
- Comps
- 20 within 1.0 mi
Show comp detail 10 sales within ~0.75 mi
| Address | Dist | Beds/Ba | Sqft | Sold | Price | $/sf | Match |
|---|---|---|---|---|---|---|---|
| 308 Secretariat Dr | 0.19mi | 4/3.5 (+1) | 3,821 (-2%) | 10mo | $925,000 | $242 | 69 |
| 110 Stallion Ln | 0.07mi | 4/4.0 (+1) | 3,608 (-7%) | 3mo | $839,000 | $233 | 69 |
| 217 Pimlico Dr | 0.08mi | 4/4.5 (+1) | 4,103 (+5%) | 7mo | $850,000 | $207 | 67 |
| 119 Citation Ln | 0.26mi | 4/3.0 (+1) | 3,716 (-4%) | 19mo | $805,000 | $217 | 56 |
| 4124 Kyles Landing Dr | 0.51mi | 4/3.5 (+1) | 3,679 (-6%) | 2mo | $650,000 | $177 | 55 |
| 231 Secretariat Dr | 0.18mi | 4/3.5 (+1) | 3,399 (-13%) | 24mo | $799,999 | $235 | 40 |
| 1106 Ellard Dr | 0.63mi | 4/3.0 (+1) | 3,392 (-13%) | 2mo | $1,100,000 | $324 | 38 |
| 118 Shadow Creek Ln | 0.48mi | 4/3.0 (+1) | 3,374 (-13%) | 19mo | $650,400 | $193 | 31 |
| 132 Shadow Creek Ln | 0.45mi | 4/3.5 (+1) | 3,434 (-12%) | 21mo | $715,000 | $208 | 31 |
| 116 Nora Ln | 0.65mi | 4/3.5 (+1) | 3,367 (-14%) | 13mo | $635,000 | $189 | 25 |
Match score weights: distance 35% · size 25% · config 20% · recency 20%. Top-matched comps best support the ARV.
Projected returns pro-forma
-3.0% appreciation · 3.0% rent growth · sell at horizon
- IRR
- -0.2%
- Equity multiple
- 0.99×
- Total profit
- $-2,052
- Equity at exit
- $128,214
- IRR
- 9.5%
- Equity multiple
- 1.73×
- Total profit
- $175,529
- Equity at exit
- $74,348
Cash invested: $240,772 (down + closing). Projections, not guarantees.
Landlord ↔ Tenant lean methodology
- Overall (STATE)
- 87 Strongly Landlord-Friendly
- State Texas
- 87 Strongly Landlord-Friendly · R+5
- County
- — inherits STATE
- City
- — inherits STATE
ZIP-level market 75065
- Home prices YoY
- -6.8%
- Active inventory
- 130
- Price-to-rent
- 6.9×
Monthly cashflow live
- Estimated rent
- $10,323 medium interval (Pro) →
- Mortgage (P&I)
- −$4,509
- Tax from tax record
- −$1,049 /mo · $12,589/yr
- Insurance
- −$358
- HOA
- −$86
- Vacancy / Maint / Mgmt
- −$2,168
- Net cashflow
- $2,153
Break-even live
UW: 25.0% down · 7.5% · 30yr · 1.5% tax · 5.0% vac · 8.0% maint · 8.0% mgmt
Financing live
Cash to close
- Down payment
- $214,975
- Closing costs
- $25,797
- Reserves months
- —
- Total cash needed
- —
Loan-product check · same deal, 3 products live
Conventional
25% down · 7.5% · 30yr
- Down + closing
- —
- Monthly P&I
- —
- Monthly cashflow
- —
- DSCR
- —
- Eligible?
- —
Personal DTI + credit; lowest rate.
DSCR
20% down · 8.5% · 30yr
- Down + closing
- —
- Monthly P&I
- —
- Monthly cashflow
- —
- DSCR
- —
- Eligible?
- —
No personal income docs; deal must DSCR.
Hard money
10% down · 12.0% · 12mo
- Down + closing
- —
- Monthly P&I
- —
- Monthly cashflow
- —
- DSCR
- —
- Eligible?
- —
Short-term bridge; refi at stabilization.
Rent comps 3 comps
| Address | Beds | Baths | Sqft | Rent | $/sqft | DOM | Units | Dist |
|---|---|---|---|---|---|---|---|---|
| 201 Barkley Dr Unit 1391266P Hickory Creek, TX | 4.0 | 3.0 | 3239 | $15,242 | $4.71 | 24d | 1 | 1.10mi |
| 201 Barkley Dr Lake Dallas, TX | 4.0 | 3.0 | 3243 | $10,500 | $3.24 | 21d | 1 | 1.10mi |
| 2701 Clark Dr Corinth, TX | 4.0 | 2.5 | 2837 | $2,495 | $0.88 | 43d | 1 | 1.49mi |
HOA detail
- Monthly dues
- $86 · $1,032/yr
Listing history 15 events
-
2026-05-04historical Active Option Contract 1922-char remark
-
2026-04-24$859,900 Active 1922-char remark
-
2025-09-29historical
-
2025-07-17$859,900 Active
-
2022-11-02historical
-
2022-09-22$865,000 Active
-
2018-06-07soldstatus
-
2018-06-06soldstatus Sold
-
2018-05-17status Pending
-
2018-02-07price $502,000
-
2018-01-26$562,910 Active
-
2018-01-09soldstatus
-
2017-10-18historical
-
2017-05-18$551,910 Active
-
2017-01-06soldstatus
ⓘ Source: listings_history table (triggers on properties + properties_extension) + one-shot
backfill from property_details.listing_events for pre-trigger history.
Tax reassessment forecast TX · Resets to sale price
- Current annual tax
- $12,589 · $1,049/mo
- Projected year-2 tax
- $15,736 · $1,311/mo
- Expected delta
- +$3,147/yr (+$262/mo · 25.0%)
ⓘ Screening estimate from a state-policy table — verify with the county assessor before closing.
Climate risk First Street
- Flood 1/10 Low FEMA zone X (unshaded) · 0% chance over 30 yrs
- Wildfire 4/10 Moderate
- Heat 7/10 Severe 7 d/yr ≥109°F today · 23 d/yr by 30 yrs out
- Wind 5/10 Major 26% chance of damaging wind over 30 yrs
- Air quality 4/10 Moderate 4 unhealthy d/yr today · 5 by 30 yrs out
Nearby sold comps map
Loading sold comps map…
Walkable amenities ~0.75 mi
Loading nearby amenities…
Taxation est. · year 1
- Rental income
- $123,878
- − Mortgage interest
- −$48,168
- − Property taxes
- −$12,589
- − Insurance
- −$4,300
- − Repairs & maintenance
- −$9,910
- − Management
- −$9,910
- − HOA
- −$1,032
- − Depreciation
- −$25,015
- Taxable income
- $12,954
- Est. tax owed @ 24.0%
- −$3,109
- After-tax cash flow
- $22,721/yr
For passive investors: Depreciation is non-cash, so a rental often shows a tax loss while cash-flowing — sheltering income. Rental losses are passive: they offset passive income freely, and up to $25,000/yr can offset ordinary (W-2) income if you actively participate and your MAGI is under $100k (phasing out to $0 by $150k); unused losses carry forward. On sale, claimed depreciation is recaptured at up to 25%, and gains may owe capital-gains tax (a 1031 exchange can defer both). Figures are a year-1 estimate at your 24.0% rate — not tax advice; consult a CPA.
Schools (NCES district)
- District
- Lake Dallas ISD
- NCES district ID
- 4826430
- Math proficiency
- 34% ▼ -20.00%
- Reading proficiency
- 39% ▼ -10.00%
- Median HH income
- $76,645
- Composite
- 34.13/100
- National rank
- #5287
- State rank
- #413 of 826 in TX
Livability — Hickory Creek
- Score
- 72/100
- State rank
- #238
- US rank
- #5782
Category grades
Schools grade is shown separately in the Schools card above.
Census & demographics
- Census place
- Hickory Creek, TX
- City population
- 13,046
- Population (ZIP)
- 13,046
Population outlook (Denton County) Hauer SSP2
- Today (2025)
- 1,053,010 people
- By 2030
- 1,192,269 · +13.2%
- By 2040
- 1,472,920 · +39.9%
- By 2050
- 1,746,506 · +65.9%
- By 2075
- 2,358,497 · +124.0%
- By 2100
- 2,779,183 · +163.9%
Race, ethnicity, and origin ACS 2023
- Neighborhood character
- Majority White (62%)
- Race & ethnicity
- White 62% Hispanic / Latino 27% Two or more races 13% Black 6% Asian 3%
- Hispanic origin (detail)
- Mexican 23%
- Common ancestry
- Italian 9% Slovak 2% Serbian 1%
- Foreign-born
- 20% · Canada, South Korea, United Kingdom
- Languages at home
- 73% English-only · Spanish 21% Korean 2% Other Asian/Pacific 1%
Political lean MEDSL · Denton
- 2024 margin
- R (+13.2) · D 42.7% · R 55.8% · Other 1.5%
- 2008→2024 swing
- +11.0pp toward D · 2008: -24.2pp · 2024: -13.2pp
- All cycles
- 2024: R+13.2 2020: R+8.1 2016: R+20.2 2012: R+31.7 2008: R+24.2
Not yet ingested
- Civics
- —
Market trends
- HPI YoY
- ▼ -21.91%
- Current HPI
- 300.0981
- Rent YoY
- —
- Metro
- —
- State GDP YoY
- ▲ 3.95%
- F500 in state
- 110
Industry mix (Fortune 500 HQ in TX)
| Industry | F500 HQs | Revenue |
|---|---|---|
| Energy | 16 | $1,198B |
|
||
| Technology | 5 | $198B |
|
||
| Engineering / Construction | 4 | $72B |
|
||
| Energy Services | 3 | $60B |
|
||
| Utilities | 3 | $41B |
|
||
| Healthcare | 2 | $330B |
|
||
Price history
+55.8% since first listed17 events — show timeline
- 2026-06-11 Sold (MLS) — NTREIS
- 2026-05-19 Pending — NTREIS
- 2026-05-04 Contingent — NTREIS
- 2026-04-24 Listed $859,900 NTREIS
- 2025-09-29 Listing Removed — NTREIS
- 2025-07-17 Listed $859,900 NTREIS
- 2022-11-02 Listing Removed — NTREIS
- 2022-09-22 Listed $865,000 NTREIS
- 2018-06-07 Sold (Public Records) — Public Records
- 2018-06-06 Sold (MLS) — NTREIS
- 2018-05-17 Pending — NTREIS
- 2018-02-07 Price Changed $502,000 NTREIS
- 2018-01-26 Listed $562,910 NTREIS
- 2018-01-09 Sold (Public Records) — Public Records
- 2017-10-18 Listing Removed — NTREIS
- 2017-05-18 Listed $551,910 NTREIS
- 2017-01-06 Sold (Public Records) — Public Records
Property tax history
+26.6%/yrLatest (2025): $12,589 · +2.7% YoY. Source: county tax records.
Cash-flow waterfall
monthlySold comps — $/sqft
last 12 mo · ≤1 miLoading sold comps…