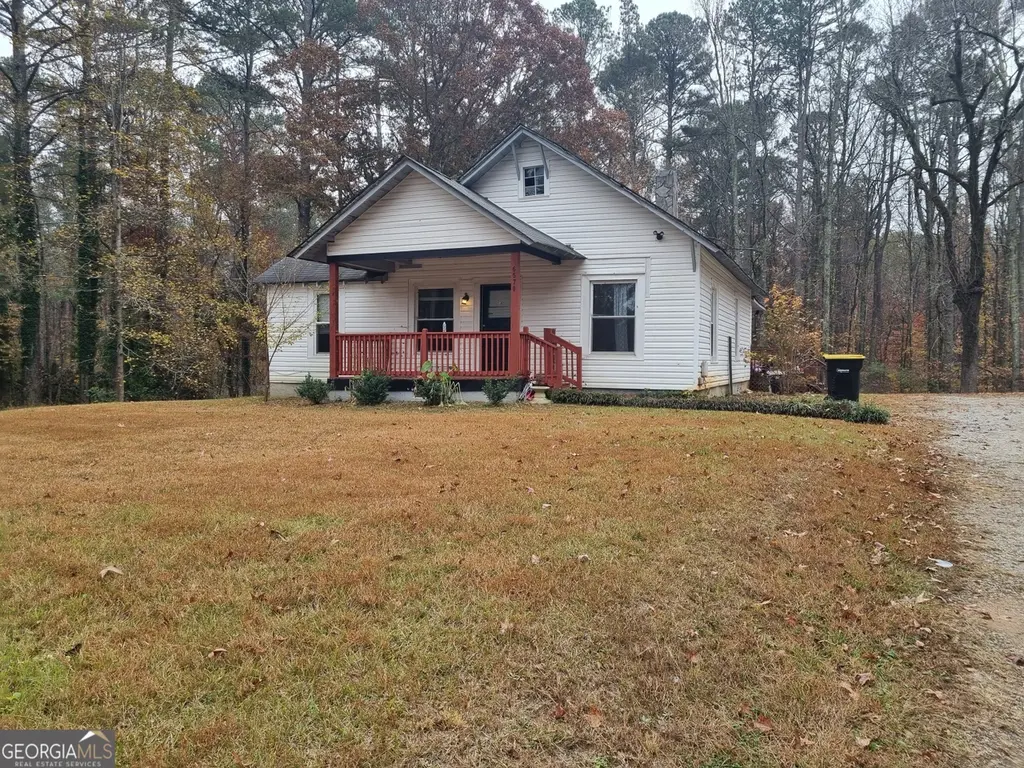
6570 Rivertown Rd · Fairburn, GA
Flood risk 1/10 · Minimal
- FEMA flood zone
- X (unshaded)
- Chance of flooding over 30 yrs
- 0.0%
- Est. flood insurance / yr
- $473 – $860
Fire risk 3/10 · Minor
- Est. fire insurance / yr
- $963 – $1,789
Heat risk 5/10 · Moderate
- Hot days now (above 103°F)
- 7 days/yr
- Hot days in 30 yrs
- 19 days/yr
Wind risk 6/10 · Moderate
- Chance of severe wind over 30 yrs
- 27.0%
Air-quality risk 3/10 · Minor
- Unhealthy air days now
- 3 days/yr
- Unhealthy air days in 30 yrs
- 4 days/yr
Risk factors via First Street. Map © Google.
Why this score? — see what drove the D grade
The composite is a weighted blend of 9 inputs, each scored 0–100. Each bar is that input's sub-score; the figure is the points it added to the 100-point composite (weight × sub-score).
- Cash flow +14.2/30.0
- ARV discount +9.2/15.0
- Schools +4.5/10.0
- DSCR +4.3/10.0
- 1% rule +3.3/10.0
- Livability +3.2/5.0
- Rent growth +3.1/5.0
- Condition / age +2.5/5.0
- Appreciation +0.0/10.0
$259,900
🖨 Deal sheet (PDF) 📄 Offer letter ✓ Due diligence
Listing remarks MLS
Charming cottage needs modernization. This is a great fixer up property. A good rental or great starter home in a central location.
Key facts
- 1.57 acre lot
- 6 parking spots
- Built 1926
Neighborhood map
What this means for you Summary
Snapshot
- This is a 3-bed/1.0-bath single-family listed at $260k.
Deal economics
- At list price, monthly cash flow is $45 ($536/yr) — positive.
- The deal already cash-flows at list — no discount required.
- To meet the 1% rule (rent ≥ 1% of price), the offer needs to be $215k (17.1% below list).
- Recommended offer: $215k (17.1% below list) — sets the bar for 1% rule.
- Cap rate 6.5% vs local median 4.0% in Fairburn — top-decile yield for the area; either an underpriced asset or a hidden risk that comps aren't pricing in. Stress-test before assuming the spread holds.
Location & tenants
- Location reads 63/100 on livability (#291 in GA) — a middle-class / working-renter tenant base. Strengths: crime A+, cost of living A+, housing A+; Watch: employment C-, amenities F, commute F.
- Fulton County (suburban): math 49% / reading 53% proficiency, ranked #12 of 174 in GA (top 7%) — acceptable for families but not a draw, mixed tenant base, ~2y average lease.
- Zoned schools: E. C. West Elementary School (math 21% / reading 32%, grade F, #718 of 1,228 statewide, top 59%, 853 students, 100% FRL); Bear Creek Middle School (math 17% / reading 26%, grade F, #339 of 470 statewide, top 72%, 1,108 students, 100% FRL); Creekside High School (math 30% / reading 24%, grade F, #160 of 424 statewide, top 38%, 1,768 students, 100% FRL) — zoned schools average 100% FRL vs 41% district-wide (59 pts higher); higher-poverty schools than district average — tighter screening recommended.
- Zoned-school proficiency averages 25% at this address vs 51% district-wide (-26 pts) — the specific schools serving this property underperform the Fulton County average; the district grade overstates school quality for this exact location.
- Market conditions: Rents rising (+2.5%/yr); 546 active listings in the ZIP; 11 comparable units currently listed for rent nearby; rentals at typical pace (median 24d on market — plan ~3-4 weeks tenant-placement turnaround); solid renter incomes; 11,565 units permitted in Fulton County in 2024 (8,159 in 5+ unit buildings).
Forward outlook
- Local home prices are declining (-3.0%/yr); year-one equity from $2k of loan paydown is wiped out by about $8k of value loss. Plan a longer hold.
- Fulton County population projected at +38% by 2050 — long-run rental-demand tailwind backs the buy-and-hold thesis.
Negotiation context
- It's been on market 187 days — a 12% lower offer ($229k) is reasonable based on typical stale-listing flexibility.
- 4 sale attempts since 10y ago with the ask held roughly flat each time — persistent listings suggest the price (not the market) is what's stuck; bring a comps-based counter.
- Current owner paid $140k; list at $260k implies a 86% gain — meaningful room to come down on a strong offer.
Risks & watch-outs
- Watch-outs: built in 1926 — expect roof / HVAC / electrical / plumbing capex.
- Climate carrying-cost: major wind risk, 27% chance of damaging wind over 30y; extreme-heat days projected 7→19/yr by 2055 (HVAC capex compounding) — expect insurance premiums to compound above CPI over the hold.
Questions for the listing agent
- It's been on market 187 days. Have you received any prior offers? Is the seller open to a 17% concession, seller financing, or rate buy-down credit?
- Built in 1926 — when were the roof, HVAC, electrical panel, plumbing, and water heater last replaced?
- Why hasn't it sold? Are there any deal-killer items the seller is aware of (foundation, flood, title, zoning, code violations)?
- Is there a deadline driving the sale (1031 exchange, divorce, estate, relocation)? That informs how much negotiation room exists.
- Schools are F-rated, which usually means shorter tenancies and higher turnover. Who's the typical renter profile here, and what's been the actual vacancy rate?
- The area grade is low — what's the realistic commute time and amenity access for the typical tenant pool here? Any planned neighborhood developments (good or bad) we should know about?
- What's the average days-on-market for RENTAL listings here right now (not sales)? A rising rental-DOM trend means longer vacancies and softer asking-rent achievability than the comps imply.
- What's the recent tenant-quality profile in this submarket — average credit score on applications, eviction rate, late-payment / NSF rate, and stable-employment percentage? A property-management company in the area should have these aggregated.
- How much new for-sale + rental construction is in the pipeline within 1–3 miles? Heavy new supply typically softens prices + rents 12–24 months out; constrained supply supports both.
Investment metrics
- 1% rule
- 0.83% ✗
- Cap rate
- 6.50%
- Cash-on-cash
- 0.74%
- DSCR
- 1.03
- GRM
- 10.1
CMA / ARV
- ARV (median comp)
- $270,000
- List price
- $259,900
- Delta
- -3.74%
- Verdict
- FAIR
- Comps
- 13 within 1.0 mi
Show comp detail 4 sales within ~0.75 mi
| Address | Dist | Beds/Ba | Sqft | Sold | Price | $/sf | Match |
|---|---|---|---|---|---|---|---|
| 430 Mary Erna Dr | 0.15mi | 3/2.0 | 1,426 (-1%) | 0mo | $270,000 | $189 | 88 |
| 620 Blue Flag Ln | 0.66mi | 3/2.0 | 1,404 (-2%) | 7mo | $264,900 | $189 | 56 |
| 600 Mary Erna Dr | 0.47mi | 4/2.0 (+1) | 1,464 (+2%) | 13mo | $275,000 | $188 | 55 |
| 7235 Magnolia Ln | 0.48mi | 4/3.0 (+1) | 1,423 (-1%) | 13mo | $325,000 | $228 | 52 |
Match score weights: distance 35% · size 25% · config 20% · recency 20%. Top-matched comps best support the ARV.
Projected returns pro-forma
-3.0% appreciation · 2.53% rent growth · sell at horizon
- IRR
- -15.6%
- Equity multiple
- 0.45×
- Total profit
- $-40,339
- Equity at exit
- $38,752
- IRR
- -8.0%
- Equity multiple
- 0.51×
- Total profit
- $-35,802
- Equity at exit
- $22,471
Cash invested: $72,772 (down + closing). Projections, not guarantees.
Landlord ↔ Tenant lean methodology
- Overall (STATE)
- 90 Strongly Landlord-Friendly
- State Georgia
- 90 Strongly Landlord-Friendly · R+3
- County
- — inherits STATE
- City
- — inherits STATE
ZIP-level market 30213
- Home prices YoY
- -17.7%
- Rents YoY
- 2.5%
- Active inventory
- 546
- Price-to-rent
- 10.1×
Monthly cashflow live
- Estimated rent
- $2,155 high interval (Pro) →
- Mortgage (P&I)
- −$1,363
- Tax from tax record
- −$186 /mo · $2,237/yr
- Insurance
- −$108
- HOA
- −$0
- Vacancy / Maint / Mgmt
- −$453
- Net cashflow
- $45
Break-even live
Sensitivity live
| Price | -10% $192 | -5% $118 | +0% $45 | +5% $-29 | +10% $-102 |
|---|---|---|---|---|---|
| Rent | -10% $-126 | -5% $-40 | +0% $45 | +5% $130 | +10% $215 |
| Rate | -1.0pp $176 | -0.5pp $111 | base $45 | +0.5pp $-23 | +1.0pp $-91 |
UW: 25.0% down · 7.5% · 30yr · 1.5% tax · 5.0% vac · 8.0% maint · 8.0% mgmt
Financing live
Cash to close
- Down payment
- $64,975
- Closing costs
- $7,797
- Reserves months
- —
- Total cash needed
- —
Loan-product check · same deal, 3 products live
Conventional
25% down · 7.5% · 30yr
- Down + closing
- —
- Monthly P&I
- —
- Monthly cashflow
- —
- DSCR
- —
- Eligible?
- —
Personal DTI + credit; lowest rate.
DSCR
20% down · 8.5% · 30yr
- Down + closing
- —
- Monthly P&I
- —
- Monthly cashflow
- —
- DSCR
- —
- Eligible?
- —
No personal income docs; deal must DSCR.
Hard money
10% down · 12.0% · 12mo
- Down + closing
- —
- Monthly P&I
- —
- Monthly cashflow
- —
- DSCR
- —
- Eligible?
- —
Short-term bridge; refi at stabilization.
Rent comps 11 comps
| Address | Beds | Baths | Sqft | Rent | $/sqft | DOM | Units | Dist |
|---|---|---|---|---|---|---|---|---|
| 6460 Lake Esther Dr Fairburn, GA | 4.0 | 3.0 | 1300 | $2,300 | $1.77 | 45d | 1 | 0.49mi |
| 6460 Lake Esther Dr Fairburn, GA | 4.0 | 3.0 | 1300 | $1,997 | $1.54 | 13d | 1 | 0.49mi |
| 152 Rivertown Rd Fairburn, GA | 3.0 | 2.0 | 1550 | $3,500 | $2.26 | 24d | 1 | 1.12mi |
| 200 Dodd St Fairburn, GA | 3.0 | 2.0 | 1300 | $1,685 | $1.30 | 45d | 1 | 1.14mi |
| 220 Splitwood Ln Fairburn, GA | 3.0 | 2.0 | 1424 | $1,850 | $1.30 | 22d | 1 | 1.17mi |
| 220 Splitwood Ln Fairburn, GA | 3.0 | 2.0 | 1424 | $1,850 | $1.30 | 26d | 1 | 1.17mi |
| 220 Splitwood Ln Fairburn, GA | 3.0 | 2.0 | 1424 | $1,850 | $1.30 | 45d | 1 | 1.17mi |
| 220 Splitwood Ln Fairburn, GA | 3.0 | 2.0 | 1424 | $1,850 | $1.30 | 7d | 1 | 1.17mi |
| 365 Elder St Fairburn, GA | 3.0 | 2.5 | 1084 | $1,625 | $1.50 | 26d | 1 | 1.21mi |
| 7305 Village Center Blvd Fairburn, GA | 1.0–3.0 | 1.0–2.0 | 1119 | $1,976 | $1.77 | 0d | 23 | 1.36mi |
| 152 Fairview Dr Fairburn, GA | 3.0 | 2.0 | 1146 | $1,525 | $1.33 | 0d | 1 | 1.45mi |
Listing history 17 events
-
2026-05-31days on market $259,900 Active 187 DOM
-
2025-12-15price $259,900 131-char remark
Show marketing remark (131 chars)
Charming cottage needs modernization. This is a great fixer up property. A good rental or great starter home in a central location.
-
2025-11-26$265,000 New 131-char remark
Show marketing remark (131 chars)
Charming cottage needs modernization. This is a great fixer up property. A good rental or great starter home in a central location.
-
2025-11-19historical $265,000 131-char remark
Show marketing remark (131 chars)
Charming cottage needs modernization. This is a great fixer up property. A good rental or great starter home in a central location.
-
2023-05-17soldstatus $140,000
-
2023-05-16soldstatus $140,000 Sold 16-char remark
Show marketing remark (16 chars)
TENANT OCCUPIED.
-
2023-05-01status Under Contract 16-char remark
Show marketing remark (16 chars)
TENANT OCCUPIED.
-
2023-04-26$146,900 New 16-char remark
Show marketing remark (16 chars)
TENANT OCCUPIED.
-
2016-12-28soldstatus $42,000 Sold
-
2016-12-28soldstatus $42,000 Sold
-
2016-12-21status Under Contract
-
2016-12-21historical Pending
-
2016-12-15price $44,000
-
2016-12-15price $44,000
-
2016-12-07$49,000 Active
-
2016-11-30$49,000 New
-
1997-04-15soldstatus $64,000
ⓘ Source: listings_history table (triggers on properties + properties_extension) + one-shot
backfill from property_details.listing_events for pre-trigger history.
Tax reassessment forecast GA · Resets to sale price
- Current annual tax
- $2,237 · $186/mo
- Projected year-2 tax
- $2,391 · $199/mo
- Expected delta
- +$154/yr (+$13/mo · 6.9%)
ⓘ Screening estimate from a state-policy table — verify with the county assessor before closing.
Climate risk First Street
- Flood 1/10 Low FEMA zone X (unshaded) · 0% chance over 30 yrs
- Wildfire 3/10 Moderate
- Heat 5/10 Major 7 d/yr ≥103°F today · 19 d/yr by 30 yrs out
- Wind 6/10 Major 27% chance of damaging wind over 30 yrs
- Air quality 3/10 Moderate 3 unhealthy d/yr today · 4 by 30 yrs out
Nearby sold comps map
Loading sold comps map…
Walkable amenities ~0.75 mi
Loading nearby amenities…
Taxation est. · year 1
- Rental income
- $25,857
- − Mortgage interest
- −$14,558
- − Property taxes
- −$2,237
- − Insurance
- −$1,300
- − Repairs & maintenance
- −$2,069
- − Management
- −$2,069
- − Depreciation
- −$7,561
- Taxable loss
- −$3,935
- Est. tax savings @ 24.0%
- +$944
- After-tax cash flow
- $1,480/yr
For passive investors: Depreciation is non-cash, so a rental often shows a tax loss while cash-flowing — sheltering income. Rental losses are passive: they offset passive income freely, and up to $25,000/yr can offset ordinary (W-2) income if you actively participate and your MAGI is under $100k (phasing out to $0 by $150k); unused losses carry forward. On sale, claimed depreciation is recaptured at up to 25%, and gains may owe capital-gains tax (a 1031 exchange can defer both). Figures are a year-1 estimate at your 24.0% rate — not tax advice; consult a CPA.
Schools (NCES district)
- District
- Fulton County
- NCES district ID
- 1302280
- Math proficiency
- 49% ▼ -2.00%
- Reading proficiency
- 53% ▬ 0.00%
- Median HH income
- $68,035
- Composite
- 45.33/100
- National rank
- #2640
- State rank
- #12 of 174 in GA
Livability — Fairburn
- Score
- 63/100
- State rank
- #291
- US rank
- #15939
Category grades
Schools grade is shown separately in the Schools card above.
Census & demographics
- Census place
- Fairburn, GA
- County
- Fulton County · 1,094,430 people
- City population
- 50,621
- Metro
- Atlanta-Sandy Springs-Alpharetta, GA
- Population (ZIP)
- 50,621
- Household income
- $94,125
- Rent vs Own
- Severe rent burden
- 1025.0
Population outlook (Fulton County) Hauer SSP2
- Today (2025)
- 1,203,707 people
- By 2030
- 1,299,706 · +8.0%
- By 2040
- 1,488,256 · +23.6%
- By 2050
- 1,664,580 · +38.3%
- By 2075
- 2,036,072 · +69.2%
- By 2100
- 2,222,402 · +84.6%
Race, ethnicity, and origin ACS 2023
- Neighborhood character
- Predominantly Black (86%)
- Race & ethnicity
- Black 86% White 8% Hispanic / Latino 4% Two or more races 3%
- Common ancestry
- Hispanic 1% Arab 1% Lithuanian 0%
- Foreign-born
- 7% · Canada
- Languages at home
- 91% English-only · Spanish 4% French/Haitian/Cajun 2% Arabic 1%
Political lean MEDSL · Fulton
- 2024 margin
- Solid D (+44.9) · D 71.9% · R 27.0% · Other 1.1%
- 2008→2024 swing
- +9.8pp toward D · 2008: 35.0pp · 2024: 44.9pp
- All cycles
- 2024: D+44.9 2020: D+46.4 2016: D+42.1 2012: D+29.6 2008: D+35.0
Not yet ingested
- Civics
- —
Market trends
- HPI YoY
- ▼ -50.66%
- Current HPI
- 235.9372
- Rent YoY
- ▲ 2.53%
- Metro
- Atlanta-Sandy Springs-Alpharetta, GA
- State GDP YoY
- ▲ 2.66%
- F500 in state
- 28
Industry mix (Fortune 500 HQ in GA)
| Industry | F500 HQs | Revenue |
|---|---|---|
| Paper / Packaging | 2 | $29B |
|
||
| Retail | 1 | $160B |
|
||
| Transportation / Logistics | 1 | $91B |
|
||
| Airlines | 1 | $62B |
|
||
| Consumer Goods | 1 | $47B |
|
||
| Utilities | 1 | $25B |
|
||
Price history
+306.1% since first listed16 events — show timeline
- 2025-12-15 Price Changed $259,900 GAMLS
- 2025-11-26 Listed $265,000 GAMLS
- 2025-11-19 Coming Soon $265,000 GAMLS
- 2023-05-17 Sold (Public Records) $140,000 Public Records
- 2023-05-16 Sold (MLS) $140,000 GAMLS
- 2023-05-01 Pending — GAMLS
- 2023-04-26 Listed $146,900 GAMLS
- 2016-12-28 Sold (MLS) $42,000 GAMLS
- 2016-12-28 Sold (MLS) $42,000 FMLS
- 2016-12-21 Pending — GAMLS
- 2016-12-21 Contingent — FMLS
- 2016-12-15 Price Changed $44,000 GAMLS
- 2016-12-15 Price Changed $44,000 FMLS
- 2016-12-07 Listed $49,000 FMLS
- 2016-11-30 Listed $49,000 GAMLS
- 1997-04-15 Sold (Public Records) $64,000 Public Records
Property tax history
+5.4%/yrLatest (2025): $2,237 · +16.2% YoY. Source: county tax records.
Cash-flow waterfall
monthlySold comps — $/sqft
last 12 mo · ≤1 miLoading sold comps…