 🏗️ New Construction
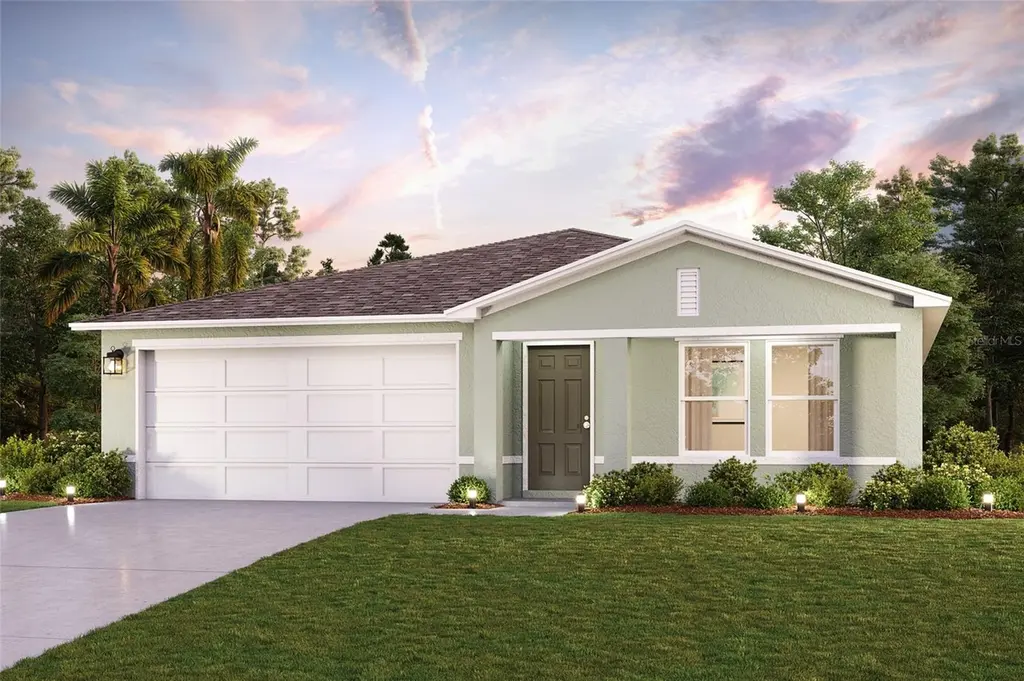
3416 E Rogers · Inverness Highlands North, FL
Flood risk 1/10 · Minimal
- FEMA flood zone
- X (unshaded)
- Chance of flooding over 30 yrs
- 0.0%
- Est. flood insurance / yr
- $507 – $1,088
Fire risk 4/10 · Minor
- Est. fire insurance / yr
- $947 – $1,759
Heat risk 9/10 · Severe
- Hot days now (above 108°F)
- 7 days/yr
- Hot days in 30 yrs
- 21 days/yr
Wind risk 9/10 · Severe
- Chance of severe wind over 30 yrs
- 99.0%
Air-quality risk 1/10 · Minimal
- Unhealthy air days now
- 0 days/yr
- Unhealthy air days in 30 yrs
- 0 days/yr
Risk factors via First Street. Map © Google.
Why this score? — see what drove the F grade
The composite is a weighted blend of 9 inputs, each scored 0–100. Each bar is that input's sub-score; the figure is the points it added to the 100-point composite (weight × sub-score).
- Cash flow +8.2/30.0
- ARV discount +7.5/15.0
- Schools +4.1/10.0
- Livability +3.2/5.0
- 1% rule +2.6/10.0
- Rent growth +2.5/5.0
- Condition / age +2.5/5.0
- DSCR +2.2/10.0
- Appreciation +0.0/10.0
$271,490
🖨 Deal sheet (PDF) 📄 Offer letter ✓ Due diligence
Listing remarks
Under Construction. Step into your new life at this beautifully crafted home in the heart of the Inverness Community! Step into the Quail Ridge Plan in the charming this delightful home features an open living room that flows into a beautifully designed dining area and kitchen, perfect for gatherings. The kitchen is the heart of the house, boasting elegant cabinetry, quartz countertops, and stainless steel appliances, including a range with a microwave and dishwasher. The primary suite includes a private bath with dual vanity sinks and a spacious walk-in closet. Three more inviting bedrooms and a full secondary bath provide ample space. A two-car garage offers plenty of storage, and energy-
Key facts
- Quartz countertops
- Open living room
- Elegant cabinetry
Tags
Property features AI
Finance
- Other: No lease restrictions indicated; Unfurnished; Directions available
Exterior
- Parking: Attached 2-car garage
- Utilities: Public water; Septic sewer; Electricity connected; Water connected; Sewer connected
- Home design: Single family residence; One story; Under construction (projected completion July 29, 2026); Home faces east
- Construction: Block and stucco construction; Shingle roof; Slab foundation; New construction; Builder: CENTURY COMPLETE (model: QUAIL RIDGE-B); Building area about 1,672 (builder source); Lot dimensions approximately 100 x 120 on a 0.28-acre lot
- Exterior features: Exterior lighting; Other exterior features
Interior
- Kitchen: Dishwasher; Microwave; Range
- Bedrooms: 4 bedrooms
- Flooring: Carpet; Vinyl
- Bathrooms: 2 full bathrooms
- Heating & cooling: Central heating; Electric heat pump; Central air conditioning
- Interior features: Open floor plan; Thermostat; Walk-in closet(s); Double-pane, insulated thermal windows
- Laundry & utility: Indoor laundry room; Electric water heater
Neighborhood map
What this means for you Summary
Snapshot
- This is a 4-bed/2.0-bath land listed at $271k.
Deal economics
- At list price, monthly cash flow is $-253 ($-3k/yr) — negative.
- To cash-flow at today's rent, offer at most $235k (13.5% below list).
- To meet the 1% rule (rent ≥ 1% of price), the offer needs to be $206k (24.3% below list).
- Recommended offer: $206k (24.3% below list) — sets the bar for 1% rule.
Location & tenants
- Location reads 65/100 on livability (#643 in FL) — a middle-class / working-renter tenant base. Strengths: crime A+, cost of living A+, housing A+; Watch: health & safety C-, schools F, amenities F.
- Citrus (rural): math 49% / reading 50% proficiency, ranked #44 of 73 in FL (top 60%) — families likely to look elsewhere, expect single-tenant / working-renter base with shorter leases.
- Market conditions: 421 active listings in the ZIP; 6 comparable units currently listed for rent nearby; rentals at typical pace (median 22d on market — plan ~3-4 weeks tenant-placement turnaround); 2,443 units permitted in Citrus County in 2024 (0 in 5+ unit buildings).
- This rent runs 43% of the median local income ($58k/yr) — at the standard rent-burdened threshold; future hikes will face affordability resistance.
Forward outlook
- Local home prices are declining (-3.0%/yr); year-one equity from $2k of loan paydown is wiped out by about $8k of value loss. Plan a longer hold.
- Citrus County population projected to shrink 10% by 2050 — rents likely to lag national; underwrite the cash flow, not the appreciation.
Negotiation context
- It's been on market 71 days — a 6% lower offer ($255k) is reasonable based on typical stale-listing flexibility.
- Current owner paid $14k; list at $271k implies a 1839% gain — meaningful room to come down on a strong offer.
Risks & watch-outs
- Climate carrying-cost: severe wind risk, 99% chance of damaging wind over 30y; extreme-heat days projected 7→21/yr by 2055 (HVAC capex compounding) — expect insurance premiums to compound above CPI over the hold.
Questions for the listing agent
- What do current leases actually rent for vs. the listed asking? Can we see a recent rent roll and the last 12 months of T-12 income?
- It's been on market 71 days. Have you received any prior offers? Is the seller open to a 24% concession, seller financing, or rate buy-down credit?
- Why hasn't it sold? Are there any deal-killer items the seller is aware of (foundation, flood, title, zoning, code violations)?
- Is there a deadline driving the sale (1031 exchange, divorce, estate, relocation)? That informs how much negotiation room exists.
- Schools are F-rated, which usually means shorter tenancies and higher turnover. Who's the typical renter profile here, and what's been the actual vacancy rate?
- The area grade is low — what's the realistic commute time and amenity access for the typical tenant pool here? Any planned neighborhood developments (good or bad) we should know about?
- What's the average days-on-market for RENTAL listings here right now (not sales)? A rising rental-DOM trend means longer vacancies and softer asking-rent achievability than the comps imply.
- What's the recent tenant-quality profile in this submarket — average credit score on applications, eviction rate, late-payment / NSF rate, and stable-employment percentage? A property-management company in the area should have these aggregated.
- How much new for-sale + rental construction is in the pipeline within 1–3 miles? Heavy new supply typically softens prices + rents 12–24 months out; constrained supply supports both.
Investment metrics
- 1% rule
- 0.76% ✗
- Cap rate
- 5.18%
- Cash-on-cash
- -3.99%
- DSCR
- 0.82
- GRM
- 11.0
CMA / ARV
No comps found within radius.
Projected returns pro-forma
-3.0% appreciation · 3.0% rent growth · sell at horizon
- IRR
- -23.0%
- Equity multiple
- 0.21×
- Total profit
- $-60,050
- Equity at exit
- $40,480
- IRR
- -17.5%
- Equity multiple
- 0.04×
- Total profit
- $-72,881
- Equity at exit
- $23,473
Cash invested: $76,017 (down + closing). Projections, not guarantees.
Landlord ↔ Tenant lean methodology
- Overall (STATE)
- 87 Strongly Landlord-Friendly
- State Florida
- 87 Strongly Landlord-Friendly · R+3
- County
- — inherits STATE
- City
- — inherits STATE
ZIP-level market 34453
- Home prices YoY
- -26.1%
- Active inventory
- 421
- Price-to-rent
- 11.0×
Monthly cashflow live
- Estimated rent
- $2,055 high interval (Pro) →
- Mortgage (P&I)
- −$1,424
- Tax est. 1.5%
- −$339 /mo · $4,072/yr
- Insurance
- −$113
- HOA
- −$0
- Vacancy / Maint / Mgmt
- −$432
- Net cashflow
- $-253
Break-even live
Sensitivity live
| Price | -10% $-65 | -5% $-159 | +0% $-253 | +5% $-346 | +10% $-440 |
|---|---|---|---|---|---|
| Rent | -10% $-415 | -5% $-334 | +0% $-253 | +5% $-171 | +10% $-90 |
| Rate | -1.0pp $-116 | -0.5pp $-184 | base $-253 | +0.5pp $-323 | +1.0pp $-395 |
UW: 25.0% down · 7.5% · 30yr · 1.5% tax · 5.0% vac · 8.0% maint · 8.0% mgmt
Financing live
Cash to close
- Down payment
- $67,872
- Closing costs
- $8,145
- Reserves months
- —
- Total cash needed
- —
Loan-product check · same deal, 3 products live
Conventional
25% down · 7.5% · 30yr
- Down + closing
- —
- Monthly P&I
- —
- Monthly cashflow
- —
- DSCR
- —
- Eligible?
- —
Personal DTI + credit; lowest rate.
DSCR
20% down · 8.5% · 30yr
- Down + closing
- —
- Monthly P&I
- —
- Monthly cashflow
- —
- DSCR
- —
- Eligible?
- —
No personal income docs; deal must DSCR.
Hard money
10% down · 12.0% · 12mo
- Down + closing
- —
- Monthly P&I
- —
- Monthly cashflow
- —
- DSCR
- —
- Eligible?
- —
Short-term bridge; refi at stabilization.
Rent comps 6 comps
| Address | Beds | Baths | Sqft | Rent | $/sqft | DOM | Units | Dist |
|---|---|---|---|---|---|---|---|---|
| 3880 E Byrd St Inverness, FL | 3.0 | 2.0 | 1380 | $1,600 | $1.16 | 21d | 1 | 0.49mi |
| 543 N Rooks Ave Inverness, FL | 3.0 | 2.0 | 1296 | $1,900 | $1.47 | 21d | 1 | 0.62mi |
| 167 N Independence Hwy Inverness, FL | 3.0 | 2.0 | 1535 | $1,800 | $1.17 | 21d | 1 | 0.80mi |
| 2858 E Marcia St Inverness, FL | 4.0 | 2.0 | 1790 | $2,500 | $1.40 | 21d | 1 | 1.31mi |
| 815 E Rembrandt Way Unit 424 Inverness, FL | 3.0 | 2.0 | 1262 | $1,850 | $1.47 | 21d | 1 | 1.31mi |
| 2620 E Newhaven St Inverness, FL | 3.0 | 2.0 | 1884 | $2,400 | $1.27 | 21d | 1 | 1.36mi |
Listing history 19 events
-
2026-06-19days on market $271,490 Active 71 DOM
-
2026-06-18days on market $271,490 Active 70 DOM
-
2026-06-17days on market $271,490 Active 69 DOM
-
2026-06-16days on market $271,490 Active 68 DOM
-
2026-06-15days on market $271,490 Active 67 DOM
-
2026-06-14days on market $271,490 Active 65 DOM
-
2026-06-13days on market $271,490 Active 64 DOM
-
2026-06-09days on market $271,490 Active 61 DOM
-
2026-06-08days on market $271,490 Active 60 DOM
-
2026-06-07days on market $271,490 Active 59 DOM
-
2026-06-03days on market $271,490 Active 55 DOM
-
2026-06-02days on market $271,490 Active 54 DOM
-
2026-06-01days on market $271,490 Active 53 DOM
-
2026-05-31days on market $271,490 Active 52 DOM
-
2026-05-30days on market $271,490 Active 51 DOM
-
2026-04-24price $271,490
-
2026-04-09$281,490 Active
-
2025-05-15soldstatus $14,000
-
2025-03-20soldstatus $7,800
ⓘ Source: listings_history table (triggers on properties + properties_extension) + one-shot
backfill from property_details.listing_events for pre-trigger history.
Climate risk First Street
- Flood 1/10 Low FEMA zone X (unshaded) · 0% chance over 30 yrs
- Wildfire 4/10 Moderate
- Heat 9/10 Extreme 7 d/yr ≥108°F today · 21 d/yr by 30 yrs out
- Wind 9/10 Extreme 99% chance of damaging wind over 30 yrs
- Air quality 1/10 Low 0 unhealthy d/yr today · 0 by 30 yrs out
Nearby sold comps map
Loading sold comps map…
Walkable amenities ~0.75 mi
Loading nearby amenities…
Taxation est. · year 1
- Rental income
- $24,662
- − Mortgage interest
- −$15,208
- − Property taxes
- −$4,072
- − Insurance
- −$1,357
- − Repairs & maintenance
- −$1,973
- − Management
- −$1,973
- − Depreciation
- −$7,898
- Taxable loss
- −$7,819
- Est. tax savings @ 24.0%
- +$1,877
- After-tax cash flow
- $-1,155/yr
For passive investors: Depreciation is non-cash, so a rental often shows a tax loss while cash-flowing — sheltering income. Rental losses are passive: they offset passive income freely, and up to $25,000/yr can offset ordinary (W-2) income if you actively participate and your MAGI is under $100k (phasing out to $0 by $150k); unused losses carry forward. On sale, claimed depreciation is recaptured at up to 25%, and gains may owe capital-gains tax (a 1031 exchange can defer both). Figures are a year-1 estimate at your 24.0% rate — not tax advice; consult a CPA.
Schools (NCES district)
- District
- Citrus
- NCES district ID
- 1200270
- Math proficiency
- 49% ▼ -10.00%
- Reading proficiency
- 50% ▼ -6.00%
- Median HH income
- $38,618
- Composite
- 41.28/100
- National rank
- #3519
- State rank
- #44 of 73 in FL
Livability — Inverness Highlands North
- Score
- 65/100
- State rank
- #643
- US rank
- #12713
Category grades
Schools grade is shown separately in the Schools card above.
Census & demographics
- Census place
- Inverness Highlands North, FL
- County
- Citrus County · 111,314 people
- Metro
- Homosassa Springs, FL
- Population (ZIP)
- 10,621
- Household income
- $57,568
- Rent vs Own
- Severe rent burden
- 240.0
Population outlook (Citrus County) Hauer SSP2
- Today (2025)
- 138,622 people
- By 2030
- 136,886 · -1.3%
- By 2040
- 132,009 · -4.8%
- By 2050
- 125,196 · -9.7%
- By 2075
- 108,570 · -21.7%
- By 2100
- 84,454 · -39.1%
Race, ethnicity, and origin ACS 2023
- Neighborhood character
- Predominantly White (87%)
- Race & ethnicity
- White 87% Hispanic / Latino 6% Black 3% Two or more races 3% Asian 2%
- Hispanic origin (detail)
- Puerto Rican 2%
- Common ancestry
- Lithuanian 3% Romanian 3% Italian 3%
- Foreign-born
- 4% · Canada
- Languages at home
- 94% English-only · Spanish 4% Tagalog/Filipino 1% Other Asian/Pacific 0%
Political lean MEDSL · Citrus
- 2024 margin
- Solid R (+45.9) · D 26.8% · R 72.6%
- 2008→2024 swing
- -29.8pp toward R · 2008: -16.1pp · 2024: -45.9pp
- All cycles
- 2024: R+45.9 2020: R+41.0 2016: R+39.7 2012: R+21.9 2008: R+16.1
Not yet ingested
- Civics
- —
Market trends
- HPI YoY
- ▼ -103.32%
- Current HPI
- 291.8965
- Rent YoY
- —
- Metro
- Homosassa Springs, FL
- State GDP YoY
- ▲ 3.28%
- F500 in state
- 36
Industry mix (Fortune 500 HQ in FL)
| Industry | F500 HQs | Revenue |
|---|---|---|
| Industrial Technology | 2 | $29B |
|
||
| Insurance | 2 | $17B |
|
||
| Retail | 1 | $60B |
|
||
| Technology Distribution | 1 | $58B |
|
||
| Homebuilding | 1 | $35B |
|
||
| Technology Manufacturing | 1 | $35B |
|
||
Price history
+3380.6% since first listed4 events — show timeline
- 2026-04-24 Price Changed $271,490 Stellar MLS as Distributed by MLS Grid
- 2026-04-09 Listed $281,490 Stellar MLS as Distributed by MLS Grid
- 2025-05-15 Sold (Public Records) $14,000 Public Records
- 2025-03-20 Sold (Public Records) $7,800 Public Records
Property tax history
+8.5%/yrLatest (2025): $137 · +33.9% YoY. Source: county tax records.
Cash-flow waterfall
monthlySold comps — $/sqft
last 12 mo · ≤1 miLoading sold comps…