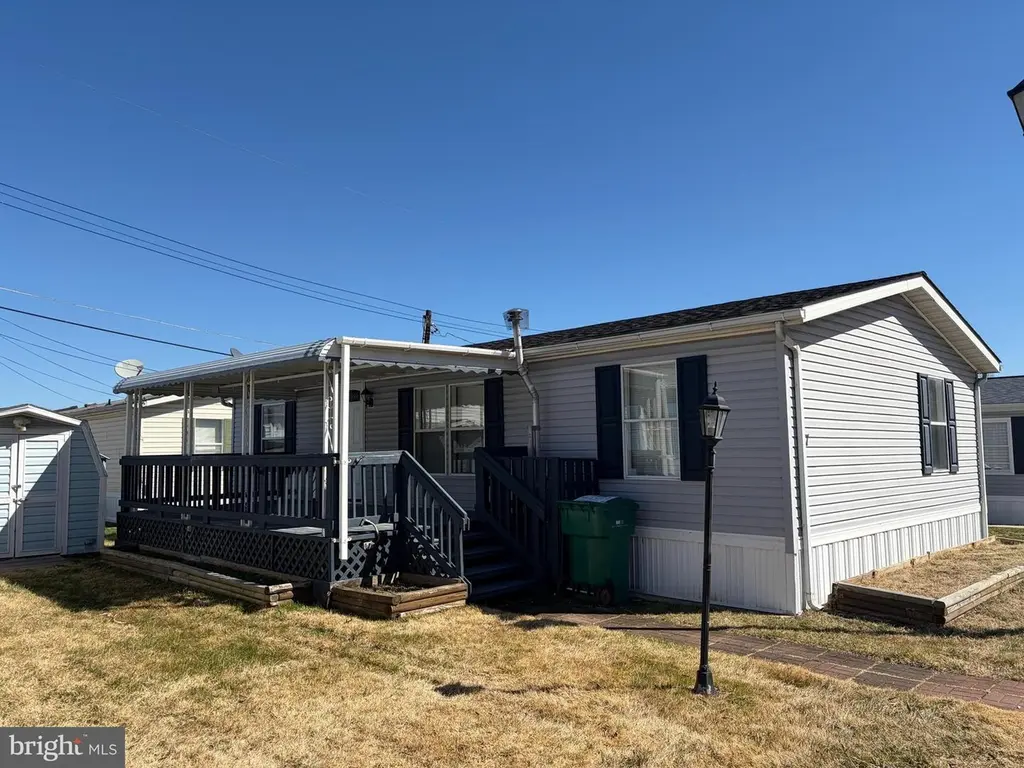
7 Roseview Rd · Dundalk, MD
Flood risk No data
- FEMA flood zone
- —
- Chance of flooding over 30 yrs
- —
- Est. flood insurance / yr
- —
Fire risk No data
- Est. fire insurance / yr
- —
Heat risk No data
- Hot days now (above threshold)
- —
- Hot days in 30 yrs
- —
Wind risk No data
- Chance of severe wind over 30 yrs
- —
Air-quality risk No data
- Unhealthy air days now
- —
- Unhealthy air days in 30 yrs
- —
Risk factors via First Street. Map © Google.
Why this score? — see what drove the C+ grade
The composite is a weighted blend of 9 inputs, each scored 0–100. Each bar is that input's sub-score; the figure is the points it added to the 100-point composite (weight × sub-score).
- Cash flow +30.0/30.0
- 1% rule +10.0/10.0
- DSCR +10.0/10.0
- Livability +4.2/5.0
- Condition / age +4.0/5.0
- Rent growth +2.5/5.0
- Schools +2.3/10.0
- ARV discount +0.0/15.0
- Appreciation +0.0/10.0
$109,900
🖨 Deal sheet 📄 Offer letter ✓ Due diligence
Listing remarks
Exceptional Improvements are Complete in This Remodeled Luxury Home. Enjoy One Level Living with a New Kitchen, New Appliances, New Granite Counters, New Lighting, New Floors New Baths, and New Roof. Present Lot Rent is $840.00 - All Residents Must Be Approved By Community Management
Key facts
- New lighting
- New floors
- New kitchen
Tags
Property features AI
Finance
- HOA & community: Land lease of $800 per month; No remaining land lease years reported
Exterior
- Parking: Driveway parking
- Utilities: Public water; Public sewer; Electric service
- Home design: Manufactured home; Vinyl siding; Above-grade living space only; Estimated year built
- Construction: Vinyl siding construction; Above-grade structure
- Exterior features: Driveway
Interior
- Bedrooms: 3 bedrooms on the main level
- Bathrooms: 2 full bathrooms (both on the main level)
- Heating & cooling: Forced air heating (90%); Wood-burning stove; Electric heating fuel; Central air conditioning (electric); Electric hot water
- Interior features: Estimated living area; No basement; Accessibility features present
Neighborhood map
What this means for you Summary
Snapshot
- This is a 3-bed/2.0-bath single-family listed at $110k. Condition is rated good.
Deal economics
- At list price, monthly cash flow is $865 ($10k/yr) — positive.
- The deal already cash-flows at list — no discount required.
- Meets the 1% rule at list price ($2k rent vs $110k).
- Recommended offer: $107k (3.0% below list) — sets the bar for market timing.
- Cap rate 15.7% vs local median 6.2% in Dundalk — top-decile yield for the area; either an underpriced asset or a hidden risk that comps aren't pricing in. Stress-test before assuming the spread holds.
Location & tenants
- Location reads 85/100 on livability (#16 in MD, #510 nationally) — a professional / high-income tenant draw. Strengths: amenities A+, commute A+, housing A+; Watch: crime F.
- Baltimore County Public Schools (suburban): math 15% / reading 34% proficiency, ranked #11 of 24 in MD (top 46%) — low school quality limits family demand, transient renter base, plan for 1-2y turnover.
- Market conditions: Rents soft (-0.1%/yr); 236 active listings in the ZIP; 21 comparable units currently listed for rent nearby; rentals at typical pace (median 15d on market — plan ~3-4 weeks tenant-placement turnaround); 1,511 units permitted in Baltimore County in 2024 (643 in 5+ unit buildings).
- This rent runs 38% of the median local income ($64k/yr) — at the standard rent-burdened threshold; future hikes will face affordability resistance.
Forward outlook
- Local home prices are declining (-3.0%/yr); year-one equity from $760 of loan paydown is wiped out by about $3k of value loss. Plan a longer hold.
- Baltimore County population projected at +12% by 2050 — modest demand growth; plan on rents tracking national, not racing it.
- At projected returns (-3.0% appreciation + 0.0% rent growth), your $31k cash investment doubles in ~4 years — after that, you're playing with house money.
Negotiation context
- It's been on market 44 days — a 3% lower offer ($107k) is reasonable based on typical stale-listing flexibility.
Questions for the listing agent
- It's been on market 44 days. Have you received any prior offers? Is the seller open to a 3% concession, seller financing, or rate buy-down credit?
- Is there a deadline driving the sale (1031 exchange, divorce, estate, relocation)? That informs how much negotiation room exists.
- Schools are A-rated — typically a magnet for longer-tenancy family renters. What's the average tenant stay here, and is there a school-zone premium baked into asking?
- Crime grade is F in this area — have there been break-ins, vandalism, or insurance claims at this property in the last 3 years? What carrier currently insures it and at what premium?
- What's the average days-on-market for RENTAL listings here right now (not sales)? A rising rental-DOM trend means longer vacancies and softer asking-rent achievability than the comps imply.
- What's the recent tenant-quality profile in this submarket — average credit score on applications, eviction rate, late-payment / NSF rate, and stable-employment percentage? A property-management company in the area should have these aggregated.
- How much new for-sale + rental construction is in the pipeline within 1–3 miles? Heavy new supply typically softens prices + rents 12–24 months out; constrained supply supports both.
Investment metrics
- 1% rule
- 1.87% ✓
- Cap rate
- 15.73%
- Cash-on-cash
- 33.71%
- DSCR
- 2.50
- GRM
- 4.5
CMA / ARV
- ARV (median comp)
- $91,767
- List price
- $109,900
- Delta
- 19.76%
- Verdict
- OVERPRICED
- Comps
- 14 within 1.0 mi
Show comp detail 5 sales within ~0.75 mi
| Address | Dist | Beds/Ba | Sqft | Sold | Price | $/sf | Match |
|---|---|---|---|---|---|---|---|
| 130 Briarwood Rd | 0.03mi | 3/2.0 | 1,144 (+8%) | 11mo | $84,000 | $73 | 76 |
| 211 Robwood Rd | 0.07mi | 2/1.0 (-1) | 962 (-9%) | 10mo | $22,000 | $23 | 65 |
| 3707 North Point Rd | 0.47mi | 2/1.0 (-1) | 1,136 (+8%) | 8mo | $285,000 | $251 | 50 |
| 707 Gregwood Ct | 0.28mi | 2/1.0 (-1) | 902 (-15%) | 9mo | $55,000 | $61 | 46 |
| 7656 Old Battle Grv | 0.54mi | 2/2.0 (-1) | 1,200 (+14%) | 6mo | $275,000 | $229 | 42 |
Match score weights: distance 35% · size 25% · config 20% · recency 20%. Top-matched comps best support the ARV.
Projected returns pro-forma
-3.0% appreciation · 0.0% rent growth · sell at horizon
- IRR
- 25.6%
- Equity multiple
- 2.02×
- Total profit
- $31,260
- Equity at exit
- $16,386
- IRR
- 31.4%
- Equity multiple
- 3.44×
- Total profit
- $74,965
- Equity at exit
- $9,502
Cash invested: $30,772 (down + closing). Projections, not guarantees.
Landlord ↔ Tenant lean methodology
- Overall (STATE)
- 27 Tenant-Leaning
- State Maryland
- 27 Tenant-Leaning · D+14
- County
- — inherits STATE
- City
- — inherits STATE
ZIP-level market 21222
- Rents YoY
- -0.1%
- Active inventory
- 236
- Price-to-rent
- 4.5×
Monthly cashflow live
- Estimated rent
- $2,056 high interval (Pro) →
- Mortgage (P&I)
- −$576
- Tax est. 1.5%
- −$137 /mo · $1,648/yr
- Insurance
- −$46
- HOA
- −$0
- Vacancy / Maint / Mgmt
- −$432
- Net cashflow
- $865
Break-even live
UW: 25.0% down · 7.5% · 30yr · 1.5% tax · 5.0% vac · 8.0% maint · 8.0% mgmt
Financing live
Cash to close
- Down payment
- $27,475
- Closing costs
- $3,297
- Reserves months
- —
- Total cash needed
- —
Loan-product check · same deal, 3 products live
Conventional
25% down · 7.5% · 30yr
- Down + closing
- —
- Monthly P&I
- —
- Monthly cashflow
- —
- DSCR
- —
- Eligible?
- —
Personal DTI + credit; lowest rate.
DSCR
20% down · 8.5% · 30yr
- Down + closing
- —
- Monthly P&I
- —
- Monthly cashflow
- —
- DSCR
- —
- Eligible?
- —
No personal income docs; deal must DSCR.
Hard money
10% down · 12.0% · 12mo
- Down + closing
- —
- Monthly P&I
- —
- Monthly cashflow
- —
- DSCR
- —
- Eligible?
- —
Short-term bridge; refi at stabilization.
Rent comps 21 comps
| Address | Beds | Baths | Sqft | Rent | $/sqft | DOM | Units | Dist |
|---|---|---|---|---|---|---|---|---|
| 3427 North Point Rd Dundalk, MD | 3.0 | 1.0 | 1008 | $2,250 | $2.23 | 19d | 1 | 0.56mi |
| 3317 Belsford Ct Dundalk, MD | 3.0 | 1.0 | 1258 | $1,950 | $1.55 | 10d | 1 | 0.59mi |
| 3413 Wallford Dr Dundalk, MD | 3.0 | 2.0 | 1016 | $2,000 | $1.97 | 43d | 1 | 0.60mi |
| 3314 Wallford Dr Dundalk, MD | 3.0 | 1.0 | 1258 | $1,850 | $1.47 | 14d | 1 | 0.70mi |
| 3221 Wallford Dr Dundalk, MD | 3.0 | 1.0 | 1008 | $1,750 | $1.74 | 3d | 1 | 0.76mi |
| 3221 Wallford Dr Unit 3221 Dundalk, MD | 3.0 | 1.0 | 1008 | $1,750 | $1.74 | 4d | 1 | 0.76mi |
| 4004 Saint Monica Dr Dundalk, MD | 3.0 | 1.0 | 1024 | $1,925 | $1.88 | 4d | 1 | 0.82mi |
| 4004 St Monica Dr Unit 1 Dundalk, MD | 3.0 | 1.0 | 1024 | $1,895 | $1.85 | 4d | 1 | 0.82mi |
| 7412 Saint Patricia Ct Dundalk, MD | 4.0 | 2.0 | 1024 | $2,800 | $2.73 | 17d | 1 | 0.90mi |
| 7860 Saint Claire Ln Dundalk, MD | 3.0 | 2.0 | 1024 | $2,200 | $2.15 | 4d | 1 | 0.90mi |
| 7860 Saint Bridget Ln Dundalk, MD | 4.0 | 1.0 | 1216 | $2,300 | $1.89 | 23d | 1 | 0.93mi |
| 7863 Saint Fabian Ln Dundalk, MD | 3.0 | 2.0 | 1424 | $1,950 | $1.37 | 4d | 1 | 0.99mi |
| 3000 Wallford Dr Dundalk, MD | 1.0–2.0 | 1.0 | 717 | $1,330 | $1.85 | 2d | 35 | 1.00mi |
| 7851 Saint Fabian Ln Dundalk, MD | 3.0 | 1.0 | 1024 | $1,595 | $1.56 | 43d | 1 | 1.01mi |
| 1610 Melbourne Rd Dundalk, MD | 1.0–2.0 | 1.0 | 664 | $1,240 | $1.87 | 12d | 1 | 1.03mi |
| 8146 Del Haven Rd Dundalk, MD | 3.0 | 2.0 | 1424 | $2,700 | $1.90 | 16d | 1 | 1.10mi |
| 7 Robinson Ave Dundalk, MD | 3.0 | 2.0 | 1100 | $2,600 | $2.36 | 43d | 1 | 1.12mi |
| 909 S Marlyn Ave Essex, MD | 2.0–3.0 | 1.0–1.5 | 888 | $1,775 | $2.00 | 4d | 1 | 1.35mi |
| 11 Seabright Ave Dundalk, MD | 3.0 | 1.0 | 948 | $1,874 | $1.98 | 14d | 1 | 1.37mi |
| 951 Bayner Rd Unit 951 Essex, MD | 3.0 | 2.0 | 1152 | $2,200 | $1.91 | 43d | 1 | 1.43mi |
| 414 Westfield Rd Dundalk, MD | 3.0 | 1.0 | 1024 | $2,300 | $2.25 | 43d | 1 | 1.49mi |
Listing history 15 events
-
2026-06-18days on market $109,900 Active 44 DOM
-
2026-06-17remarks 285-char remark
-
2026-06-17days on market $109,900 Active 43 DOM
-
2026-06-16days on market $109,900 Active 42 DOM
-
2026-06-15days on market $109,900 Active 41 DOM
-
2026-06-13days on market $109,900 Active 39 DOM
-
2026-06-09days on market $109,900 Active 35 DOM
-
2026-06-08days on market $109,900 Active 34 DOM
-
2026-06-07days on market $109,900 Active 33 DOM
-
2026-06-04days on market $109,900 Active 30 DOM
-
2026-06-03days on market $109,900 Active 29 DOM
-
2026-06-02days on market $109,900 Active 28 DOM
-
2026-06-01days on market $109,900 Active 27 DOM
-
2026-05-31days on market $109,900 Active 26 DOM
-
2026-05-05$109,900 Active 268-char remark
ⓘ Source: listings_history table (triggers on properties + properties_extension) + one-shot
backfill from property_details.listing_events for pre-trigger history.
Nearby sold comps map
Loading sold comps map…
Walkable amenities ~0.75 mi
Loading nearby amenities…
Taxation est. · year 1
- Rental income
- $24,669
- − Mortgage interest
- −$6,156
- − Property taxes
- −$1,648
- − Insurance
- −$550
- − Repairs & maintenance
- −$1,973
- − Management
- −$1,973
- − Depreciation
- −$3,197
- Taxable income
- $9,170
- Est. tax owed @ 24.0%
- −$2,201
- After-tax cash flow
- $8,173/yr
For passive investors: Depreciation is non-cash, so a rental often shows a tax loss while cash-flowing — sheltering income. Rental losses are passive: they offset passive income freely, and up to $25,000/yr can offset ordinary (W-2) income if you actively participate and your MAGI is under $100k (phasing out to $0 by $150k); unused losses carry forward. On sale, claimed depreciation is recaptured at up to 25%, and gains may owe capital-gains tax (a 1031 exchange can defer both). Figures are a year-1 estimate at your 24.0% rate — not tax advice; consult a CPA.
Condition & rehab AI · 13 photos
This remodeled single-family home offers one-level living with new kitchen, baths, and roof. It is in good condition with minor cosmetic updates needed for optimal resale and rental value.
Value-add opportunities
- Both Painting exterior — Enhances curb appeal and resale value
- Both Landscaping — Improves curb appeal and rental value
- Both Replace light fixtures — Modernizes and improves curb appeal
Renovation cost estimate screening
Value-add ROI direction
- Both Painting exterior — Enhances curb appeal and resale value ↑
- Both Landscaping — Improves curb appeal and rental value ↑
- Both Replace light fixtures — Modernizes and improves curb appeal ↑
ⓘ Cost ranges are severity-bucket heuristics (US national rule-of-thumb). Get contractor quotes + a written scope before underwriting a rehab budget.
Schools (NCES district)
- District
- Baltimore County Public Schools
- NCES district ID
- 2400120
- Math proficiency
- 15% ▼ -16.00%
- Reading proficiency
- 34% ▼ -5.00%
- Median HH income
- $66,746
- Composite
- 23.17/100
- National rank
- #7948
- State rank
- #11 of 24 in MD
Livability — Dundalk
- Score
- 85/100
- State rank
- #16
- US rank
- #510
Category grades
Schools grade is shown separately in the Schools card above.
Census & demographics
- Census place
- Dundalk, MD
- County
- Baltimore County · 769,527 people
- City population
- 59,407
- Metro
- Baltimore-Columbia-Towson, MD
- Population (ZIP)
- 59,407
- Household income
- $64,141
- Rent vs Own
- Severe rent burden
- 2566.0
Population outlook (Baltimore County) Hauer SSP2
- Today (2025)
- 885,518 people
- By 2030
- 909,272 · +2.7%
- By 2040
- 951,547 · +7.5%
- By 2050
- 990,955 · +11.9%
- By 2075
- 1,086,411 · +22.7%
- By 2100
- 1,135,078 · +28.2%
Race, ethnicity, and origin ACS 2023
- Neighborhood character
- Diverse neighborhood (Simpson 0.60)
- Race & ethnicity
- White 59% Black 18% Hispanic / Latino 15% Two or more races 7% Asian 2% Native American 1%
- Hispanic origin (detail)
- Mexican 3% Puerto Rican 2%
- Common ancestry
- Romanian 7% Lithuanian 1% Italian 1%
- Foreign-born
- 9% · Canada
- Languages at home
- 85% English-only · Spanish 11% Other Indo-European 2% Arabic 1%
Political lean MEDSL · Baltimore
- 2024 margin
- Strong D (+24.5) · D 61.0% · R 36.5% · Other 2.5%
- 2008→2024 swing
- +9.9pp toward D · 2008: 14.6pp · 2024: 24.5pp
- All cycles
- 2024: D+24.5 2020: D+27.0 2016: D+17.4 2012: D+16.4 2008: D+14.6
Not yet ingested
- Civics
- —
Market trends
- HPI YoY
- ▼ -251.44%
- Current HPI
- 228.4218
- Rent YoY
- ▼ -0.09%
- Metro
- Baltimore-Columbia-Towson, MD
- State GDP YoY
- ▲ 2.97%
- F500 in state
- 12
Industry mix (Fortune 500 HQ in MD)
| Industry | F500 HQs | Revenue |
|---|---|---|
| Aerospace / Defense | 1 | $71B |
|
||
| Utilities | 1 | $25B |
|
||
| Hotels | 1 | $24B |
|
||
| Consumer Goods | 1 | $7B |
|
||
| Real Estate | 1 | $6B |
|
||
| Chemicals | 1 | $2B |
|
||
Price history
1 event — show timeline
- 2026-05-05 Listed $109,900 BRIGHT MLS
Cash-flow waterfall
monthlySold comps — $/sqft
last 12 mo · ≤1 miLoading sold comps…