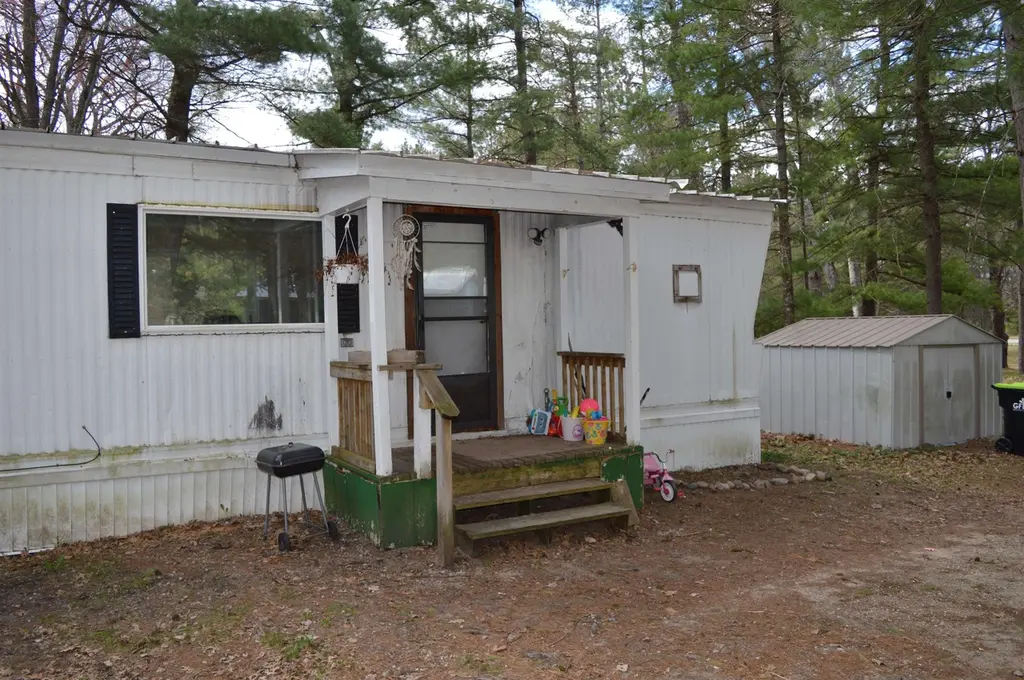
12575 M-72 · Bear Lake, MI
Flood risk 1/10 · Minimal
- FEMA flood zone
- —
- Chance of flooding over 30 yrs
- 0.0%
- Est. flood insurance / yr
- —
Fire risk 3/10 · Minor
- Est. fire insurance / yr
- $784 – $1,456
Heat risk 1/10 · Minimal
- Hot days now (above 92°F)
- 7 days/yr
- Hot days in 30 yrs
- 13 days/yr
Wind risk 1/10 · Minimal
- Chance of severe wind over 30 yrs
- —
Air-quality risk 2/10 · Minimal
- Unhealthy air days now
- 0 days/yr
- Unhealthy air days in 30 yrs
- 1 days/yr
Risk factors via First Street. Map © Google.
Why this score? — see what drove the B grade
The composite is a weighted blend of 9 inputs, each scored 0–100. Each bar is that input's sub-score; the figure is the points it added to the 100-point composite (weight × sub-score).
- Cash flow +30.0/30.0
- ARV discount +15.0/15.0
- DSCR +10.0/10.0
- 1% rule +7.9/10.0
- Livability +3.3/5.0
- Schools +2.6/10.0
- Rent growth +2.5/5.0
- Condition / age +2.5/5.0
- Appreciation +0.0/10.0
$90,000
🖨 Deal sheet (PDF) 📄 Offer letter ✓ Due diligence
Listing remarks
Escape to northern Michigan recreation at its best with this 2-bedroom, 1-bath getaway. Perfectly situated near Bear Lake and Cub Lake, this property offers easy access to thousands of acres of state land, ORV and snowmobile trails, hunting, fishing, hiking, and year-round outdoor adventure. Inside, youll find a cozy and inviting layout ideal for weekend retreats, full-time living, or an income-producing rental property. Gather around the fire pit under the stars, and take advantage of the storage shed for all your recreational gear and tools.
Key facts
- Orv trails
- Snowmobile trails
- Hunting
Tags
Property features AI
Finance
- Other: Located in the VI-NORA ACRES subdivision
Exterior
- Utilities: Private well water; Septic tank
- Home design: Single-family residence; One story
- Construction: Aluminum siding; Pillar/post/pier foundation; Built on a 0.43-acre lot (approx.)
- Exterior features: Covered porch; Shed on property; Wooded lot
Interior
- Kitchen: Oven; Range; Refrigerator
- Bathrooms: 1 full bathroom
- Heating & cooling: Forced air heating; Propane heating; No central cooling
- Interior features: Bay windows; 5 total rooms
Neighborhood map
What this means for you Summary
Snapshot
- This is a 2-bed/1.0-bath single-family listed at $90k.
Deal economics
- At list price, monthly cash flow is $370 ($4k/yr) — positive.
- The deal already cash-flows at list — no discount required.
- Meets the 1% rule at list price ($1k rent vs $90k).
- Recommended offer: $87k (3.0% below list) — sets the bar for market timing.
- Cap rate 11.2% vs local median 2.7% in Bear Lake — top-decile yield for the area; either an underpriced asset or a hidden risk that comps aren't pricing in. Stress-test before assuming the spread holds.
Location & tenants
- Location reads 66/100 on livability (#425 in MI) — a middle-class / working-renter tenant base. Strengths: cost of living A+, housing A+; Watch: employment D, crime D-, amenities F.
- Kalkaska Public Schools (town): math 24% / reading 38% proficiency, ranked #356 of 540 in MI (top 66%) — families likely to look elsewhere, expect single-tenant / working-renter base with shorter leases.
- Zoned schools: Birch Street Elementary School (math 37% / reading 32%, grade F, #744 of 1,397 statewide, top 57%, 354 students, 72% FRL); Kalkaska Middle School (math 19% / reading 37%, grade F, #359 of 493 statewide, top 73%, 304 students, 66% FRL); Kalkaska High School (math 32% / reading 52%, grade F, #264 of 713 statewide, top 41%, 449 students, 62% FRL).
- Market conditions: 168 active listings in the ZIP; 38 units permitted in Kalkaska County in 2024 (0 in 5+ unit buildings).
Forward outlook
- Local home prices are declining (-3.0%/yr); year-one equity from $622 of loan paydown is wiped out by about $3k of value loss. Plan a longer hold.
- Kalkaska County population projected to shrink 9% by 2050 — rents likely to lag national; underwrite the cash flow, not the appreciation.
- At projected returns (-3.0% appreciation + 3.0% rent growth), your $25k cash investment doubles in ~7 years — after that, you're playing with house money.
Negotiation context
- It's been on market 44 days — a 3% lower offer ($87k) is reasonable based on typical stale-listing flexibility.
Questions for the listing agent
- It's been on market 44 days. Have you received any prior offers? Is the seller open to a 3% concession, seller financing, or rate buy-down credit?
- Built in 1970 — when were the roof, HVAC, electrical panel, plumbing, and water heater last replaced?
- Is there a deadline driving the sale (1031 exchange, divorce, estate, relocation)? That informs how much negotiation room exists.
- Schools are D-rated, which usually means shorter tenancies and higher turnover. Who's the typical renter profile here, and what's been the actual vacancy rate?
- Crime grade is D in this area — have there been break-ins, vandalism, or insurance claims at this property in the last 3 years? What carrier currently insures it and at what premium?
- What's the average days-on-market for RENTAL listings here right now (not sales)? A rising rental-DOM trend means longer vacancies and softer asking-rent achievability than the comps imply.
- What's the recent tenant-quality profile in this submarket — average credit score on applications, eviction rate, late-payment / NSF rate, and stable-employment percentage? A property-management company in the area should have these aggregated.
- How much new for-sale + rental construction is in the pipeline within 1–3 miles? Heavy new supply typically softens prices + rents 12–24 months out; constrained supply supports both.
Investment metrics
- 1% rule
- 1.29% ✓
- Cap rate
- 11.23%
- Cash-on-cash
- 17.62%
- DSCR
- 1.78
- GRM
- 6.5
CMA / ARV
- ARV (median comp)
- $155,042
- List price
- $90,000
- Delta
- -41.95%
- Verdict
- UNDERPRICED
- Comps
- 6 within 2.0 mi
Projected returns pro-forma
-3.0% appreciation · 3.0% rent growth · sell at horizon
- IRR
- 9.0%
- Equity multiple
- 1.36×
- Total profit
- $8,960
- Equity at exit
- $13,419
- IRR
- 18.2%
- Equity multiple
- 2.51×
- Total profit
- $38,041
- Equity at exit
- $7,782
Cash invested: $25,200 (down + closing). Projections, not guarantees.
Landlord ↔ Tenant lean methodology
- Overall (STATE)
- 62 Landlord-Friendly
- State Michigan
- 62 Landlord-Friendly · EVEN
- County
- — inherits STATE
- City
- — inherits STATE
ZIP-level market 49646
- Active inventory
- 168
- Price-to-rent
- 6.5×
Monthly cashflow live
- Estimated rent
- $1,162 medium interval (Pro) →
- Mortgage (P&I)
- −$472
- Tax from tax record
- −$38 /mo · $458/yr
- Insurance
- −$38
- HOA
- −$0
- Vacancy / Maint / Mgmt
- −$244
- Net cashflow
- $370
Break-even live
Sensitivity live
| Price | -10% $421 | -5% $396 | +0% $370 | +5% $345 | +10% $319 |
|---|---|---|---|---|---|
| Rent | -10% $278 | -5% $324 | +0% $370 | +5% $416 | +10% $462 |
| Rate | -1.0pp $415 | -0.5pp $393 | base $370 | +0.5pp $347 | +1.0pp $323 |
UW: 25.0% down · 7.5% · 30yr · 1.5% tax · 5.0% vac · 8.0% maint · 8.0% mgmt
Financing live
Cash to close
- Down payment
- $22,500
- Closing costs
- $2,700
- Reserves months
- —
- Total cash needed
- —
Loan-product check · same deal, 3 products live
Conventional
25% down · 7.5% · 30yr
- Down + closing
- —
- Monthly P&I
- —
- Monthly cashflow
- —
- DSCR
- —
- Eligible?
- —
Personal DTI + credit; lowest rate.
DSCR
20% down · 8.5% · 30yr
- Down + closing
- —
- Monthly P&I
- —
- Monthly cashflow
- —
- DSCR
- —
- Eligible?
- —
No personal income docs; deal must DSCR.
Hard money
10% down · 12.0% · 12mo
- Down + closing
- —
- Monthly P&I
- —
- Monthly cashflow
- —
- DSCR
- —
- Eligible?
- —
Short-term bridge; refi at stabilization.
Listing history 18 events
-
2026-06-21days on market $90,000 Active 44 DOM
-
2026-06-21days on market $90,000 Active 43 DOM
-
2026-06-18days on market $90,000 Active 41 DOM
-
2026-06-17days on market $90,000 Active 40 DOM
-
2026-06-16days on market $90,000 Active 39 DOM
-
2026-06-15days on market $90,000 Active 38 DOM
-
2026-06-13days on market $90,000 Active 36 DOM
-
2026-06-12days on market $90,000 Active 35 DOM
-
2026-06-09days on market $90,000 Active 32 DOM
-
2026-06-08days on market $90,000 Active 31 DOM
-
2026-06-07days on market $90,000 Active 30 DOM
-
2026-06-07days on market $90,000 Active 29 DOM
-
2026-06-04days on market $90,000 Active 26 DOM
-
2026-06-02days on market $90,000 Active 25 DOM
-
2026-06-01days on market $90,000 Active 24 DOM
-
2026-05-31days on market $90,000 Active 23 DOM
-
2026-05-31days on market $90,000 Active 22 DOM
-
2026-05-08$90,000 Active 549-char remark
ⓘ Source: listings_history table (triggers on properties + properties_extension) + one-shot
backfill from property_details.listing_events for pre-trigger history.
Tax reassessment forecast MI · Partial reset (capped growth)
- Current annual tax
- $458 · $38/mo
- Projected year-2 tax
- $922 · $77/mo
- Expected delta
- +$464/yr (+$39/mo · 101.5%)
ⓘ Screening estimate from a state-policy table — verify with the county assessor before closing.
Climate risk First Street
- Flood 1/10 Low 0% chance over 30 yrs
- Wildfire 3/10 Moderate
- Heat 1/10 Low 7 d/yr ≥92°F today · 13 d/yr by 30 yrs out
- Wind 1/10 Low
- Air quality 2/10 Low 0 unhealthy d/yr today · 1 by 30 yrs out
Nearby sold comps map
Loading sold comps map…
Walkable amenities ~0.75 mi
Loading nearby amenities…
Taxation est. · year 1
- Rental income
- $13,940
- − Mortgage interest
- −$5,041
- − Property taxes
- −$458
- − Insurance
- −$450
- − Repairs & maintenance
- −$1,115
- − Management
- −$1,115
- − Depreciation
- −$2,618
- Taxable income
- $3,142
- Est. tax owed @ 24.0%
- −$754
- After-tax cash flow
- $3,687/yr
For passive investors: Depreciation is non-cash, so a rental often shows a tax loss while cash-flowing — sheltering income. Rental losses are passive: they offset passive income freely, and up to $25,000/yr can offset ordinary (W-2) income if you actively participate and your MAGI is under $100k (phasing out to $0 by $150k); unused losses carry forward. On sale, claimed depreciation is recaptured at up to 25%, and gains may owe capital-gains tax (a 1031 exchange can defer both). Figures are a year-1 estimate at your 24.0% rate — not tax advice; consult a CPA.
Schools (NCES district)
- District
- Kalkaska Public Schools
- NCES district ID
- 2620050
- Math proficiency
- 24% ▼ -8.00%
- Reading proficiency
- 38% ▬ 0.00%
- Median HH income
- $40,055
- Composite
- 26.03/100
- National rank
- #7308
- State rank
- #356 of 540 in MI
Livability — Bear Lake
- Score
- 66/100
- State rank
- #425
- US rank
- #11571
Category grades
Schools grade is shown separately in the Schools card above.
Census & demographics
- Population (ZIP)
- 8,573
Population outlook (Kalkaska County) Hauer SSP2
- Today (2025)
- 17,359 people
- By 2030
- 17,222 · -0.8%
- By 2040
- 16,643 · -4.1%
- By 2050
- 15,810 · -8.9%
- By 2075
- 13,772 · -20.7%
- By 2100
- 10,976 · -36.8%
Race, ethnicity, and origin ACS 2023
- Neighborhood character
- Predominantly White (91%)
- Race & ethnicity
- White 91% Two or more races 4% Hispanic / Latino 3%
- Common ancestry
- Romanian 6% Lithuanian 3% Iranian 3%
- Foreign-born
- 1% · Canada
- Languages at home
- 97% English-only · Spanish 2% Other Indo-European 1%
Political lean MEDSL · Kalkaska
- 2024 margin
- Solid R (+42.9) · D 27.8% · R 70.7% · Other 1.5%
- 2008→2024 swing
- -34.1pp toward R · 2008: -8.8pp · 2024: -42.9pp
- All cycles
- 2024: R+42.9 2020: R+41.7 2016: R+44.1 2012: R+19.7 2008: R+8.8
Not yet ingested
- Civics
- —
Market trends
- HPI YoY
- ▼ -158.61%
- Current HPI
- 290.8403
- Rent YoY
- —
- Metro
- —
- State GDP YoY
- ▲ 1.37%
- F500 in state
- 28
Industry mix (Fortune 500 HQ in MI)
| Industry | F500 HQs | Revenue |
|---|---|---|
| Automotive Parts | 3 | $48B |
|
||
| Automotive | 2 | $372B |
|
||
| Chemicals | 1 | $45B |
|
||
| Automotive Retail | 1 | $29B |
|
||
| Healthcare / Medical Devices | 1 | $23B |
|
||
| Automotive Technology | 1 | $20B |
|
||
Price history
1 event — show timeline
- 2026-05-08 Listed $90,000 REALCOMP
Property tax history
+1.5%/yrLatest (2025): $458 · +1.9% YoY. Source: county tax records.
Cash-flow waterfall
monthlySold comps — $/sqft
last 12 mo · ≤1 miLoading sold comps…