2217 Knights Rd · Winter Haven, FL
Flood risk 1/10 · Minimal
- FEMA flood zone
- X (unshaded)
- Chance of flooding over 30 yrs
- 0.0%
- Est. flood insurance / yr
- $507 – $1,088
Fire risk 3/10 · Minor
- Est. fire insurance / yr
- $947 – $1,759
Heat risk 8/10 · Major
- Hot days now (above 107°F)
- 7 days/yr
- Hot days in 30 yrs
- 23 days/yr
Wind risk 9/10 · Severe
- Chance of severe wind over 30 yrs
- 99.0%
Air-quality risk 2/10 · Minimal
- Unhealthy air days now
- 2 days/yr
- Unhealthy air days in 30 yrs
- 2 days/yr
Risk factors via First Street. Map © Google.
Why this score? — see what drove the B- grade
The composite is a weighted blend of 9 inputs, each scored 0–100. Each bar is that input's sub-score; the figure is the points it added to the 100-point composite (weight × sub-score).
- Cash flow +28.4/30.0
- 1% rule +10.0/10.0
- DSCR +10.0/10.0
- ARV discount +7.5/15.0
- Livability +3.7/5.0
- Schools +3.5/10.0
- Rent growth +3.1/5.0
- Condition / age +2.5/5.0
- Appreciation +0.0/10.0
$102,000
🖨 Deal sheet (PDF) 📄 Offer letter ✓ Due diligence
Listing remarks
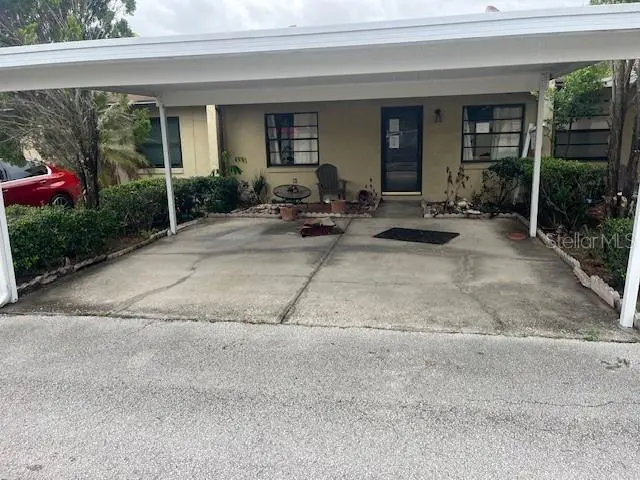
Amazing potential. This 2-bedroom, 2-bathroom townhouse features a spacious 1,252 square foot floor plan and is located in the established Stonebridge community.
Key facts
- $137 HOA
- 2 parking spots
- Community pool
Property features AI
Finance
- Other: Total acreage approximately 0.07 acres
- Financial info: Lease restrictions apply
- HOA & community: HOA managed by Garrison Property Services; Monthly HOA fee of $137 covering pool and grounds maintenance; Deed restrictions; Community pool; Cats and dogs allowed
Exterior
- Parking: Covered parking; 2-space carport
- Utilities: Public water; Public sewer; Cable available; Electricity available
- Home design: Residential townhouse; One level; West-facing
- Construction: Block and stucco construction; Shingle roof; Slab foundation; Built as part of building number 2217
- Exterior features: Other exterior features; Paved road access
Interior
- Kitchen: Other appliances
- Bedrooms: 2 bedrooms
- Flooring: Carpet; Other flooring
- Bathrooms: 2 full bathrooms
- Heating & cooling: Central heating; Central air conditioning
- Interior features: Other interior features
- Laundry & utility: Inside laundry
Neighborhood map
What this means for you Summary
Snapshot
- This is a 2-bed/2.0-bath single-family listed at $102k.
Deal economics
- At list price, monthly cash flow is $331 ($4k/yr) — positive.
- The deal already cash-flows at list — no discount required.
- Meets the 1% rule at list price ($2k rent vs $102k).
- Recommended offer: $100k (1.5% below list) — sets the bar for market timing.
Location & tenants
- Location reads 74/100 on livability (#291 in FL, #4,898 nationally) — a middle-class / working-renter tenant base. Strengths: cost of living A+, housing A+, health & safety A; Watch: schools C-, employment C-, amenities F.
- Polk (suburban): math 39% / reading 43% proficiency, ranked #62 of 73 in FL (top 85%) — families likely to look elsewhere, expect single-tenant / working-renter base with shorter leases.
- Market conditions: Rents rising (+2.5%/yr); 341 active listings in the ZIP; 26 comparable units currently listed for rent nearby; rentals at typical pace (median 25d on market — plan ~3-4 weeks tenant-placement turnaround); 10,384 units permitted in Polk County in 2024 (1,716 in 5+ unit buildings).
- This rent runs 34% of the median local income ($56k/yr) — at the standard rent-burdened threshold; future hikes will face affordability resistance.
Forward outlook
- Local home prices are declining (-3.0%/yr); year-one equity from $705 of loan paydown is wiped out by about $3k of value loss. Plan a longer hold.
- Polk County population projected at +33% by 2050 — long-run rental-demand tailwind backs the buy-and-hold thesis.
- At projected returns (-3.0% appreciation + 2.5% rent growth), your $29k cash investment doubles in ~9 years — after that, you're playing with house money.
Negotiation context
- It's been on market 28 days — a 2% lower offer ($100k) is reasonable based on typical stale-listing flexibility.
- Current owner paid $43k; list at $102k implies a 138% gain — meaningful room to come down on a strong offer.
Risks & watch-outs
- Watch-outs: property tax is 2.6% of price.
- Climate carrying-cost: severe wind risk, 99% chance of damaging wind over 30y; extreme-heat days projected 7→23/yr by 2055 (HVAC capex compounding) — expect insurance premiums to compound above CPI over the hold.
Questions for the listing agent
- Property tax is high relative to price — has the assessment been appealed recently, and will the sale trigger a re-assessment?
- What does the HOA fee cover, when was the last increase, and are there any pending special assessments or reserve-fund shortfalls?
- Is there a deadline driving the sale (1031 exchange, divorce, estate, relocation)? That informs how much negotiation room exists.
- What's the average days-on-market for RENTAL listings here right now (not sales)? A rising rental-DOM trend means longer vacancies and softer asking-rent achievability than the comps imply.
- What's the recent tenant-quality profile in this submarket — average credit score on applications, eviction rate, late-payment / NSF rate, and stable-employment percentage? A property-management company in the area should have these aggregated.
- How much new for-sale + rental construction is in the pipeline within 1–3 miles? Heavy new supply typically softens prices + rents 12–24 months out; constrained supply supports both.
Investment metrics
- 1% rule
- 1.57% ✓
- Cap rate
- 10.19%
- Cash-on-cash
- 13.91%
- DSCR
- 1.62
- GRM
- 5.3
CMA / ARV
No comps found within radius.
Projected returns pro-forma
-3.0% appreciation · 2.47% rent growth · sell at horizon
- IRR
- 3.5%
- Equity multiple
- 1.14×
- Total profit
- $3,871
- Equity at exit
- $15,209
- IRR
- 12.6%
- Equity multiple
- 1.97×
- Total profit
- $27,741
- Equity at exit
- $8,819
Cash invested: $28,560 (down + closing). Projections, not guarantees.
Landlord ↔ Tenant lean methodology
- Overall (STATE)
- 87 Strongly Landlord-Friendly
- State Florida
- 87 Strongly Landlord-Friendly · R+3
- County
- — inherits STATE
- City
- — inherits STATE
ZIP-level market 33880
- Home prices YoY
- -16.2%
- Rents YoY
- 2.5%
- Active inventory
- 341
- Price-to-rent
- 5.3×
Monthly cashflow live
- Estimated rent
- $1,599 high interval (Pro) →
- Mortgage (P&I)
- −$535
- Tax from tax record
- −$218 /mo · $2,616/yr
- Insurance
- −$42
- HOA
- −$137
- Vacancy / Maint / Mgmt
- −$336
- Net cashflow
- $331
Break-even live
Sensitivity live
| Price | -10% $389 | -5% $360 | +0% $331 | +5% $302 | +10% $273 |
|---|---|---|---|---|---|
| Rent | -10% $205 | -5% $268 | +0% $331 | +5% $394 | +10% $457 |
| Rate | -1.0pp $382 | -0.5pp $357 | base $331 | +0.5pp $305 | +1.0pp $278 |
UW: 25.0% down · 7.5% · 30yr · 1.5% tax · 5.0% vac · 8.0% maint · 8.0% mgmt
Financing live
Cash to close
- Down payment
- $25,500
- Closing costs
- $3,060
- Reserves months
- —
- Total cash needed
- —
Loan-product check · same deal, 3 products live
Conventional
25% down · 7.5% · 30yr
- Down + closing
- —
- Monthly P&I
- —
- Monthly cashflow
- —
- DSCR
- —
- Eligible?
- —
Personal DTI + credit; lowest rate.
DSCR
20% down · 8.5% · 30yr
- Down + closing
- —
- Monthly P&I
- —
- Monthly cashflow
- —
- DSCR
- —
- Eligible?
- —
No personal income docs; deal must DSCR.
Hard money
10% down · 12.0% · 12mo
- Down + closing
- —
- Monthly P&I
- —
- Monthly cashflow
- —
- DSCR
- —
- Eligible?
- —
Short-term bridge; refi at stabilization.
Rent comps 26 comps
| Address | Beds | Baths | Sqft | Rent | $/sqft | DOM | Units | Dist |
|---|---|---|---|---|---|---|---|---|
| 1935 Avenue O SW Unit 201 Winter Haven, FL | 2.0 | 2.0 | 1015 | $1,400 | $1.38 | 20d | 1 | 0.21mi |
| 1874 Avenue Q SW Winter Haven, FL | 2.0 | 1.5 | 995 | $1,250 | $1.26 | 4d | 1 | 0.38mi |
| 1870 Avenue Q SW Winter Haven, FL | 2.0 | 1.5 | 960 | $1,199 | $1.25 | 4d | 1 | 0.38mi |
| 1625 Wallace Manor Blvd Winter Haven, FL | 3.0 | 2.0 | 1700 | $1,850 | $1.09 | 24d | 1 | 0.38mi |
| 1860 Avenue Q SW Winter Haven, FL | 2.0 | 1.5 | 995 | $1,199 | $1.21 | 20d | 1 | 0.38mi |
| 1304 15th St SW Winter Haven, FL | 3.0 | 1.0 | 900 | $1,750 | $1.94 | 24d | 1 | 0.47mi |
| 310 Mayfair Pl SW Winter Haven, FL | 2.0 | 2.0 | 1240 | $1,525 | $1.23 | 24d | 1 | 0.52mi |
| 102 Landings Way Winter Haven, FL | 1.0–2.0 | 1.0–2.0 | 738 | $1,385 | $1.88 | 4d | 9 | 0.62mi |
| 2214 Avenue B SW Winter Haven, FL | 3.0 | 2.0 | 1336 | $1,775 | $1.33 | 24d | 1 | 0.72mi |
| 265 25th St SW Unit B Winter Haven, FL | 2.0 | 1.0 | 880 | $1,200 | $1.36 | 24d | 1 | 0.75mi |
| 2416 Avenue B SW Winter Haven, FL | 3.0 | 2.0 | 1373 | $2,000 | $1.46 | 24d | 1 | 0.75mi |
| 1300 S Lake Howard Dr Winter Haven, FL | 1.0–3.0 | 1.5–2.0 | 1464 | $1,788 | $1.22 | 11d | 20 | 0.77mi |
| 2414 Avenue A Ter NW Winter Haven, FL | 3.0 | 2.0 | 1456 | $1,900 | $1.30 | 15d | 1 | 0.98mi |
| 760 Avenue C SW Unit 104 Winter Haven, FL | 3.0 | 3.0 | 1523 | $1,750 | $1.15 | 24d | 1 | 1.04mi |
| 333 Lake Howard Dr NW Unit 312C Winter Haven, FL | 2.0 | 2.0 | 1030 | $1,425 | $1.38 | 24d | 1 | 1.08mi |
| 604 Patrick Ave Winter Haven, FL | 3.0 | 1.0 | 1170 | $1,850 | $1.58 | 4d | 1 | 1.08mi |
| 502 Glad Rd Winter Haven, FL | 3.0 | 2.0 | 1340 | $1,815 | $1.35 | 15d | 1 | 1.10mi |
| 701 Bates Ave SW Unit 101 Winter Haven, FL | 3.0 | 1.0 | 1000 | $1,600 | $1.60 | 24d | 1 | 1.13mi |
| 701 Bates Ave SW Unit 102 Winter Haven, FL | 3.0 | 2.0 | 1100 | $1,700 | $1.55 | 24d | 1 | 1.13mi |
| 701 Bates Ave SW Unit 203 Winter Haven, FL | 3.0 | 2.0 | 1100 | $1,700 | $1.55 | 4d | 1 | 1.13mi |
| 506 Holt Cir Winter Haven, FL | 3.0 | 2.0 | 1032 | $1,675 | $1.62 | 4d | 1 | 1.24mi |
| 309 Vaniman Ave Winter Haven, FL | 3.0 | 1.0 | 1089 | $1,610 | $1.48 | 24d | 1 | 1.34mi |
| 265 East St Winter Haven, FL | 2.0 | 1.0–2.0 | 757 | $2,250 | $2.97 | 3d | 41 | 1.34mi |
| 2014 S Lake Cannon Dr NW Winter Haven, FL | 3.0 | 2.0 | 1403 | $2,350 | $1.67 | 24d | 1 | 1.41mi |
| 200 Avenue C SW Winter Haven, FL | 1.0–2.0 | 1.0–2.0 | 851 | $1,950 | $2.29 | 4d | 12 | 1.44mi |
| 240 2nd St SW #201 Winter Haven, FL | 2.0 | 2.0 | 1241 | $1,725 | $1.39 | 24d | 1 | 1.49mi |
HOA detail
- Monthly dues
- $137 · $1,644/yr
Listing history 18 events
-
2026-06-18days on market $102,000 Active 28 DOM
-
2026-06-17days on market $102,000 Active 27 DOM
-
2026-06-16days on market $102,000 Active 26 DOM
-
2026-06-15days on market $102,000 Active 25 DOM
-
2026-06-13days on market $102,000 Active 23 DOM
-
2026-06-10days on market $102,000 Active 20 DOM
-
2026-06-09days on market $102,000 Active 19 DOM
-
2026-06-08days on market $102,000 Active 18 DOM
-
2026-06-07days on market $102,000 Active 17 DOM
-
2026-06-05days on market $102,000 Active 14 DOM
-
2026-06-03days on market $102,000 Active 13 DOM
-
2026-06-03days on market $102,000 Active 12 DOM
-
2026-06-01days on market $102,000 Active 11 DOM
-
2026-05-31days on market $102,000 Active 10 DOM
-
2026-05-21$102,000 Active
-
1998-10-28soldstatus $42,900
-
1996-03-21soldstatus $24,300
-
1995-10-10soldstatus $440,000
ⓘ Source: listings_history table (triggers on properties + properties_extension) + one-shot
backfill from property_details.listing_events for pre-trigger history.
Tax reassessment forecast FL · Resets to sale price
- Current annual tax
- $2,616 · $218/mo
- Projected year-2 tax
- $2,616 · $218/mo
- Expected delta
- $0/yr ($0/mo · 0.0%)
ⓘ Screening estimate from a state-policy table — verify with the county assessor before closing.
Climate risk First Street
- Flood 1/10 Low FEMA zone X (unshaded) · 0% chance over 30 yrs
- Wildfire 3/10 Moderate
- Heat 8/10 Severe 7 d/yr ≥107°F today · 23 d/yr by 30 yrs out
- Wind 9/10 Extreme 99% chance of damaging wind over 30 yrs
- Air quality 2/10 Low 2 unhealthy d/yr today · 2 by 30 yrs out
Nearby sold comps map
Loading sold comps map…
Walkable amenities ~0.75 mi
Loading nearby amenities…
Taxation est. · year 1
- Rental income
- $19,191
- − Mortgage interest
- −$5,714
- − Property taxes
- −$2,616
- − Insurance
- −$510
- − Repairs & maintenance
- −$1,535
- − Management
- −$1,535
- − HOA
- −$1,644
- − Depreciation
- −$2,967
- Taxable income
- $2,670
- Est. tax owed @ 24.0%
- −$641
- After-tax cash flow
- $3,332/yr
For passive investors: Depreciation is non-cash, so a rental often shows a tax loss while cash-flowing — sheltering income. Rental losses are passive: they offset passive income freely, and up to $25,000/yr can offset ordinary (W-2) income if you actively participate and your MAGI is under $100k (phasing out to $0 by $150k); unused losses carry forward. On sale, claimed depreciation is recaptured at up to 25%, and gains may owe capital-gains tax (a 1031 exchange can defer both). Figures are a year-1 estimate at your 24.0% rate — not tax advice; consult a CPA.
Schools (NCES district)
- District
- Polk
- NCES district ID
- 1201590
- Math proficiency
- 39% ▼ -11.00%
- Reading proficiency
- 43% ▼ -4.00%
- Median HH income
- $43,979
- Composite
- 34.74/100
- National rank
- #5132
- State rank
- #62 of 73 in FL
Livability — Winter Haven
- Score
- 74/100
- State rank
- #291
- US rank
- #4898
Category grades
Schools grade is shown separately in the Schools card above.
Census & demographics
- Census place
- Winter Haven, FL
- County
- Polk County · 740,051 people
- City population
- 121,740
- Metro
- Lakeland-Winter Haven, FL
- Population (ZIP)
- 43,371
- Household income
- $56,390
- Rent vs Own
- Severe rent burden
- 1412.0
Population outlook (Polk County) Hauer SSP2
- Today (2025)
- 752,975 people
- By 2030
- 804,621 · +6.9%
- By 2040
- 906,117 · +20.3%
- By 2050
- 1,000,476 · +32.9%
- By 2075
- 1,197,520 · +59.0%
- By 2100
- 1,271,518 · +68.9%
Race, ethnicity, and origin ACS 2023
- Neighborhood character
- Diverse neighborhood (Simpson 0.65)
- Race & ethnicity
- White 49% Hispanic / Latino 27% Black 17% Two or more races 14% Asian 1%
- Hispanic origin (detail)
- Mexican 11% Puerto Rican 10% Cuban 2%
- Common ancestry
- Hispanic 2% Lithuanian 1% Italian 1%
- Foreign-born
- 9% · Canada, Jamaica
- Languages at home
- 74% English-only · Spanish 21% French/Haitian/Cajun 4%
Political lean MEDSL · Polk
- 2024 margin
- Strong R (+20.7) · D 39.2% · R 59.9%
- 2008→2024 swing
- -14.6pp toward R · 2008: -6.1pp · 2024: -20.7pp
- All cycles
- 2024: R+20.7 2020: R+14.4 2016: R+14.1 2012: R+6.8 2008: R+6.1
Not yet ingested
- Civics
- —
Market trends
- HPI YoY
- ▼ -61.41%
- Current HPI
- 317.8788
- Rent YoY
- ▲ 2.47%
- Metro
- Lakeland-Winter Haven, FL
- State GDP YoY
- ▲ 3.28%
- F500 in state
- 36
Industry mix (Fortune 500 HQ in FL)
| Industry | F500 HQs | Revenue |
|---|---|---|
| Industrial Technology | 2 | $29B |
|
||
| Insurance | 2 | $17B |
|
||
| Retail | 1 | $60B |
|
||
| Technology Distribution | 1 | $58B |
|
||
| Homebuilding | 1 | $35B |
|
||
| Technology Manufacturing | 1 | $35B |
|
||
Price history
-76.8% since first listed4 events — show timeline
- 2026-05-21 Listed $102,000 Stellar MLS as Distributed by MLS Grid
- 1998-10-28 Sold (Public Records) $42,900 Public Records
- 1996-03-21 Sold (Public Records) $24,300 Public Records
- 1995-10-10 Sold (Public Records) $440,000 Public Records
Property tax history
+18.8%/yrLatest (2025): $2,616 · -5.4% YoY. Source: county tax records.
Cash-flow waterfall
monthlySold comps — $/sqft
last 12 mo · ≤1 miLoading sold comps…