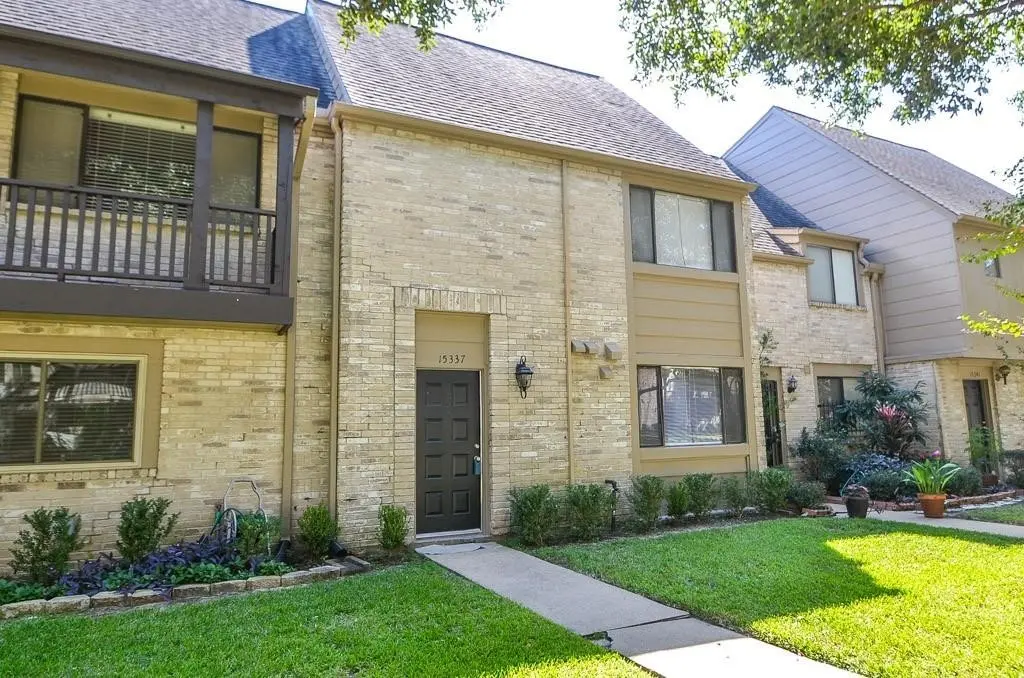
15337 Falmouth Ave #2 · Houston, TX
Flood risk 1/10 · Minimal
- FEMA flood zone
- X (unshaded)
- Chance of flooding over 30 yrs
- 0.0%
- Est. flood insurance / yr
- $507 – $1,088
Fire risk 1/10 · Minimal
- Est. fire insurance / yr
- $1,222 – $2,270
Heat risk 9/10 · Severe
- Hot days now (above 110°F)
- 7 days/yr
- Hot days in 30 yrs
- 23 days/yr
Wind risk 8/10 · Major
- Chance of severe wind over 30 yrs
- 99.0%
Air-quality risk 3/10 · Minor
- Unhealthy air days now
- 2 days/yr
- Unhealthy air days in 30 yrs
- 3 days/yr
Risk factors via First Street. Map © Google.
Why this score? — see what drove the D grade
The composite is a weighted blend of 9 inputs, each scored 0–100. Each bar is that input's sub-score; the figure is the points it added to the 100-point composite (weight × sub-score).
- Cash flow +11.9/30.0
- ARV discount +7.5/15.0
- 1% rule +4.8/10.0
- Schools +4.4/10.0
- Appreciation +4.3/10.0
- Livability +3.7/5.0
- DSCR +3.5/10.0
- Condition / age +2.5/5.0
- Rent growth +1.8/5.0
$206,900
🖨 Deal sheet 📄 Offer letter ✓ Due diligence
Listing remarks MLS
FULLY REMODELED OPEN FLOOR PLAN W/ 3 BEDROOMS IN LANGHAM CREEK. GREAT AREA CLOSE TO HWY 6 & 290. SPACIOUS BEDROOMS. MASTERS HAS HUGE CLOSET & DOUBLE SINK. FRESH PAINT THROUGHOUT. NEW CARPET, WOOD CABINETS, APPLIANCES, & GRANITE COUNTERS IN KITCHEN. BATHROOM INCLUDES NEW VANITIES. NEW PLUMBING, INSULATION, & ELECTRIC. MOVE-IN READY. CLOSE TO SHOPPING AND RESTAURANTS. COMMUNITY HAS SWIMMING POOL, TENNIS COURT, PARK & TRAILS NEARBY. THIS HOME IS A MUST SEE!
Key facts
- Open floor plan
- New carpet
- Double sink
Tags
Neighborhood map
What this means for you Summary
Snapshot
- This is a 3-bed/2.0-bath townhouse listed at $207k.
Deal economics
- At list price, monthly cash flow is $-54 ($-643/yr) — negative.
- To cash-flow at today's rent, offer at most $197k (4.6% below list).
- To meet the 1% rule (rent ≥ 1% of price), the offer needs to be $204k (1.5% below list).
- Recommended offer: $197k (4.6% below list) — sets the bar for cash-flow.
- Cap rate 6.0% vs local median 3.2% in Houston — top-decile yield for the area; either an underpriced asset or a hidden risk that comps aren't pricing in. Stress-test before assuming the spread holds.
Location & tenants
- Location reads 74/100 on livability (#184 in TX, #4,771 nationally) — a middle-class / working-renter tenant base. Strengths: amenities A+, cost of living A+, housing A+; Watch: schools D, crime F.
- Cypress-Fairbanks ISD (suburban): math 45% / reading 52% proficiency, ranked #161 of 826 in TX (top 20%) — families likely to look elsewhere, expect single-tenant / working-renter base with shorter leases.
- Market conditions: Rents soft (-2.9%/yr); 494 active listings in the ZIP; 27 comparable units currently listed for rent nearby; rentals at typical pace (median 22d on market — plan ~3-4 weeks tenant-placement turnaround); solid renter incomes; 29,883 units permitted in Harris County in 2024 (8,621 in 5+ unit buildings).
- This rent runs 30% of the median local income ($81k/yr) — at the standard rent-burdened threshold; future hikes will face affordability resistance.
Forward outlook
- Local home prices are declining (-1.4%/yr); year-one equity from $1k of loan paydown is wiped out by about $3k of value loss. Plan a longer hold.
- Harris County population projected at +47% by 2050 — long-run rental-demand tailwind backs the buy-and-hold thesis.
Negotiation context
- It's been on market 54 days — a 3% lower offer ($201k) is reasonable based on typical stale-listing flexibility.
- 3 sale attempts since 20y ago with the ask held roughly flat each time — persistent listings suggest the price (not the market) is what's stuck; bring a comps-based counter.
Risks & watch-outs
- Climate carrying-cost: severe wind risk, 99% chance of damaging wind over 30y; extreme-heat days projected 7→23/yr by 2055 (HVAC capex compounding) — expect insurance premiums to compound above CPI over the hold.
Questions for the listing agent
- What do current leases actually rent for vs. the listed asking? Can we see a recent rent roll and the last 12 months of T-12 income?
- It's been on market 54 days. Have you received any prior offers? Is the seller open to a 5% concession, seller financing, or rate buy-down credit?
- What does the HOA fee cover, when was the last increase, and are there any pending special assessments or reserve-fund shortfalls?
- Is there a deadline driving the sale (1031 exchange, divorce, estate, relocation)? That informs how much negotiation room exists.
- Schools are D-rated, which usually means shorter tenancies and higher turnover. Who's the typical renter profile here, and what's been the actual vacancy rate?
- Crime grade is F in this area — have there been break-ins, vandalism, or insurance claims at this property in the last 3 years? What carrier currently insures it and at what premium?
- The area grade is low — what's the realistic commute time and amenity access for the typical tenant pool here? Any planned neighborhood developments (good or bad) we should know about?
- What's the average days-on-market for RENTAL listings here right now (not sales)? A rising rental-DOM trend means longer vacancies and softer asking-rent achievability than the comps imply.
- What's the recent tenant-quality profile in this submarket — average credit score on applications, eviction rate, late-payment / NSF rate, and stable-employment percentage? A property-management company in the area should have these aggregated.
- How much new for-sale + rental construction is in the pipeline within 1–3 miles? Heavy new supply typically softens prices + rents 12–24 months out; constrained supply supports both.
Investment metrics
- 1% rule
- 0.98% ✗
- Cap rate
- 5.98%
- Cash-on-cash
- -1.11%
- DSCR
- 0.95
- GRM
- 8.5
CMA / ARV
- ARV (on-the-fly)
- $206,976
- Comps found
- 12
Show comp detail 12 sales within ~0.75 mi
| Address | Dist | Beds/Ba | Sqft | Sold | Price | $/sf | Match |
|---|---|---|---|---|---|---|---|
| 15353 Falmouth Ave #2 | 0.03mi | 3/2.5 | 2,156 (0%) | 2mo | $199,900 | $93 | 95 |
| 15338 Falmouth Ave Unit 1/419 | 0.03mi | 3/2.5 | 2,156 (0%) | 4mo | $209,000 | $97 | 94 |
| 6667 Kentwick Dr Unit 2-19 | 0.09mi | 3/2.5 | 2,024 (-6%) | 4mo | $180,000 | $89 | 80 |
| 15312 Falmouth Ave #406 | 0.06mi | 3/2.5 | 2,024 (-6%) | 6mo | $124,100 | $61 | 80 |
| 6506 Kentwick Dr | 0.27mi | 3/2.5 | 2,156 (0%) | 9mo | $189,500 | $88 | 78 |
| 6703 Kentwick Dr Unit 2/3 | 0.07mi | 3/2.5 | 2,024 (-6%) | 14mo | $219,700 | $109 | 73 |
| 15327 Falmouth Ave #2 | 0.02mi | 4/3.0 (+1) | 2,454 (+14%) | 1mo | $208,900 | $85 | 66 |
| 6428 Alisa Ln | 0.39mi | 3/2.5 | 2,024 (-6%) | 4mo | $194,900 | $96 | 66 |
| 6428 Kentwick Dr Unit 24/5 | 0.34mi | 3/2.5 | 1,840 (-15%) | 2mo | $110,000 | $60 | 56 |
| 6444 Kentwick Dr Unit 24/13 | 0.31mi | 3/2.5 | 1,840 (-15%) | 10mo | $194,900 | $106 | 51 |
| 15846 Whiteglade Ln | 0.70mi | 3/2.5 | 1,984 (-8%) | 2mo | $220,000 | $111 | 50 |
| 15818 Whiteglade Ln | 0.72mi | 3/2.5 | 1,960 (-9%) | 6mo | $235,000 | $120 | 44 |
Match score weights: distance 35% · size 25% · config 20% · recency 20%. Top-matched comps best support the ARV.
Projected returns pro-forma
-1.4% appreciation · 0.0% rent growth · sell at horizon
- IRR
- -12.1%
- Equity multiple
- 0.51×
- Total profit
- $-28,462
- Equity at exit
- $46,035
- IRR
- -8.8%
- Equity multiple
- 0.34×
- Total profit
- $-38,414
- Equity at exit
- $45,085
Cash invested: $57,932 (down + closing). Projections, not guarantees.
Landlord ↔ Tenant lean methodology
- Overall (STATE)
- 87 Strongly Landlord-Friendly
- State Texas
- 87 Strongly Landlord-Friendly · R+5
- County
- — inherits STATE
- City
- — inherits STATE
ZIP-level market 77084
- Home prices YoY
- -0.6%
- Rents YoY
- -2.9%
- Active inventory
- 494
- Price-to-rent
- 8.5×
Monthly cashflow live
- Estimated rent
- $2,037 high interval (Pro) →
- Mortgage (P&I)
- −$1,085
- Tax from tax record
- −$332 /mo · $3,984/yr
- Insurance
- −$86
- HOA
- −$160
- Vacancy / Maint / Mgmt
- −$428
- Net cashflow
- $-54
Break-even live
UW: 25.0% down · 7.5% · 30yr · 1.5% tax · 5.0% vac · 8.0% maint · 8.0% mgmt
Financing live
Cash to close
- Down payment
- $51,725
- Closing costs
- $6,207
- Reserves months
- —
- Total cash needed
- —
Loan-product check · same deal, 3 products live
Conventional
25% down · 7.5% · 30yr
- Down + closing
- —
- Monthly P&I
- —
- Monthly cashflow
- —
- DSCR
- —
- Eligible?
- —
Personal DTI + credit; lowest rate.
DSCR
20% down · 8.5% · 30yr
- Down + closing
- —
- Monthly P&I
- —
- Monthly cashflow
- —
- DSCR
- —
- Eligible?
- —
No personal income docs; deal must DSCR.
Hard money
10% down · 12.0% · 12mo
- Down + closing
- —
- Monthly P&I
- —
- Monthly cashflow
- —
- DSCR
- —
- Eligible?
- —
Short-term bridge; refi at stabilization.
Rent comps 27 comps
| Address | Beds | Baths | Sqft | Rent | $/sqft | DOM | Units | Dist |
|---|---|---|---|---|---|---|---|---|
| 6685 Kentwick Dr #210 Houston, TX | 3.0 | 2.5 | 1800 | $1,870 | $1.04 | 7d | 1 | 0.10mi |
| 15111 Falmouth Ave Houston, TX | 3.0 | 2.0 | 1674 | $1,850 | $1.11 | 43d | 1 | 0.23mi |
| 6407 Waldron Dr Unit B Houston, TX | 3.0 | 2.5 | 1546 | $1,800 | $1.16 | 24d | 1 | 0.32mi |
| 6427 Waldron Dr Unit A Houston, TX | 3.0 | 2.5 | 1593 | $1,900 | $1.19 | 43d | 1 | 0.34mi |
| 15022 Mulberry Meadows Dr Houston, TX | 3.0 | 2.0 | 1832 | $1,885 | $1.03 | 1d | 1 | 0.34mi |
| 15255 Farm to Market Road 529 #15288 Houston, TX | 3.0 | 2.0 | 1652 | $2,170 | $1.31 | 43d | 1 | 0.35mi |
| 15255 Farm to Market Road 529 #525 Houston, TX | 3.0 | 2.0 | 1652 | $2,127 | $1.29 | 2d | 1 | 0.35mi |
| 15255 Farm to Market Road 529 #3174 Houston, TX | 3.0 | 2.0 | 1652 | $2,170 | $1.31 | 11d | 1 | 0.35mi |
| 6607 Readsland Ln Houston, TX | 4.0 | 2.0 | 1832 | $2,500 | $1.36 | 43d | 1 | 0.35mi |
| 15022 Ringfield Dr Houston, TX | 3.0 | 2.0 | 2064 | $1,975 | $0.96 | 43d | 1 | 0.45mi |
| 6803 Hedgewick Dr Houston, TX | 4.0 | 2.5 | 2336 | $2,550 | $1.09 | 22d | 1 | 0.49mi |
| 6706 Honey Harvest Ln Houston, TX | 3.0 | 3.0 | 1873 | $2,049 | $1.09 | 43d | 1 | 0.65mi |
| 14623 Sanour Dr Houston, TX | 3.0 | 2.5 | 2032 | $2,170 | $1.07 | 5d | 1 | 0.74mi |
| 7415 Broken Ridge Dr Houston, TX | 3.0 | 2.5 | 2416 | $2,245 | $0.93 | 43d | 1 | 0.81mi |
| 6102 Crakston St Houston, TX | 3.0 | 2.0 | 1862 | $1,850 | $0.99 | 43d | 1 | 0.84mi |
| 15831 Yorktown Crossing Pkwy Houston, TX | 3.0 | 2.0 | 1470 | $2,381 | $1.62 | 2d | 1 | 0.93mi |
| 15831 Yorktown Crossing Pkwy Houston, TX | 1.0–3.0 | 1.0–2.0 | 1168 | $2,689 | $2.30 | 1d | 1 | 0.93mi |
| 15831 Yorktown Crossing Pkwy Unit 3174 Houston, TX | 3.0 | 2.0 | 1487 | $2,309 | $1.55 | 10d | 1 | 0.97mi |
| 15831 Yorktown Crossing Pkwy Unit 525 Houston, TX | 3.0 | 2.0 | 1487 | $2,277 | $1.53 | 2d | 1 | 0.97mi |
| 16222 Summer Dew Ln Houston, TX | 3.0 | 2.0 | 1402 | $1,750 | $1.25 | 12d | 1 | 1.05mi |
| 16550 Bouldgreen St Houston, TX | 3.0 | 2.5 | 2237 | $2,386 | $1.07 | 43d | 1 | 1.18mi |
| 16603 Live Oak Canyon Dr Houston, TX | 3.0 | 2.5 | 2557 | $1,986 | $0.78 | 43d | 1 | 1.20mi |
| 7451 Tunbury Ln Houston, TX | 4.0 | 2.5 | 2630 | $2,171 | $0.83 | 7d | 1 | 1.20mi |
| 5703 Afton Ridge Ln Houston, TX | 4.0 | 2.5 | 2203 | $1,896 | $0.86 | 22d | 1 | 1.25mi |
| 16303 Hickory Point Rd Houston, TX | 4.0 | 2.5 | 2556 | $2,400 | $0.94 | 2d | 1 | 1.26mi |
| 7331 Millbrae Ln Houston, TX | 4.0 | 2.0 | 2481 | $1,779 | $0.72 | 1d | 1 | 1.44mi |
| 15619 Fern Ridge Dr Houston, TX | 4.0 | 2.0 | 1958 | $2,335 | $1.19 | 24d | 1 | 1.47mi |
HOA detail
- Monthly dues
- $160 · $1,920/yr
- Likely covers
- electricpool
Listing history 17 events
-
2026-06-09days on market $206,900 Active 54 DOM
-
2026-06-08days on market $206,900 Active 53 DOM
-
2026-06-07days on market $206,900 Active 52 DOM
-
2026-06-04days on market $206,900 Active 49 DOM
-
2026-06-03days on market $206,900 Active 48 DOM
-
2026-06-02days on market $206,900 Active 47 DOM
-
2026-06-02days on market $206,900 Active 46 DOM
-
2026-05-31days on market $206,900 Active 45 DOM
-
2026-04-16$206,900 Active 478-char remark
Show marketing remark (478 chars)
FULLY REMODELED OPEN FLOOR PLAN W/ 3 BEDROOMS IN LANGHAM CREEK. GREAT AREA CLOSE TO HWY 6 & 290. SPACIOUS BEDROOMS. MASTERS HAS HUGE CLOSET & DOUBLE SINK. FRESH PAINT THROUGHOUT. NEW CARPET, WOOD CABINETS, APPLIANCES, & GRANITE COUNTERS IN KITCHEN. BATHROOM INCLUDES NEW VANITIES. NEW PLUMBING, INSULATION, & ELECTRIC. MOVE-IN READY. CLOSE TO SHOPPING AND RESTAURANTS. COMMUNITY HAS SWIMMING POOL, TENNIS COURT, PARK & TRAILS NEARBY. THIS HOME IS A MUST SEE!
-
2017-12-15historical
-
2017-11-10price $162,900
-
2017-10-19$164,900 Active
-
2006-10-31historical
-
2006-05-01$105,644
-
2005-09-21soldstatus
-
2005-09-21soldstatus
-
1988-07-07soldstatus
ⓘ Source: listings_history table (triggers on properties + properties_extension) + one-shot
backfill from property_details.listing_events for pre-trigger history.
Tax reassessment forecast TX · Resets to sale price
- Current annual tax
- $3,984 · $332/mo
- Projected year-2 tax
- $3,984 · $332/mo
- Expected delta
- $0/yr ($0/mo · 0.0%)
ⓘ Screening estimate from a state-policy table — verify with the county assessor before closing.
Climate risk First Street
- Flood 1/10 Low FEMA zone X (unshaded) · 0% chance over 30 yrs
- Wildfire 1/10 Low
- Heat 9/10 Extreme 7 d/yr ≥110°F today · 23 d/yr by 30 yrs out
- Wind 8/10 Severe 99% chance of damaging wind over 30 yrs
- Air quality 3/10 Moderate 2 unhealthy d/yr today · 3 by 30 yrs out
Nearby sold comps map
Loading sold comps map…
Walkable amenities ~0.75 mi
Loading nearby amenities…
Taxation est. · year 1
- Rental income
- $24,450
- − Mortgage interest
- −$11,590
- − Property taxes
- −$3,984
- − Insurance
- −$1,034
- − Repairs & maintenance
- −$1,956
- − Management
- −$1,956
- − HOA
- −$1,920
- − Depreciation
- −$6,019
- Taxable loss
- −$4,009
- Est. tax savings @ 24.0%
- +$962
- After-tax cash flow
- $319/yr
For passive investors: Depreciation is non-cash, so a rental often shows a tax loss while cash-flowing — sheltering income. Rental losses are passive: they offset passive income freely, and up to $25,000/yr can offset ordinary (W-2) income if you actively participate and your MAGI is under $100k (phasing out to $0 by $150k); unused losses carry forward. On sale, claimed depreciation is recaptured at up to 25%, and gains may owe capital-gains tax (a 1031 exchange can defer both). Figures are a year-1 estimate at your 24.0% rate — not tax advice; consult a CPA.
Schools (NCES district)
- District
- Cypress-Fairbanks ISD
- NCES district ID
- 4816110
- Math proficiency
- 45% ▼ -12.00%
- Reading proficiency
- 52% ▼ -2.00%
- Median HH income
- $72,025
- Composite
- 43.63/100
- National rank
- #2968
- State rank
- #161 of 826 in TX
Livability — Houston
- Score
- 74/100
- State rank
- #184
- US rank
- #4771
Category grades
Schools grade is shown separately in the Schools card above.
Census & demographics
- County
- Harris County · 4,702,590 people
- City population
- 3,226,434
- Metro
- Houston-The Woodlands-Sugar Land, TX
- Population (ZIP)
- 110,217
- Household income
- $80,575
- Rent vs Own
- Severe rent burden
- 3257.0
Population outlook (Harris County) Hauer SSP2
- Today (2025)
- 5,571,493 people
- By 2030
- 6,089,821 · +9.3%
- By 2040
- 7,142,806 · +28.2%
- By 2050
- 8,185,864 · +46.9%
- By 2075
- 10,574,329 · +89.8%
- By 2100
- 12,109,958 · +117.4%
Race, ethnicity, and origin ACS 2023
- Neighborhood character
- Diverse neighborhood (Simpson 0.69)
- Race & ethnicity
- Hispanic / Latino 48% Two or more races 22% White 22% Black 16% Asian 11% Native American 2%
- Hispanic origin (detail)
- Mexican 27% Cuban 2%
- Common ancestry
- Lithuanian 1% Romanian 1% Slovak 1%
- Foreign-born
- 32% · Canada, Vietnam, Jamaica
- Languages at home
- 48% English-only · Spanish 38% Other Indo-European 5% Vietnamese 3%
Political lean MEDSL · Harris
- 2024 margin
- Lean D (+5.5) · D 52.0% · R 46.4% · Other 1.6%
- 2008→2024 swing
- +3.9pp toward D · 2008: 1.6pp · 2024: 5.5pp
- All cycles
- 2024: D+5.5 2020: D+13.3 2016: D+12.4 2012: D+0.1 2008: D+1.6
Not yet ingested
- Civics
- —
Market trends
- HPI YoY
- ▼ -1.40%
- Current HPI
- 251.8474
- Rent YoY
- ▼ -2.89%
- Metro
- Houston-The Woodlands-Sugar Land, TX
- State GDP YoY
- ▲ 3.95%
- F500 in state
- 110
Industry mix (Fortune 500 HQ in TX)
| Industry | F500 HQs | Revenue |
|---|---|---|
| Energy | 16 | $1,198B |
|
||
| Technology | 5 | $198B |
|
||
| Engineering / Construction | 4 | $72B |
|
||
| Energy Services | 3 | $60B |
|
||
| Utilities | 3 | $41B |
|
||
| Healthcare | 2 | $330B |
|
||
Price history
+95.8% since first listed9 events — show timeline
- 2026-04-16 Listed $206,900 HARMLS
- 2017-12-15 Listing Removed — HARMLS
- 2017-11-10 Price Changed $162,900 HARMLS
- 2017-10-19 Listed $164,900 HARMLS
- 2006-10-31 Listing Removed — HARMLS
- 2006-05-01 Listed $105,644 HARMLS
- 2005-09-21 Sold (Public Records) — Public Records
- 2005-09-21 Sold (Public Records) — Public Records
- 1988-07-07 Sold (Public Records) — Public Records
Property tax history
+7.1%/yrLatest (2025): $3,984 · -10.1% YoY. Source: county tax records.
Cash-flow waterfall
monthlySold comps — $/sqft
last 12 mo · ≤1 miLoading sold comps…