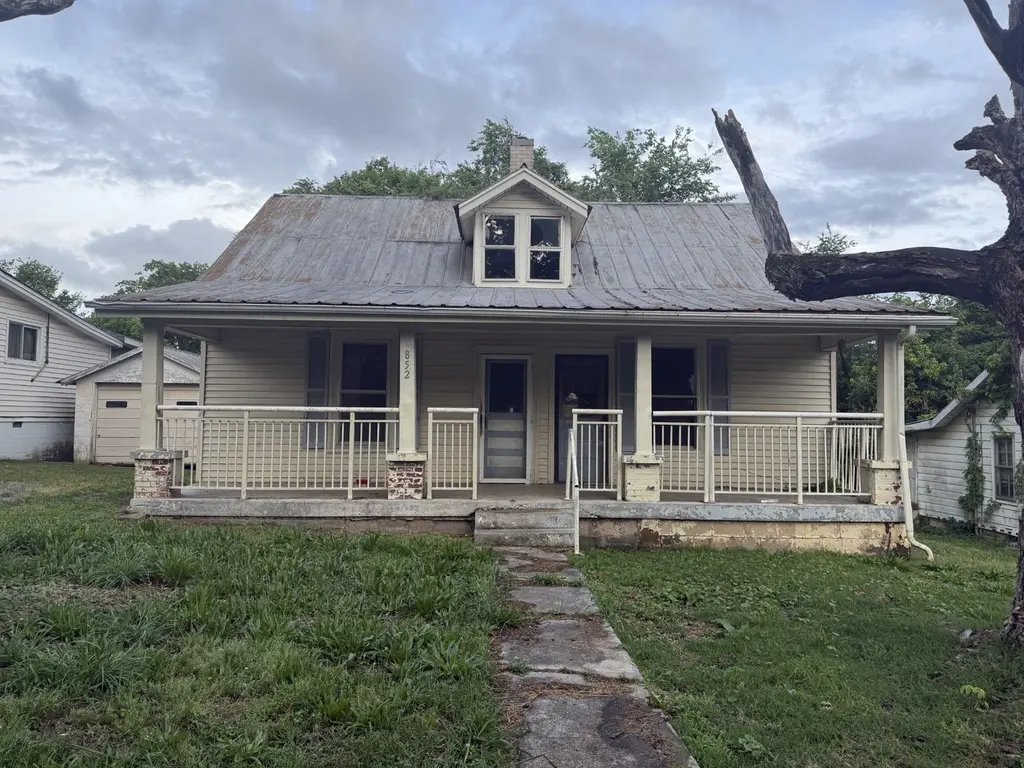
852 N Brown St · Springfield, TN
Flood risk 1/10 · Minimal
- FEMA flood zone
- X (unshaded)
- Chance of flooding over 30 yrs
- 0.0%
- Est. flood insurance / yr
- $507 – $1,088
Fire risk 2/10 · Minimal
- Est. fire insurance / yr
- $949 – $1,763
Heat risk 5/10 · Moderate
- Hot days now (above 106°F)
- 7 days/yr
- Hot days in 30 yrs
- 19 days/yr
Wind risk 4/10 · Minor
- Chance of severe wind over 30 yrs
- 9.0%
Air-quality risk 2/10 · Minimal
- Unhealthy air days now
- 0 days/yr
- Unhealthy air days in 30 yrs
- 1 days/yr
Risk factors via First Street. Map © Google.
Why this score? — see what drove the B- grade
The composite is a weighted blend of 9 inputs, each scored 0–100. Each bar is that input's sub-score; the figure is the points it added to the 100-point composite (weight × sub-score).
- Cash flow +30.0/30.0
- 1% rule +10.0/10.0
- DSCR +10.0/10.0
- ARV discount +7.5/15.0
- Livability +3.1/5.0
- Rent growth +2.7/5.0
- Condition / age +2.5/5.0
- Schools +2.2/10.0
- Appreciation +0.0/10.0
$125,000
🖨 Deal sheet (PDF) 📄 Offer letter ✓ Due diligence
Listing remarks
Fantastic home to renovate in a lovely neighborhood.
Key facts
- 9,583 sq ft lot
- Built 1931
- Listed 21 days
Property features AI
Finance
- Financial info: Annual tax amount reported
Exterior
- Parking: No covered parking; No parking spaces reported
- Utilities: Public water; Public sewer; Water available
- Home design: Single-family residence; Two levels; Approximately 1,500 square feet above grade
- Construction: Wood siding; Approximate year built; Unfinished basement (foundation present)
- Exterior features: Lot approximately 0.22 acres; Lot dimensions approximately 50 x 206 (irregular)
Interior
- Kitchen: No appliances listed
- Bedrooms: 3 bedrooms total (2 on main level)
- Flooring: Wood floors
- Bathrooms: 1 full bathroom
- Heating & cooling: No heating; No cooling
- Interior features: Unfinished basement; Wood flooring
- Laundry & utility: No laundry appliances listed
Neighborhood map
What this means for you Summary
Snapshot
- This is a 3-bed/1.0-bath single-family listed at $125k.
Deal economics
- At list price, monthly cash flow is $706 ($8k/yr) — positive.
- The deal already cash-flows at list — no discount required.
- Meets the 1% rule at list price ($2k rent vs $125k).
- Recommended offer: $123k (1.5% below list) — sets the bar for market timing.
- Cap rate 13.1% vs local median 3.5% in Springfield — top-decile yield for the area; either an underpriced asset or a hidden risk that comps aren't pricing in. Stress-test before assuming the spread holds.
Location & tenants
- Location reads 62/100 on livability (#225 in TN) — a middle-class / working-renter tenant base. Strengths: cost of living A+, housing A+; Watch: amenities F, commute F, employment D-.
- Robertson County (rural): math 22% / reading 26% proficiency, ranked #82 of 139 in TN (top 59%) — low school quality limits family demand, transient renter base, plan for 1-2y turnover.
- Zoned schools: Krisle Elementary (math 17% / reading 22%, grade F, #654 of 952 statewide, top 72%, 356 students, 0% FRL); Springfield High School (math 3% / reading 19%, grade F, #268 of 332 statewide, top 82%, 1,223 students, 0% FRL) — zoned schools average 0% FRL vs 42% district-wide (42 pts lower); this property's tenant base skews higher-income than the district average.
- Market conditions: Rents flat; 253 active listings in the ZIP; 8 comparable units currently listed for rent nearby; rentals lingering (median 45d on market — plan ~5-8 weeks vacancy on turnover, expect pricing pressure); 62% of comp listings sitting > 30 days — soft ceiling on asking rent; 983 units permitted in Robertson County in 2024 (0 in 5+ unit buildings).
- This rent runs 31% of the median local income ($72k/yr) — at the standard rent-burdened threshold; future hikes will face affordability resistance.
Forward outlook
- Local home prices are declining (-3.0%/yr); year-one equity from $864 of loan paydown is wiped out by about $4k of value loss. Plan a longer hold.
- Robertson County population projected at +7% by 2050 — modest demand growth; plan on rents tracking national, not racing it.
- At projected returns (-3.0% appreciation + 0.7% rent growth), your $35k cash investment doubles in ~6 years — after that, you're playing with house money.
Negotiation context
- It's been on market 22 days — a 2% lower offer ($123k) is reasonable based on typical stale-listing flexibility.
Risks & watch-outs
- Watch-outs: built in 1931 — expect roof / HVAC / electrical / plumbing capex.
- Climate carrying-cost: extreme-heat days projected 7→19/yr by 2055 (HVAC capex compounding) — expect insurance premiums to compound above CPI over the hold.
Questions for the listing agent
- Built in 1931 — when were the roof, HVAC, electrical panel, plumbing, and water heater last replaced?
- Is there a deadline driving the sale (1031 exchange, divorce, estate, relocation)? That informs how much negotiation room exists.
- Schools are F-rated, which usually means shorter tenancies and higher turnover. Who's the typical renter profile here, and what's been the actual vacancy rate?
- What's the average days-on-market for RENTAL listings here right now (not sales)? A rising rental-DOM trend means longer vacancies and softer asking-rent achievability than the comps imply.
- What's the recent tenant-quality profile in this submarket — average credit score on applications, eviction rate, late-payment / NSF rate, and stable-employment percentage? A property-management company in the area should have these aggregated.
- How much new for-sale + rental construction is in the pipeline within 1–3 miles? Heavy new supply typically softens prices + rents 12–24 months out; constrained supply supports both.
Investment metrics
- 1% rule
- 1.51% ✓
- Cap rate
- 13.07%
- Cash-on-cash
- 24.19%
- DSCR
- 2.08
- GRM
- 5.5
CMA / ARV
- ARV (on-the-fly)
- $352,044
- Comps found
- 12
Show comp detail 12 sales within ~0.75 mi
| Address | Dist | Beds/Ba | Sqft | Sold | Price | $/sf | Match |
|---|---|---|---|---|---|---|---|
| 506 5th Ave E | 0.13mi | 3/1.5 | 1,801 (+1%) | 14mo | $90,000 | $50 | 78 |
| 1010 Addison Ct | 0.33mi | 3/2.5 | 1,702 (-4%) | 0mo | $405,000 | $238 | 71 |
| 603 Crestview Dr | 0.65mi | 3/2.0 | 1,687 (-5%) | 0mo | $307,400 | $182 | 57 |
| 400 Connell St | 0.71mi | 3/2.0 | 1,787 (+0%) | 7mo | $305,000 | $171 | 56 |
| 519 S Pawnee Dr | 0.27mi | 4/3.0 (+1) | 1,950 (+10%) | 8mo | $320,000 | $164 | 52 |
| 325 Walnut St N | 0.50mi | 4/2.5 (+1) | 1,628 (-8%) | 3mo | $385,000 | $236 | 49 |
| 301 Durrett St | 0.19mi | 3/2.0 | 1,516 (-15%) | 16mo | $316,900 | $209 | 49 |
| 503 4th Ave W | 0.59mi | 3/2.0 | 1,894 (+6%) | 12mo | $208,500 | $110 | 48 |
| 103 N Main St | 0.52mi | 3/2.0 | 1,529 (-14%) | 11mo | $355,000 | $232 | 40 |
| 331 Walnut St | 0.50mi | 3/2.5 | 1,980 (+11%) | 17mo | $360,000 | $182 | 37 |
| 203 Walnut St N | 0.57mi | 3/2.5 | 1,572 (-12%) | 18mo | $360,000 | $229 | 33 |
| 404 Connell St | 0.71mi | 4/2.0 (+1) | 1,518 (-15%) | 1mo | $300,000 | $198 | 33 |
Match score weights: distance 35% · size 25% · config 20% · recency 20%. Top-matched comps best support the ARV.
Projected returns pro-forma
-3.0% appreciation · 0.66% rent growth · sell at horizon
- IRR
- 14.9%
- Equity multiple
- 1.58×
- Total profit
- $20,317
- Equity at exit
- $18,638
- IRR
- 21.9%
- Equity multiple
- 2.67×
- Total profit
- $58,461
- Equity at exit
- $10,808
Cash invested: $35,000 (down + closing). Projections, not guarantees.
Landlord ↔ Tenant lean methodology
- Overall (STATE)
- 87 Strongly Landlord-Friendly
- State Tennessee
- 87 Strongly Landlord-Friendly · R+13
- County
- — inherits STATE
- City
- — inherits STATE
ZIP-level market 37172
- Home prices YoY
- -19.9%
- Rents YoY
- 0.7%
- Active inventory
- 253
- Price-to-rent
- 5.5×
Monthly cashflow live
- Estimated rent
- $1,889 high interval (Pro) →
- Mortgage (P&I)
- −$656
- Tax from tax record
- −$80 /mo · $954/yr
- Insurance
- −$52
- HOA
- −$0
- Vacancy / Maint / Mgmt
- −$397
- Net cashflow
- $706
Break-even live
Sensitivity live
| Price | -10% $776 | -5% $741 | +0% $706 | +5% $670 | +10% $635 |
|---|---|---|---|---|---|
| Rent | -10% $556 | -5% $631 | +0% $706 | +5% $780 | +10% $855 |
| Rate | -1.0pp $769 | -0.5pp $737 | base $706 | +0.5pp $673 | +1.0pp $640 |
UW: 25.0% down · 7.5% · 30yr · 1.5% tax · 5.0% vac · 8.0% maint · 8.0% mgmt
Financing live
Cash to close
- Down payment
- $31,250
- Closing costs
- $3,750
- Reserves months
- —
- Total cash needed
- —
Loan-product check · same deal, 3 products live
Conventional
25% down · 7.5% · 30yr
- Down + closing
- —
- Monthly P&I
- —
- Monthly cashflow
- —
- DSCR
- —
- Eligible?
- —
Personal DTI + credit; lowest rate.
DSCR
20% down · 8.5% · 30yr
- Down + closing
- —
- Monthly P&I
- —
- Monthly cashflow
- —
- DSCR
- —
- Eligible?
- —
No personal income docs; deal must DSCR.
Hard money
10% down · 12.0% · 12mo
- Down + closing
- —
- Monthly P&I
- —
- Monthly cashflow
- —
- DSCR
- —
- Eligible?
- —
Short-term bridge; refi at stabilization.
Rent comps 8 comps
| Address | Beds | Baths | Sqft | Rent | $/sqft | DOM | Units | Dist |
|---|---|---|---|---|---|---|---|---|
| 510 8th Ave E Springfield, TN | 3.0 | 2.0 | 1296 | $1,900 | $1.47 | 44d | 1 | 0.31mi |
| 819 Pitt Ave Springfield, TN | 3.0 | 2.0 | 1736 | $2,000 | $1.15 | 24d | 1 | 0.47mi |
| 62 N Main St Springfield, TN | 3.0 | 2.0 | 2063 | $1,500 | $0.73 | 18d | 1 | 0.58mi |
| 1001 Cheatham St Unit 192 Springfield, TN | 2.0 | 2.5 | 1700 | $1,650 | $0.97 | 4d | 1 | 0.66mi |
| 1214 Woodard Reid Rd Springfield, TN | 3.0 | 2.0 | 1736 | $2,200 | $1.27 | 44d | 1 | 0.94mi |
| 1150 17th Ave E Springfield, TN | 3.0 | 2.0 | 1336 | $1,549 | $1.16 | 44d | 1 | 1.04mi |
| 2107 Woodland St Springfield, TN | 3.0 | 2.0 | 1282 | $1,800 | $1.40 | 44d | 1 | 1.29mi |
| 115 Mooreland Dr Springfield, TN | 3.0 | 2.0 | 1238 | $1,420 | $1.15 | 44d | 1 | 1.33mi |
Listing history 15 events
-
2026-06-21days on market $125,000 Active 22 DOM
-
2026-06-18days on market $125,000 Active 19 DOM
-
2026-06-17days on market $125,000 Active 18 DOM
-
2026-06-16days on market $125,000 Active 17 DOM
-
2026-06-15days on market $125,000 Active 16 DOM
-
2026-06-13days on market $125,000 Active 14 DOM
-
2026-06-13days on market $125,000 Active 13 DOM
-
2026-06-09days on market $125,000 Active 10 DOM
-
2026-06-08days on market $125,000 Active 9 DOM
-
2026-06-07pricedays on market $125,000 Active 8 DOM
-
2026-06-03days on market $150,000 Active 4 DOM
-
2026-06-02days on market $150,000 Active 3 DOM
-
2026-06-01days on market $150,000 Active 2 DOM
-
2026-05-31remarks 52-char remark
-
2026-05-31$150,000 Active 1 DOM
ⓘ Source: listings_history table (triggers on properties + properties_extension) + one-shot
backfill from property_details.listing_events for pre-trigger history.
Tax reassessment forecast TN · Resets to sale price
- Current annual tax
- $954 · $80/mo
- Projected year-2 tax
- $954 · $80/mo
- Expected delta
- $0/yr ($0/mo · 0.0%)
ⓘ Screening estimate from a state-policy table — verify with the county assessor before closing.
Climate risk First Street
- Flood 1/10 Low FEMA zone X (unshaded) · 0% chance over 30 yrs
- Wildfire 2/10 Low
- Heat 5/10 Major 7 d/yr ≥106°F today · 19 d/yr by 30 yrs out
- Wind 4/10 Moderate 9% chance of damaging wind over 30 yrs
- Air quality 2/10 Low 0 unhealthy d/yr today · 1 by 30 yrs out
Nearby sold comps map
Loading sold comps map…
Walkable amenities ~0.75 mi
Loading nearby amenities…
Taxation est. · year 1
- Rental income
- $22,674
- − Mortgage interest
- −$7,002
- − Property taxes
- −$954
- − Insurance
- −$625
- − Repairs & maintenance
- −$1,814
- − Management
- −$1,814
- − Depreciation
- −$3,636
- Taxable income
- $6,828
- Est. tax owed @ 24.0%
- −$1,639
- After-tax cash flow
- $6,828/yr
For passive investors: Depreciation is non-cash, so a rental often shows a tax loss while cash-flowing — sheltering income. Rental losses are passive: they offset passive income freely, and up to $25,000/yr can offset ordinary (W-2) income if you actively participate and your MAGI is under $100k (phasing out to $0 by $150k); unused losses carry forward. On sale, claimed depreciation is recaptured at up to 25%, and gains may owe capital-gains tax (a 1031 exchange can defer both). Figures are a year-1 estimate at your 24.0% rate — not tax advice; consult a CPA.
Schools (NCES district)
- District
- Robertson County
- NCES district ID
- 4703600
- Math proficiency
- 22% ▼ -11.00%
- Reading proficiency
- 26% ▼ -5.00%
- Median HH income
- $53,503
- Composite
- 21.55/100
- National rank
- #8313
- State rank
- #82 of 139 in TN
Livability — Springfield
- Score
- 62/100
- State rank
- #225
- US rank
- #16806
Category grades
Schools grade is shown separately in the Schools card above.
Census & demographics
- Census place
- Springfield, TN
- County
- Robertson County · 49,504 people
- City population
- 31,263
- Metro
- Nashville-Davidson--Murfreesboro--Franklin, TN
- Population (ZIP)
- 31,263
- Household income
- $72,168
- Rent vs Own
- Severe rent burden
- 848.0
Population outlook (Robertson County) Hauer SSP2
- Today (2025)
- 72,786 people
- By 2030
- 74,478 · +2.3%
- By 2040
- 76,948 · +5.7%
- By 2050
- 77,618 · +6.6%
- By 2075
- 77,545 · +6.5%
- By 2100
- 72,836 · +0.1%
Race, ethnicity, and origin ACS 2023
- Neighborhood character
- Predominantly White (65%)
- Race & ethnicity
- White 65% Hispanic / Latino 17% Black 13% Two or more races 8%
- Hispanic origin (detail)
- Mexican 13% Puerto Rican 1%
- Common ancestry
- Slovak 3% Italian 1% Lithuanian 1%
- Foreign-born
- 10% · Canada
- Languages at home
- 83% English-only · Spanish 15%
Political lean MEDSL · Robertson
- 2024 margin
- Solid R (+50.9) · D 24.0% · R 74.9% · Other 1.1%
- 2008→2024 swing
- -19.8pp toward R · 2008: -31.1pp · 2024: -50.9pp
- All cycles
- 2024: R+50.9 2020: R+47.0 2016: R+47.2 2012: R+35.6 2008: R+31.1
Not yet ingested
- Civics
- —
Market trends
- HPI YoY
- ▼ -76.77%
- Current HPI
- 309.7118
- Rent YoY
- ▲ 0.66%
- Metro
- Nashville-Davidson--Murfreesboro--Franklin, TN
- State GDP YoY
- ▲ 2.78%
- F500 in state
- 22
Industry mix (Fortune 500 HQ in TN)
| Industry | F500 HQs | Revenue |
|---|---|---|
| Healthcare | 3 | $91B |
|
||
| Retail | 3 | $72B |
|
||
| Transportation / Logistics | 1 | $88B |
|
||
| Paper / Packaging | 1 | $19B |
|
||
| Insurance | 1 | $13B |
|
||
| Energy | 1 | $12B |
|
||
Price history
+689.5% since first listed4 events — show timeline
- 2026-05-30 Listed $150,000 REALTRACS as Distributed by MLS Grid
- 2022-04-07 Sold (Public Records) $150,268 Public Records
- 2000-05-10 Sold (Public Records) $55,600 Public Records
- 1980-01-01 Sold (Public Records) $19,000 Public Records
Property tax history
+6.6%/yrLatest (2025): $954 · +3.6% YoY. Source: county tax records.
Cash-flow waterfall
monthlySold comps — $/sqft
last 12 mo · ≤1 miLoading sold comps…