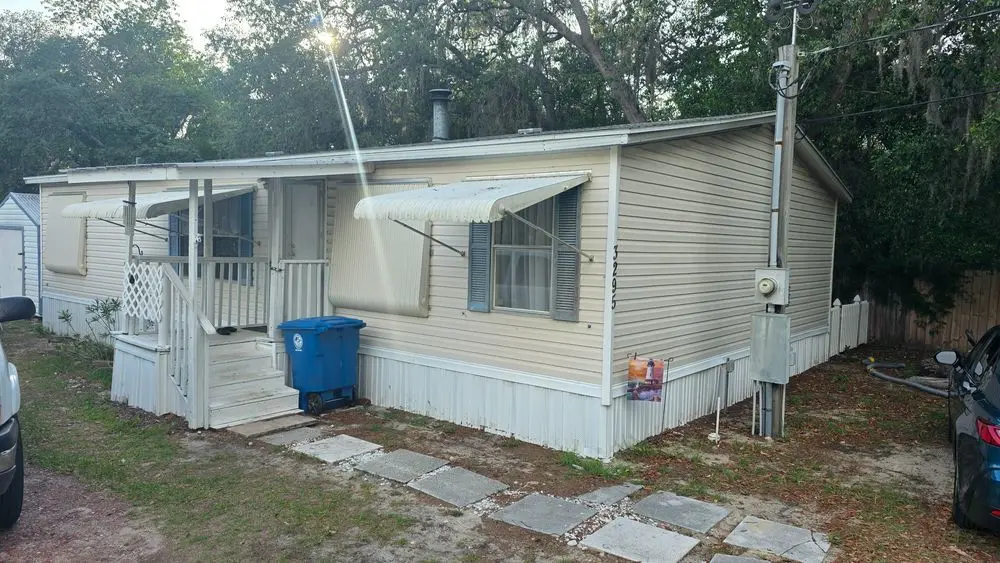
3295 Stephens Blvd · Spring Hill, FL
Flood risk 1/10 · Minimal
- FEMA flood zone
- X (unshaded)
- Chance of flooding over 30 yrs
- 0.0%
- Est. flood insurance / yr
- $507 – $1,088
Fire risk 4/10 · Minor
- Est. fire insurance / yr
- $947 – $1,759
Heat risk 10/10 · Severe
- Hot days now (above 110°F)
- 7 days/yr
- Hot days in 30 yrs
- 25 days/yr
Wind risk 10/10 · Severe
- Chance of severe wind over 30 yrs
- 99.0%
Air-quality risk 3/10 · Minor
- Unhealthy air days now
- 1 days/yr
- Unhealthy air days in 30 yrs
- 4 days/yr
Risk factors via First Street. Map © Google.
Why this score? — see what drove the B- grade
The composite is a weighted blend of 9 inputs, each scored 0–100. Each bar is that input's sub-score; the figure is the points it added to the 100-point composite (weight × sub-score).
- Cash flow +30.0/30.0
- DSCR +10.0/10.0
- ARV discount +9.4/15.0
- 1% rule +7.8/10.0
- Schools +4.2/10.0
- Livability +3.2/5.0
- Condition / age +2.5/5.0
- Rent growth +2.3/5.0
- Appreciation +0.0/10.0
$169,000
🖨 Deal sheet (PDF) 📄 Offer letter ✓ Due diligence
Listing remarks
Veteran owned & Very well maintained! -Hurricane ready! Anchored to ground with aluminum shutters on every window, -Roof in good condition. -Comes with microwave, refrigerator and dishwasher -Drinkable well water with good in ground pump. -Septic system in good condition -New large AC unit with thermostat. -25x12 detached wired workshop. -8x4 shed in back of property. -Back patio BBQ area with flower garden. -RV Site with Full hookups with 30 amp. -Fireplace with one year supply of oak firewood.
Key facts
- In ground pump
- Hurricane ready
- Large ac unit
Tags
Property features AI
Exterior
- Home design: House; Living area approximately 1,296
- Exterior features: Lot approximately 8,712 sq ft
Neighborhood map
What this means for you Summary
Snapshot
- This is a 3-bed/2.0-bath manufactured listed at $169k.
Deal economics
- At list price, monthly cash flow is $676 ($8k/yr) — positive.
- The deal already cash-flows at list — no discount required.
- Meets the 1% rule at list price ($2k rent vs $169k).
- Recommended offer: $166k (1.5% below list) — sets the bar for market timing.
- Cap rate 11.1% vs local median 4.4% in Spring Hill — top-decile yield for the area; either an underpriced asset or a hidden risk that comps aren't pricing in. Stress-test before assuming the spread holds.
Location & tenants
- Location reads 63/100 on livability (#738 in FL) — a middle-class / working-renter tenant base. Strengths: cost of living A+, housing A+; Watch: health & safety C-, employment D+, amenities F.
- Hernando (suburban): math 50% / reading 50% proficiency, ranked #38 of 73 in FL (top 52%) — acceptable for families but not a draw, mixed tenant base, ~2y average lease.
- Zoned schools: Deltona Elementary School (math 45% / reading 50%, grade D, #1,182 of 2,144 statewide, top 55%, 843 students, 72% FRL); Fox Chapel Middle School (math 39% / reading 44%, grade F, #348 of 571 statewide, top 62%, 862 students, 69% FRL); Central High School (math 34% / reading 44%, grade F, #312 of 667 statewide, top 48%, 1,426 students, 53% FRL).
- Market conditions: Rents soft (-0.9%/yr); 392 active listings in the ZIP; 10 comparable units currently listed for rent nearby; rentals at typical pace (median 27d on market — plan ~3-4 weeks tenant-placement turnaround); 2,505 units permitted in Hernando County in 2024 (318 in 5+ unit buildings).
- At $2,158/mo this rent would consume 45% of the median local household income ($57k/yr) (locally 733% of renters already pay >50% of income on rent) — very limited rent-growth headroom before tenants either downsize or default.
Forward outlook
- Local home prices are declining (-3.0%/yr); year-one equity from $1k of loan paydown is wiped out by about $5k of value loss. Plan a longer hold.
- Hernando County population projected at +11% by 2050 — modest demand growth; plan on rents tracking national, not racing it.
- At projected returns (-3.0% appreciation + 0.0% rent growth), your $47k cash investment doubles in ~10 years — after that, you're playing with house money.
Negotiation context
- It's been on market 17 days — a 2% lower offer ($166k) is reasonable based on typical stale-listing flexibility.
- 6 sale attempts since 21y ago; this cycle's ask has dropped $20k (11%) from the opening price — seller is motivated, your offer sets the floor, not the list.
- Current owner paid $30k; list at $169k implies a 461% gain — meaningful room to come down on a strong offer.
Risks & watch-outs
- Climate carrying-cost: severe wind risk, 99% chance of damaging wind over 30y; extreme-heat days projected 7→25/yr by 2055 (HVAC capex compounding) — expect insurance premiums to compound above CPI over the hold.
Questions for the listing agent
- Is there a deadline driving the sale (1031 exchange, divorce, estate, relocation)? That informs how much negotiation room exists.
- What's the average days-on-market for RENTAL listings here right now (not sales)? A rising rental-DOM trend means longer vacancies and softer asking-rent achievability than the comps imply.
- What's the recent tenant-quality profile in this submarket — average credit score on applications, eviction rate, late-payment / NSF rate, and stable-employment percentage? A property-management company in the area should have these aggregated.
- How much new for-sale + rental construction is in the pipeline within 1–3 miles? Heavy new supply typically softens prices + rents 12–24 months out; constrained supply supports both.
Investment metrics
- 1% rule
- 1.28% ✓
- Cap rate
- 11.10%
- Cash-on-cash
- 17.15%
- DSCR
- 1.76
- GRM
- 6.5
CMA / ARV
- ARV (on-the-fly)
- $176,256
- Comps found
- 7
Show comp detail 7 sales within ~0.75 mi
| Address | Dist | Beds/Ba | Sqft | Sold | Price | $/sf | Match |
|---|---|---|---|---|---|---|---|
| 3263 Morrison Way | 0.07mi | 3/2.0 | 1,216 (-6%) | 12mo | $170,000 | $140 | 77 |
| 3249 Susan Dr | 0.25mi | 3/2.0 | 1,380 (+6%) | 3mo | $145,000 | $105 | 75 |
| 3309 Susan Dr | 0.31mi | 3/2.0 | 1,296 (0%) | 17mo | $224,000 | $173 | 71 |
| 3382 Fiskway St | 0.37mi | 3/2.0 | 1,248 (-4%) | 10mo | $169,900 | $136 | 68 |
| 3307 Keye Dr | 0.09mi | 2/2.0 (-1) | 1,144 (-12%) | 4mo | $240,000 | $210 | 68 |
| 3236 Painters St | 0.56mi | 3/2.0 | 1,250 (-4%) | 10mo | $120,000 | $96 | 60 |
| 7212 Toucan Trl | 0.16mi | 2/2.0 (-1) | 1,104 (-15%) | 5mo | $120,000 | $109 | 58 |
Match score weights: distance 35% · size 25% · config 20% · recency 20%. Top-matched comps best support the ARV.
Projected returns pro-forma
-3.0% appreciation · 0.0% rent growth · sell at horizon
- IRR
- 5.2%
- Equity multiple
- 1.20×
- Total profit
- $9,312
- Equity at exit
- $25,198
- IRR
- 12.0%
- Equity multiple
- 1.82×
- Total profit
- $38,920
- Equity at exit
- $14,612
Cash invested: $47,320 (down + closing). Projections, not guarantees.
Landlord ↔ Tenant lean methodology
- Overall (STATE)
- 87 Strongly Landlord-Friendly
- State Florida
- 87 Strongly Landlord-Friendly · R+3
- County
- — inherits STATE
- City
- — inherits STATE
ZIP-level market 34606
- Home prices YoY
- -24.7%
- Rents YoY
- -0.9%
- Active inventory
- 392
- Price-to-rent
- 6.5×
Monthly cashflow live
- Estimated rent
- $2,158 high interval (Pro) →
- Mortgage (P&I)
- −$886
- Tax from tax record
- −$72 /mo · $860/yr
- Insurance
- −$70
- HOA
- −$0
- Vacancy / Maint / Mgmt
- −$453
- Net cashflow
- $676
Break-even live
Sensitivity live
| Price | -10% $772 | -5% $724 | +0% $676 | +5% $628 | +10% $581 |
|---|---|---|---|---|---|
| Rent | -10% $506 | -5% $591 | +0% $676 | +5% $762 | +10% $847 |
| Rate | -1.0pp $761 | -0.5pp $719 | base $676 | +0.5pp $633 | +1.0pp $588 |
UW: 25.0% down · 7.5% · 30yr · 1.5% tax · 5.0% vac · 8.0% maint · 8.0% mgmt
Financing live
Cash to close
- Down payment
- $42,250
- Closing costs
- $5,070
- Reserves months
- —
- Total cash needed
- —
Loan-product check · same deal, 3 products live
Conventional
25% down · 7.5% · 30yr
- Down + closing
- —
- Monthly P&I
- —
- Monthly cashflow
- —
- DSCR
- —
- Eligible?
- —
Personal DTI + credit; lowest rate.
DSCR
20% down · 8.5% · 30yr
- Down + closing
- —
- Monthly P&I
- —
- Monthly cashflow
- —
- DSCR
- —
- Eligible?
- —
No personal income docs; deal must DSCR.
Hard money
10% down · 12.0% · 12mo
- Down + closing
- —
- Monthly P&I
- —
- Monthly cashflow
- —
- DSCR
- —
- Eligible?
- —
Short-term bridge; refi at stabilization.
Rent comps 10 comps
| Address | Beds | Baths | Sqft | Rent | $/sqft | DOM | Units | Dist |
|---|---|---|---|---|---|---|---|---|
| 7369 Sealawn Dr Spring Hill, FL | 2.0 | 2.0 | 1154 | $2,500 | $2.17 | 5d | 1 | 0.37mi |
| 7272 Apache Trl Spring Hill, FL | 3.0 | 2.0 | 1408 | $2,650 | $1.88 | 26d | 1 | 0.44mi |
| 7423 Apache Trl Spring Hill, FL | 3.0 | 2.0 | 1711 | $2,200 | $1.29 | 26d | 1 | 0.62mi |
| 7410 Cherokee Trl Spring Hill, FL | 3.0 | 2.0 | 1196 | $1,725 | $1.44 | 14d | 1 | 0.65mi |
| 7483 Apache Trl Spring Hill, FL | 3.0 | 2.0 | 1587 | $1,795 | $1.13 | 7d | 1 | 0.72mi |
| 7423 Mohawk Trl Spring Hill, FL | 3.0 | 2.0 | 1114 | $1,795 | $1.61 | 20d | 1 | 0.73mi |
| 4108 Monona Ave Spring Hill, FL | 3.0 | 2.0 | 1508 | $1,900 | $1.26 | 26d | 1 | 0.94mi |
| 3191 Deltona Blvd Spring Hill, FL | 3.0 | 2.0 | 1366 | $1,815 | $1.33 | 26d | 1 | 1.14mi |
| 4300 Bridgewater Club Loop Spring Hill, FL | 2.0–3.0 | 2.0 | 1078 | $1,484 | $1.38 | 1d | 13 | 1.21mi |
| 4398 Plumosa St Spring Hill, FL | 3.0 | 2.0 | 1646 | $1,985 | $1.21 | 26d | 1 | 1.29mi |
Listing history 13 events
-
2026-06-21days on market $169,000 Active 17 DOM
-
2026-06-18days on market $169,000 Active 14 DOM
-
2026-06-17days on market $169,000 Active 13 DOM
-
2026-06-16days on market $169,000 Active 12 DOM
-
2026-06-15days on market $169,000 Active 11 DOM
-
2026-06-13days on market $169,000 Active 9 DOM
-
2026-06-13days on market $169,000 Active 8 DOM
-
2026-06-09days on market $169,000 Active 5 DOM
-
2026-06-08days on market $169,000 Active 4 DOM
-
2026-06-08price $169,000 Active 3 DOM
-
2026-06-07days on market $189,000 Active 3 DOM
-
2026-06-04remarks 506-char remark
-
2026-06-04$189,000 Active 1 DOM
ⓘ Source: listings_history table (triggers on properties + properties_extension) + one-shot
backfill from property_details.listing_events for pre-trigger history.
Tax reassessment forecast FL · Resets to sale price
- Current annual tax
- $860 · $72/mo
- Projected year-2 tax
- $1,403 · $117/mo
- Expected delta
- +$543/yr (+$45/mo · 63.1%)
ⓘ Screening estimate from a state-policy table — verify with the county assessor before closing.
Climate risk First Street
- Flood 1/10 Low FEMA zone X (unshaded) · 0% chance over 30 yrs
- Wildfire 4/10 Moderate
- Heat 10/10 Extreme 7 d/yr ≥110°F today · 25 d/yr by 30 yrs out
- Wind 10/10 Extreme 99% chance of damaging wind over 30 yrs
- Air quality 3/10 Moderate 1 unhealthy d/yr today · 4 by 30 yrs out
Nearby sold comps map
Loading sold comps map…
Walkable amenities ~0.75 mi
Loading nearby amenities…
Taxation est. · year 1
- Rental income
- $25,893
- − Mortgage interest
- −$9,467
- − Property taxes
- −$860
- − Insurance
- −$845
- − Repairs & maintenance
- −$2,071
- − Management
- −$2,071
- − Depreciation
- −$4,916
- Taxable income
- $5,662
- Est. tax owed @ 24.0%
- −$1,359
- After-tax cash flow
- $6,757/yr
For passive investors: Depreciation is non-cash, so a rental often shows a tax loss while cash-flowing — sheltering income. Rental losses are passive: they offset passive income freely, and up to $25,000/yr can offset ordinary (W-2) income if you actively participate and your MAGI is under $100k (phasing out to $0 by $150k); unused losses carry forward. On sale, claimed depreciation is recaptured at up to 25%, and gains may owe capital-gains tax (a 1031 exchange can defer both). Figures are a year-1 estimate at your 24.0% rate — not tax advice; consult a CPA.
Schools (NCES district)
- District
- Hernando
- NCES district ID
- 1200810
- Math proficiency
- 50% ▼ -8.00%
- Reading proficiency
- 50% ▼ -4.00%
- Median HH income
- $41,985
- Composite
- 42.03/100
- National rank
- #3329
- State rank
- #38 of 73 in FL
Livability — Spring Hill
- Score
- 63/100
- State rank
- #738
- US rank
- #15937
Category grades
Schools grade is shown separately in the Schools card above.
Census & demographics
- Census place
- Spring Hill, FL
- County
- Hernando County · 169,677 people
- City population
- 83,915
- Metro
- Tampa-St. Petersburg-Clearwater, FL
- Population (ZIP)
- 28,668
- Household income
- $57,337
- Rent vs Own
- Severe rent burden
- 733.0
Population outlook (Hernando County) Hauer SSP2
- Today (2025)
- 189,218 people
- By 2030
- 194,367 · +2.7%
- By 2040
- 203,398 · +7.5%
- By 2050
- 209,589 · +10.8%
- By 2075
- 218,452 · +15.4%
- By 2100
- 205,923 · +8.8%
Race, ethnicity, and origin ACS 2023
- Neighborhood character
- Predominantly White (74%)
- Race & ethnicity
- White 74% Hispanic / Latino 16% Two or more races 13% Black 4%
- Hispanic origin (detail)
- Mexican 1% Puerto Rican 10% Cuban 2%
- Common ancestry
- Romanian 4% Lithuanian 3% Slovak 2%
- Foreign-born
- 8% · Canada, Jamaica
- Languages at home
- 87% English-only · Spanish 11% German/W. Germanic 1%
Political lean MEDSL · Hernando
- 2024 margin
- Solid R (+37.0) · D 31.1% · R 68.2%
- 2008→2024 swing
- -33.5pp toward R · 2008: -3.6pp · 2024: -37.0pp
- All cycles
- 2024: R+37.0 2020: R+30.2 2016: R+29.0 2012: R+8.5 2008: R+3.6
Not yet ingested
- Civics
- —
Market trends
- HPI YoY
- ▼ -98.11%
- Current HPI
- 298.5201
- Rent YoY
- ▼ -0.89%
- Metro
- Tampa-St. Petersburg-Clearwater, FL
- State GDP YoY
- ▲ 3.28%
- F500 in state
- 36
Industry mix (Fortune 500 HQ in FL)
| Industry | F500 HQs | Revenue |
|---|---|---|
| Industrial Technology | 2 | $29B |
|
||
| Insurance | 2 | $17B |
|
||
| Retail | 1 | $60B |
|
||
| Technology Distribution | 1 | $58B |
|
||
| Homebuilding | 1 | $35B |
|
||
| Technology Manufacturing | 1 | $35B |
|
||
Price history
+142.6% since first listed12 events — show timeline
- 2026-06-04 Listed $189,000 ForSaleByOwner.com
- 2019-11-11 Listing Removed — HCAR
- 2019-11-11 Listing Removed — HCAR
- 2011-03-22 Sold (MLS) $30,100 HCAR
- 2011-02-09 Listed $43,000 HCAR
- 2010-12-30 Listed $38,700 HCAR
- 2010-11-16 Listing Removed — HCAR
- 2010-09-17 Listed $43,000 HCAR
- 2008-08-13 Listed $39,900 HCAR
- 2005-06-13 Sold (Public Records) $82,600 Public Records
- 2005-05-30 Sold (MLS) $82,574 HCAR
- 2005-04-21 Listed $77,900 HCAR
Property tax history
+9.7%/yrLatest (2025): $860 · +2.5% YoY. Source: county tax records.
Cash-flow waterfall
monthlySold comps — $/sqft
last 12 mo · ≤1 miLoading sold comps…