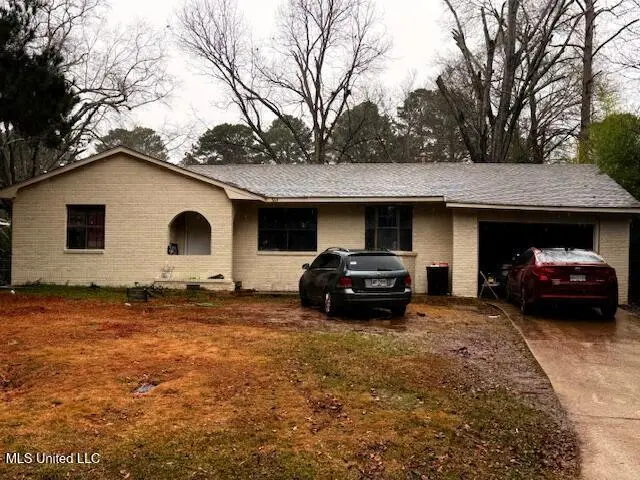
564 Woodward Ave · Jackson, MS
Flood risk 1/10 · Minimal
- FEMA flood zone
- X (unshaded)
- Chance of flooding over 30 yrs
- 0.0%
- Est. flood insurance / yr
- $507 – $1,088
Fire risk 1/10 · Minimal
- Est. fire insurance / yr
- $1,241 – $2,305
Heat risk 7/10 · Major
- Hot days now (above 108°F)
- 7 days/yr
- Hot days in 30 yrs
- 20 days/yr
Wind risk 8/10 · Major
- Chance of severe wind over 30 yrs
- 80.0%
Air-quality risk 2/10 · Minimal
- Unhealthy air days now
- 0 days/yr
- Unhealthy air days in 30 yrs
- 1 days/yr
Risk factors via First Street. Map © Google.
Why this score? — see what drove the C grade
The composite is a weighted blend of 9 inputs, each scored 0–100. Each bar is that input's sub-score; the figure is the points it added to the 100-point composite (weight × sub-score).
- Cash flow +25.1/30.0
- DSCR +8.2/10.0
- ARV discount +7.5/15.0
- 1% rule +6.3/10.0
- Livability +3.4/5.0
- Rent growth +3.2/5.0
- Condition / age +2.5/5.0
- Schools +1.1/10.0
- Appreciation +0.0/10.0
$132,000
🖨 Deal sheet 📄 Offer letter ✓ Due diligence
Listing remarks MLS
INVESTOR ALERT CASH BONANZA EXCELLENT CAST FLOW WITH TENANT IN PLACE * NO DELAYS *NO REHAB *BUY. AND HOLD IN PORTFOLIO /ANCHOR HOUSE
Key facts
- 9,583 sq ft lot
- Built 1957
- Listed 143 days
Neighborhood map
What this means for you Summary
Snapshot
- This is a 3-bed/2.0-bath single-family listed at $132k.
Deal economics
- At list price, monthly cash flow is $291 ($3k/yr) — positive.
- The deal already cash-flows at list — no discount required.
- Meets the 1% rule at list price ($1k rent vs $132k).
- Recommended offer: $116k (12.0% below list) — sets the bar for market timing.
Location & tenants
- Location reads 68/100 on livability (#66 in MS) — a middle-class / working-renter tenant base. Strengths: commute A+, cost of living A+, housing A+; Watch: schools F, amenities F, employment F.
- Jackson Public School District (urban): math 9% / reading 18% proficiency, ranked #112 of 130 in MS (top 86%) — low school quality limits family demand, transient renter base, plan for 1-2y turnover; 88% free/reduced lunch — lower-income household profile, screen leases tightly.
- Market conditions: Rents rising (+2.8%/yr); 119 active listings in the ZIP; 28 comparable units currently listed for rent nearby; rentals at typical pace (median 24d on market — plan ~3-4 weeks tenant-placement turnaround); lower-income renter base — watch delinquency; 167 units permitted in Hinds County in 2024 (0 in 5+ unit buildings).
- This rent runs 42% of the median local income ($43k/yr) — at the standard rent-burdened threshold; future hikes will face affordability resistance.
Forward outlook
- Local home prices are declining (-3.0%/yr); year-one equity from $913 of loan paydown is wiped out by about $4k of value loss. Plan a longer hold.
- Hinds County population projected to shrink 6% by 2050 — rents likely to lag national; underwrite the cash flow, not the appreciation.
Negotiation context
- It's been on market 143 days — a 12% lower offer ($116k) is reasonable based on typical stale-listing flexibility.
- 5 sale attempts since 7y ago with the ask held roughly flat each time — persistent listings suggest the price (not the market) is what's stuck; bring a comps-based counter.
Risks & watch-outs
- Watch-outs: built in 1957 — expect roof / HVAC / electrical / plumbing capex.
- Climate carrying-cost: severe wind risk, 80% chance of damaging wind over 30y; extreme-heat days projected 7→20/yr by 2055 (HVAC capex compounding) — expect insurance premiums to compound above CPI over the hold.
Questions for the listing agent
- It's been on market 143 days. Have you received any prior offers? Is the seller open to a 12% concession, seller financing, or rate buy-down credit?
- Built in 1957 — when were the roof, HVAC, electrical panel, plumbing, and water heater last replaced?
- Why hasn't it sold? Are there any deal-killer items the seller is aware of (foundation, flood, title, zoning, code violations)?
- Is there a deadline driving the sale (1031 exchange, divorce, estate, relocation)? That informs how much negotiation room exists.
- Schools are F-rated, which usually means shorter tenancies and higher turnover. Who's the typical renter profile here, and what's been the actual vacancy rate?
- What's the average days-on-market for RENTAL listings here right now (not sales)? A rising rental-DOM trend means longer vacancies and softer asking-rent achievability than the comps imply.
- What's the recent tenant-quality profile in this submarket — average credit score on applications, eviction rate, late-payment / NSF rate, and stable-employment percentage? A property-management company in the area should have these aggregated.
- How much new for-sale + rental construction is in the pipeline within 1–3 miles? Heavy new supply typically softens prices + rents 12–24 months out; constrained supply supports both.
Investment metrics
- 1% rule
- 1.13% ✓
- Cap rate
- 8.94%
- Cash-on-cash
- 9.44%
- DSCR
- 1.42
- GRM
- 7.4
CMA / ARV
- ARV (median comp)
- $84,933
- List price
- $132,000
- Delta
- 55.42%
- Verdict
- OVERPRICED
- Comps
- 20 within 1.0 mi
Show comp detail 12 sales within ~0.75 mi
| Address | Dist | Beds/Ba | Sqft | Sold | Price | $/sf | Match |
|---|---|---|---|---|---|---|---|
| 670 Piermont St | 0.14mi | 4/2.0 (+1) | 1,467 (+6%) | 3mo | $79,900 | $54 | 76 |
| 684 Heather Ln | 0.34mi | 3/1.5 | 1,400 (+1%) | 6mo | $50,000 | $36 | 76 |
| 947 Witsell Rd | 0.46mi | 3/2.0 | 1,300 (-6%) | 2mo | $165,000 | $127 | 66 |
| 958 Watkins Pl | 0.46mi | 3/2.0 | 1,316 (-5%) | 4mo | $31,200 | $24 | 66 |
| 130 Wacker Dr | 0.55mi | 3/1.0 | 1,302 (-6%) | 1mo | $35,000 | $27 | 60 |
| 216 Pine Ridge Rd | 0.65mi | 3/1.5 | 1,421 (+3%) | 5mo | $124,900 | $88 | 59 |
| 4025 Carol Dr | 0.62mi | 3/2.0 | 1,316 (-5%) | 7mo | $67,500 | $51 | 57 |
| 729 Heather Ln | 0.32mi | 3/1.0 | 1,570 (+13%) | 6mo | $70,000 | $45 | 54 |
| 4560 Kirkley Cir | 0.34mi | 4/2.5 (+1) | 1,585 (+14%) | 4mo | $139,900 | $88 | 50 |
| 134 Wacker Dr | 0.53mi | 3/1.0 | 1,218 (-12%) | 6mo | $70,000 | $57 | 46 |
| 4692 Nordell Dr | 0.72mi | 4/2.0 (+1) | 1,496 (+8%) | 5mo | $158,000 | $106 | 44 |
| 4189 Del Rosa Dr | 0.66mi | 4/2.0 (+1) | 1,550 (+12%) | 7mo | $83,000 | $54 | 38 |
Match score weights: distance 35% · size 25% · config 20% · recency 20%. Top-matched comps best support the ARV.
Projected returns pro-forma
-3.0% appreciation · 2.83% rent growth · sell at horizon
- IRR
- -2.2%
- Equity multiple
- 0.92×
- Total profit
- $-3,109
- Equity at exit
- $19,682
- IRR
- 7.3%
- Equity multiple
- 1.54×
- Total profit
- $20,143
- Equity at exit
- $11,413
Cash invested: $36,960 (down + closing). Projections, not guarantees.
Landlord ↔ Tenant lean methodology
- Overall (STATE)
- 90 Strongly Landlord-Friendly
- State Mississippi
- 90 Strongly Landlord-Friendly · R+11
- County
- — inherits STATE
- City
- — inherits STATE
ZIP-level market 39206
- Home prices YoY
- -10.3%
- Rents YoY
- 2.8%
- Active inventory
- 119
- Price-to-rent
- 7.4×
Monthly cashflow live
- Estimated rent
- $1,495 high interval (Pro) →
- Mortgage (P&I)
- −$692
- Tax from tax record
- −$143 /mo · $1,715/yr
- Insurance
- −$55
- HOA
- −$0
- Vacancy / Maint / Mgmt
- −$314
- Net cashflow
- $291
Break-even live
UW: 25.0% down · 7.5% · 30yr · 1.5% tax · 5.0% vac · 8.0% maint · 8.0% mgmt
Financing live
Cash to close
- Down payment
- $33,000
- Closing costs
- $3,960
- Reserves months
- —
- Total cash needed
- —
Loan-product check · same deal, 3 products live
Conventional
25% down · 7.5% · 30yr
- Down + closing
- —
- Monthly P&I
- —
- Monthly cashflow
- —
- DSCR
- —
- Eligible?
- —
Personal DTI + credit; lowest rate.
DSCR
20% down · 8.5% · 30yr
- Down + closing
- —
- Monthly P&I
- —
- Monthly cashflow
- —
- DSCR
- —
- Eligible?
- —
No personal income docs; deal must DSCR.
Hard money
10% down · 12.0% · 12mo
- Down + closing
- —
- Monthly P&I
- —
- Monthly cashflow
- —
- DSCR
- —
- Eligible?
- —
Short-term bridge; refi at stabilization.
Rent comps 28 comps
| Address | Beds | Baths | Sqft | Rent | $/sqft | DOM | Units | Dist |
|---|---|---|---|---|---|---|---|---|
| 815 Berwood Dr Jackson, MS | 3.0 | 2.0 | 1248 | $1,300 | $1.04 | 43d | 1 | 0.34mi |
| 612 Heather Ln Jackson, MS | 4.0 | 2.0 | 1642 | $1,675 | $1.02 | 23d | 1 | 0.37mi |
| 963 Pine Lake Dr Jackson, MS | 3.0 | 1.5 | 1196 | $1,050 | $0.88 | 43d | 1 | 0.56mi |
| 4833 N State St Jackson, MS | 3.0 | 2.0 | 994 | $1,195 | $1.20 | 43d | 1 | 0.66mi |
| 3811 Mosley Ave Jackson, MS | 2.0 | 1.0 | 1000 | $1,095 | $1.09 | 21d | 1 | 0.80mi |
| 200 Stillwood Dr Jackson, MS | 3.0 | 2.0 | 1088 | $1,300 | $1.19 | 13d | 1 | 0.80mi |
| 200 Stillwood Dr Jackson, MS | 3.0 | 2.0 | 1088 | $1,300 | $1.19 | 43d | 1 | 0.80mi |
| 533 Stillwood Dr Jackson, MS | 2.0 | 1.0 | 906 | $820 | $0.91 | 13d | 1 | 0.86mi |
| 4426 Desoto St Jackson, MS | 3.0 | 1.0 | 1079 | $1,250 | $1.16 | 13d | 1 | 0.88mi |
| 4426 Desoto St Jackson, MS | 3.0 | 1.0 | 1079 | $1,250 | $1.16 | 23d | 1 | 0.88mi |
| 3718 Northbrook Dr Jackson, MS | 2.0 | 1.0 | 942 | $1,050 | $1.11 | 23d | 1 | 0.88mi |
| 214 Melbourne Rd Jackson, MS | 3.0 | 2.0 | 1207 | $1,500 | $1.24 | 43d | 1 | 0.88mi |
| 220 Melbourne Rd Jackson, MS | 4.0 | 2.0 | 1744 | $1,350 | $0.77 | 43d | 1 | 0.89mi |
| 320 Lawrence Rd Jackson, MS | 4.0 | 1.5 | 1270 | $1,400 | $1.10 | 23d | 1 | 0.95mi |
| 320 Lawrence Rd Jackson, MS | 4.0 | 2.0 | 1270 | $1,400 | $1.10 | 13d | 1 | 0.95mi |
| 4858 Sheridan Dr Jackson, MS | 3.0 | 2.0 | 1300 | $1,550 | $1.19 | 23d | 1 | 0.97mi |
| 341 E Northside Dr Jackson, MS | 4.0 | 2.0 | 1732 | $1,775 | $1.02 | 23d | 1 | 1.00mi |
| 508 Benning Rd Jackson, MS | 4.0 | 2.0 | 1216 | $1,400 | $1.15 | 13d | 1 | 1.01mi |
| 508 Benning Rd Jackson, MS | 4.0 | 2.0 | 1216 | $1,400 | $1.15 | 43d | 1 | 1.01mi |
| 521 Launcelot Rd Jackson, MS | 3.0 | 2.0 | 1346 | $1,423 | $1.06 | 43d | 1 | 1.06mi |
| 701 Cedarhurst Dr Jackson, MS | 4.0 | 2.0 | 1419 | $1,250 | $0.88 | 23d | 1 | 1.19mi |
| 4091 Pine Hill Dr Jackson, MS | 3.0 | 2.0 | 1551 | $3,000 | $1.93 | 23d | 1 | 1.24mi |
| 5255 Manhattan Rd Jackson, MS | 1.0–2.0 | 1.0–2.0 | 813 | $1,100 | $1.35 | 13d | 1 | 1.33mi |
| 4220 Council Cir Jackson, MS | 3.0 | 2.5 | 1780 | $1,850 | $1.04 | 23d | 1 | 1.38mi |
| 724 Meadowbrook Rd Jackson, MS | 3.0 | 2.0 | 1593 | $2,150 | $1.35 | 43d | 1 | 1.38mi |
| 4056 Redwing Ave Jackson, MS | 3.0 | 2.0 | 1678 | $1,850 | $1.10 | 43d | 1 | 1.41mi |
| 4627 Estelle Dr Jackson, MS | 3.0 | 2.0 | 1489 | $1,475 | $0.99 | 23d | 1 | 1.42mi |
| 5421 Crepe Myrtle Dr Jackson, MS | 4.0 | 1.5 | 1079 | $1,295 | $1.20 | 23d | 1 | 1.47mi |
Listing history 29 events
-
2026-06-18days on market $132,000 Active 143 DOM
-
2026-06-17days on market $132,000 Active 142 DOM
-
2026-06-16days on market $132,000 Active 141 DOM
-
2026-06-15days on market $132,000 Active 140 DOM
-
2026-06-14days on market $132,000 Active 138 DOM
-
2026-06-13days on market $132,000 Active 137 DOM
-
2026-06-10days on market $132,000 Active 135 DOM
-
2026-06-09days on market $132,000 Active 134 DOM
-
2026-06-08days on market $132,000 Active 133 DOM
-
2026-06-07days on market $132,000 Active 132 DOM
-
2026-06-05days on market $132,000 Active 129 DOM
-
2026-06-03days on market $132,000 Active 128 DOM
-
2026-06-02days on market $132,000 Active 127 DOM
-
2026-06-01days on market $132,000 Active 126 DOM
-
2026-05-31days on market $132,000 Active 125 DOM
-
2026-05-30days on market $132,000 Active 124 DOM
-
2026-05-02status Active 145-char remark
Show marketing remark (145 chars)
INVESTOR ALERT CASH BONANZA EXCELLENT CAST FLOW WITH TENANT IN PLACE * NO DELAYS *NO REHAB *BUY. AND HOLD IN PORTFOLIO /ANCHOR HOUSE
-
2026-04-30historical 145-char remark
Show marketing remark (145 chars)
INVESTOR ALERT CASH BONANZA EXCELLENT CAST FLOW WITH TENANT IN PLACE * NO DELAYS *NO REHAB *BUY. AND HOLD IN PORTFOLIO /ANCHOR HOUSE
-
2026-01-24$132,000 Active 145-char remark
Show marketing remark (145 chars)
INVESTOR ALERT CASH BONANZA EXCELLENT CAST FLOW WITH TENANT IN PLACE * NO DELAYS *NO REHAB *BUY. AND HOLD IN PORTFOLIO /ANCHOR HOUSE
-
2025-12-29historical
-
2025-10-28$140,000 Active
-
2023-09-08soldstatus Closed
-
2023-08-31soldstatus
-
2023-08-17status Pending
-
2023-08-08$110,000 Active
-
2020-01-14soldstatus
-
2020-01-10soldstatus
-
2019-12-21$19,900
-
1973-02-23soldstatus
ⓘ Source: listings_history table (triggers on properties + properties_extension) + one-shot
backfill from property_details.listing_events for pre-trigger history.
Tax reassessment forecast MS · Resets to sale price
- Current annual tax
- $1,715 · $143/mo
- Projected year-2 tax
- $1,715 · $143/mo
- Expected delta
- $0/yr ($0/mo · 0.0%)
ⓘ Screening estimate from a state-policy table — verify with the county assessor before closing.
Climate risk First Street
- Flood 1/10 Low FEMA zone X (unshaded) · 0% chance over 30 yrs
- Wildfire 1/10 Low
- Heat 7/10 Severe 7 d/yr ≥108°F today · 20 d/yr by 30 yrs out
- Wind 8/10 Severe 80% chance of damaging wind over 30 yrs
- Air quality 2/10 Low 0 unhealthy d/yr today · 1 by 30 yrs out
Nearby sold comps map
Loading sold comps map…
Walkable amenities ~0.75 mi
Loading nearby amenities…
Taxation est. · year 1
- Rental income
- $17,940
- − Mortgage interest
- −$7,394
- − Property taxes
- −$1,715
- − Insurance
- −$660
- − Repairs & maintenance
- −$1,435
- − Management
- −$1,435
- − Depreciation
- −$3,840
- Taxable income
- $1,460
- Est. tax owed @ 24.0%
- −$350
- After-tax cash flow
- $3,140/yr
For passive investors: Depreciation is non-cash, so a rental often shows a tax loss while cash-flowing — sheltering income. Rental losses are passive: they offset passive income freely, and up to $25,000/yr can offset ordinary (W-2) income if you actively participate and your MAGI is under $100k (phasing out to $0 by $150k); unused losses carry forward. On sale, claimed depreciation is recaptured at up to 25%, and gains may owe capital-gains tax (a 1031 exchange can defer both). Figures are a year-1 estimate at your 24.0% rate — not tax advice; consult a CPA.
Schools (NCES district)
- District
- Jackson Public School District
- NCES district ID
- 2802190
- Math proficiency
- 9% ▼ -14.00%
- Reading proficiency
- 18% ▼ -7.00%
- Median HH income
- $33,234
- Composite
- 10.89/100
- National rank
- #9755
- State rank
- #112 of 130 in MS
Livability — Jackson
- Score
- 68/100
- State rank
- #66
- US rank
- #9695
Category grades
Schools grade is shown separately in the Schools card above.
Census & demographics
- Census place
- Jackson, MS
- County
- Hinds County · 167,040 people
- City population
- 140,204
- Metro
- Jackson, MS
- Population (ZIP)
- 23,257
- Household income
- $42,686
- Rent vs Own
- Severe rent burden
- 1554.0
Population outlook (Hinds County) Hauer SSP2
- Today (2025)
- 242,528 people
- By 2030
- 241,113 · -0.6%
- By 2040
- 235,557 · -2.9%
- By 2050
- 226,946 · -6.4%
- By 2075
- 199,995 · -17.5%
- By 2100
- 164,165 · -32.3%
Race, ethnicity, and origin ACS 2023
- Neighborhood character
- Predominantly Black (85%)
- Race & ethnicity
- Black 85% White 9% Hispanic / Latino 3% Two or more races 3%
- Common ancestry
- Italian 1%
- Foreign-born
- 2% · Canada
- Languages at home
- 96% English-only · Spanish 3%
Political lean MEDSL · Hinds
- 2024 margin
- Solid D (+46.1) · D 72.4% · R 26.3% · Other 1.4%
- 2008→2024 swing
- +7.1pp toward D · 2008: 39.0pp · 2024: 46.1pp
- All cycles
- 2024: D+46.1 2020: D+48.3 2016: D+43.7 2012: D+45.1 2008: D+39.0
Not yet ingested
- Civics
- —
Market trends
- HPI YoY
- ▼ -22.38%
- Current HPI
- 194.5873
- Rent YoY
- ▲ 2.83%
- Metro
- Jackson, MS
- State GDP YoY
- —
- F500 in state
- 0
Price history
+563.3% since first listed13 events — show timeline
- 2026-05-02 Relisted — MLSU
- 2026-04-30 Listing Removed — MLSU
- 2026-01-24 Listed $132,000 MLSU
- 2025-12-29 Listing Removed — MLSU
- 2025-10-28 Listed $140,000 MLSU
- 2023-09-08 Sold (MLS) — MLSU
- 2023-08-31 Sold (Public Records) — Public Records
- 2023-08-17 Pending — MLSU
- 2023-08-08 Listed $110,000 MLSU
- 2020-01-14 Sold (MLS) — MLSU
- 2020-01-10 Sold (Public Records) — Public Records
- 2019-12-21 Listed $19,900 MLSU
- 1973-02-23 Sold (Public Records) — Public Records
Property tax history
+1.1%/yrLatest (2025): $1,715 · +2.5% YoY. Source: county tax records.
Cash-flow waterfall
monthlySold comps — $/sqft
last 12 mo · ≤1 miLoading sold comps…