 7-Plex
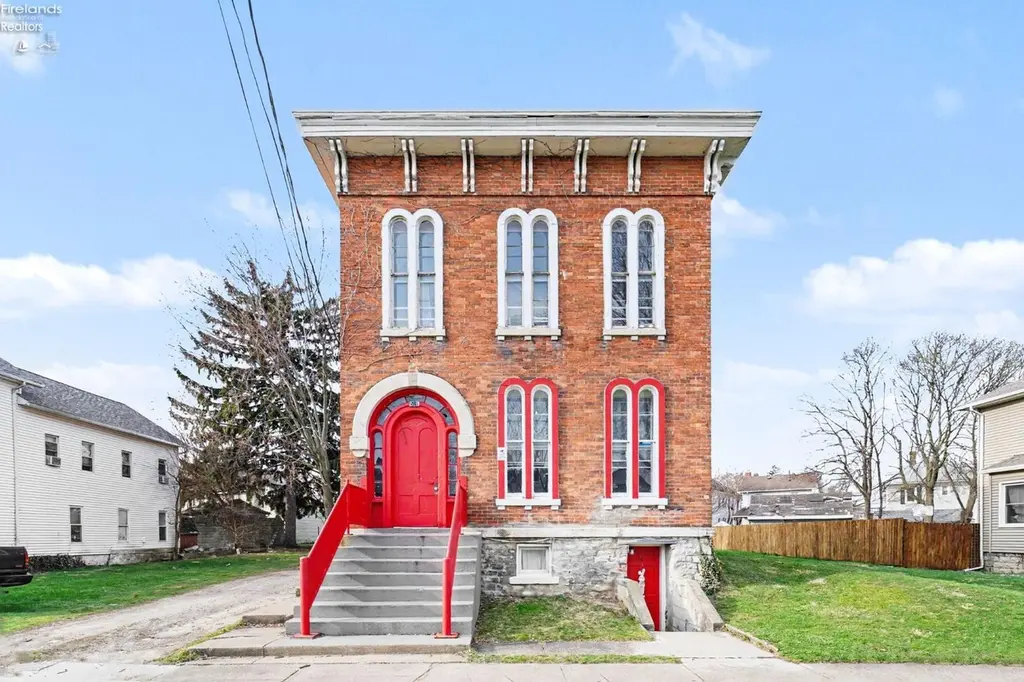
519 Huron Ave Ave · Sandusky, OH
Flood risk 1/10 · Minimal
- FEMA flood zone
- X (unshaded)
- Chance of flooding over 30 yrs
- 0.0%
- Est. flood insurance / yr
- $473 – $860
Fire risk 1/10 · Minimal
- Est. fire insurance / yr
- $713 – $1,323
Heat risk 3/10 · Minor
- Hot days now (above 94°F)
- 7 days/yr
- Hot days in 30 yrs
- 16 days/yr
Wind risk 2/10 · Minimal
- Chance of severe wind over 30 yrs
- —
Air-quality risk 3/10 · Minor
- Unhealthy air days now
- 2 days/yr
- Unhealthy air days in 30 yrs
- 3 days/yr
Risk factors via First Street. Map © Google.
Why this score? — see what drove the B- grade
The composite is a weighted blend of 9 inputs, each scored 0–100. Each bar is that input's sub-score; the figure is the points it added to the 100-point composite (weight × sub-score).
- Cash flow +30.0/30.0
- 1% rule +10.0/10.0
- DSCR +10.0/10.0
- ARV discount +7.5/15.0
- Livability +4.2/5.0
- Rent growth +2.5/5.0
- Schools +2.5/10.0
- Condition / age +2.5/5.0
- Appreciation +0.0/10.0
$428,500
🖨 Deal sheet (PDF) 📄 Offer letter ✓ Due diligence
Multi-family units
County records classify this as Multi-Family (5+ Unit). Listing-text estimate: 7 units. confirmed
5+ unit building — per-unit beds/baths from public records are typically unavailable; the breakdown below (if shown) is an estimate from the listing text.
Listing remarks MLS
7-unit historic brick multifamily building in downtown Sandusky, Ohio. Featuring a mix of two 2-bedroom, two 1-bedroom, and three efficiency units with large rear parking. Major capital improvements already completed including a new roof in 2024 and four new furnaces in 2023, with cosmetic updates throughout most units. Professionally managed and truly turnkey for the next owner.
Key facts
- Four new furnaces
- Large rear parking
- Cosmetic updates
Tags
Neighborhood map
What this means for you Summary
Snapshot
- This is a 2×2bd/1ba + 5×1bd/1ba units multifamily listed at $428k.
Deal economics
- At list price, monthly cash flow is $4k ($47k/yr) — positive. Per door: $554/mo.
- The deal already cash-flows at list — no discount required.
- Meets the 1% rule at list price ($9k rent vs $428k).
- Recommended offer: $403k (6.0% below list) — sets the bar for market timing.
- Cap rate 17.2% vs local median 6.1% in Sandusky — top-decile yield for the area; either an underpriced asset or a hidden risk that comps aren't pricing in. Stress-test before assuming the spread holds.
Location & tenants
- Location reads 83/100 on livability (#63 in OH, #929 nationally) — a professional / high-income tenant draw. Strengths: commute A+, cost of living A+, housing A+; Watch: crime D-, employment F.
- Sandusky City (town): math 24% / reading 37% proficiency, ranked #583 of 656 in OH (top 89%) — families likely to look elsewhere, expect single-tenant / working-renter base with shorter leases; 71% free/reduced lunch — lower-income household profile, screen leases tightly.
- Zoned schools: The Sandusky Intermediate School (math 26% / reading 38%, grade F, #1,135 of 1,584 statewide, top 73%, 909 students, 0% FRL); Sandusky Middle School (math 25% / reading 32%, grade F, #580 of 654 statewide, top 89%, 468 students, 0% FRL); Sandusky High School (math 17% / reading 41%, grade F, #627 of 781 statewide, top 81%, 1,004 students, 0% FRL) — zoned schools average 0% FRL vs 71% district-wide (71 pts lower); this property's tenant base skews higher-income than the district average.
- Market conditions: 210 active listings in the ZIP; 128 units permitted in Erie County in 2024 (5 in 5+ unit buildings).
- At $8,698/mo this rent would consume 168% of the median local household income ($62k/yr) (locally 1602% of renters already pay >50% of income on rent) — very limited rent-growth headroom before tenants either downsize or default.
Forward outlook
- Local home prices are declining (-3.0%/yr); year-one equity from $3k of loan paydown is wiped out by about $13k of value loss. Plan a longer hold.
- Erie County population projected at -15% by 2050 — secular population decline; favor cash flow + early exit over multi-decade hold.
- At projected returns (-3.0% appreciation + 3.0% rent growth), your $120k cash investment doubles in ~4 years — after that, you're playing with house money.
Negotiation context
- It's been on market 80 days — a 6% lower offer ($403k) is reasonable based on typical stale-listing flexibility.
- 4 sale attempts since 7y ago with the ask held roughly flat each time — persistent listings suggest the price (not the market) is what's stuck; bring a comps-based counter.
- Current owner paid $359k; 19% above their basis — modest negotiation headroom, anchor on the comps not their cost.
Risks & watch-outs
- Watch-outs: built in 1900 — expect roof / HVAC / electrical / plumbing capex.
Questions for the listing agent
- It's been on market 80 days. Have you received any prior offers? Is the seller open to a 6% concession, seller financing, or rate buy-down credit?
- Can we see the unit-by-unit rent roll, current vacancy, and any below-market leases? What's the average tenancy length?
- What capital expenditures (roof, boiler, parking lot, exteriors) have been made in the last 5 years, and what's planned in the next 2?
- Built in 1900 — when were the roof, HVAC, electrical panel, plumbing, and water heater last replaced?
- Why hasn't it sold? Are there any deal-killer items the seller is aware of (foundation, flood, title, zoning, code violations)?
- Is there a deadline driving the sale (1031 exchange, divorce, estate, relocation)? That informs how much negotiation room exists.
- Crime grade is D in this area — have there been break-ins, vandalism, or insurance claims at this property in the last 3 years? What carrier currently insures it and at what premium?
- What's the average days-on-market for RENTAL listings here right now (not sales)? A rising rental-DOM trend means longer vacancies and softer asking-rent achievability than the comps imply.
- What's the recent tenant-quality profile in this submarket — average credit score on applications, eviction rate, late-payment / NSF rate, and stable-employment percentage? A property-management company in the area should have these aggregated.
- How much new apartment / multifamily construction is in the pipeline within 1–3 miles? Heavy new supply (>2% of stock underway) typically softens rents 12–24 months out; light construction supports rent growth.
Investment metrics
- 1% rule
- 2.03% ✓
- Cap rate
- 17.16%
- Cash-on-cash
- 38.79%
- DSCR
- 2.73
- GRM
- 4.1
CMA / ARV
- ARV (median comp)
- $197,297
- List price
- $428,500
- Delta
- 117.19%
- Verdict
- OVERPRICED
- Comps
- 7 within 1.0 mi
Show comp detail 3 sales within ~0.75 mi
| Address | Dist | Beds/Ba | Sqft | Sold | Price | $/sf | Match |
|---|---|---|---|---|---|---|---|
| 310 Hancock Unit 1-4 | 0.20mi | —/— | 4,260 (+15%) | 10mo | $221,000 | $52 | 58 |
| 1110 Third St St | 0.62mi | —/— | 3,314 (-11%) | 1mo | $310,000 | $94 | 53 |
| 313 Lawrence St | 0.63mi | —/— | 3,199 (-14%) | 10mo | $125,000 | $39 | 40 |
Match score weights: distance 35% · size 25% · config 20% · recency 20%. Top-matched comps best support the ARV.
Projected returns pro-forma
-3.0% appreciation · 3.0% rent growth · sell at horizon
- IRR
- 35.0%
- Equity multiple
- 2.48×
- Total profit
- $177,755
- Equity at exit
- $63,891
- IRR
- 41.8%
- Equity multiple
- 4.95×
- Total profit
- $473,501
- Equity at exit
- $37,049
Cash invested: $119,980 (down + closing). Projections, not guarantees.
Landlord ↔ Tenant lean methodology
- Overall (STATE)
- 73 Landlord-Friendly
- State Ohio
- 73 Landlord-Friendly · R+6
- County
- — inherits STATE
- City
- — inherits STATE
ZIP-level market 44870
- Active inventory
- 210
- Price-to-rent
- 22.2×
Monthly cashflow live
- Estimated rent
- $8,698 medium interval (Pro) →
- Mortgage (P&I)
- −$2,247
- Tax from tax record
- −$567 /mo · $6,804/yr
- Insurance
- −$179
- HOA
- −$0
- Vacancy / Maint / Mgmt
- −$1,827
- Net cashflow
- $3,879
Break-even live
Sensitivity live
| Price | -10% $4,121 | -5% $4,000 | +0% $3,879 | +5% $3,757 | +10% $3,636 |
|---|---|---|---|---|---|
| Rent | -10% $3,192 | -5% $3,535 | +0% $3,879 | +5% $4,222 | +10% $4,566 |
| Rate | -1.0pp $4,095 | -0.5pp $3,988 | base $3,879 | +0.5pp $3,768 | +1.0pp $3,655 |
7-unit breakdown (identical units grouped — click to expand)
| Units | Beds | Baths | Est. rent |
|---|---|---|---|
| 2× units | 2 | 1 | $3,212 |
| #1 | 2 | 1 | $1,606 |
| #2 | 2 | 1 | $1,606 |
| 5× units | 1 | 1 | $5,485 |
| #3 | 1 | 1 | $1,097 |
| #4 | 1 | 1 | $1,097 |
| #5 | 1 | 1 | $1,097 |
| #6 | 1 | 1 | $1,097 |
| #7 | 1 | 1 | $1,097 |
| Total (7 units) | $8,698 | ||
UW: 25.0% down · 7.5% · 30yr · 1.5% tax · 5.0% vac · 8.0% maint · 8.0% mgmt
Financing live
Cash to close
- Down payment
- $107,125
- Closing costs
- $12,855
- Reserves months
- —
- Total cash needed
- —
Loan-product check · same deal, 3 products live
Conventional
25% down · 7.5% · 30yr
- Down + closing
- —
- Monthly P&I
- —
- Monthly cashflow
- —
- DSCR
- —
- Eligible?
- —
Personal DTI + credit; lowest rate.
DSCR
20% down · 8.5% · 30yr
- Down + closing
- —
- Monthly P&I
- —
- Monthly cashflow
- —
- DSCR
- —
- Eligible?
- —
No personal income docs; deal must DSCR.
Hard money
10% down · 12.0% · 12mo
- Down + closing
- —
- Monthly P&I
- —
- Monthly cashflow
- —
- DSCR
- —
- Eligible?
- —
Short-term bridge; refi at stabilization.
Listing history 29 events
-
2026-06-21days on market $428,500 Active 80 DOM
-
2026-06-19days on market $428,500 Active 78 DOM
-
2026-06-18days on market $428,500 Active 77 DOM
-
2026-06-17days on market $428,500 Active 76 DOM
-
2026-06-16days on market $428,500 Active 75 DOM
-
2026-06-15days on market $428,500 Active 74 DOM
-
2026-06-14days on market $428,500 Active 72 DOM
-
2026-06-12pricedays on market $428,500 Active 71 DOM
-
2026-06-09days on market $433,500 Active 68 DOM
-
2026-06-08days on market $433,500 Active 67 DOM
-
2026-06-07days on market $433,500 Active 66 DOM
-
2026-06-03days on market $433,500 Active 62 DOM
-
2026-06-02days on market $433,500 Active 61 DOM
-
2026-06-01days on market $433,500 Active 60 DOM
-
2026-05-31days on market $433,500 Active 59 DOM
-
2026-05-30days on market $433,500 Active 58 DOM
-
2026-05-08price $433,500 382-char remark
Show marketing remark (382 chars)
7-unit historic brick multifamily building in downtown Sandusky, Ohio. Featuring a mix of two 2-bedroom, two 1-bedroom, and three efficiency units with large rear parking. Major capital improvements already completed including a new roof in 2024 and four new furnaces in 2023, with cosmetic updates throughout most units. Professionally managed and truly turnkey for the next owner.
-
2026-05-01price $436,500 382-char remark
Show marketing remark (382 chars)
7-unit historic brick multifamily building in downtown Sandusky, Ohio. Featuring a mix of two 2-bedroom, two 1-bedroom, and three efficiency units with large rear parking. Major capital improvements already completed including a new roof in 2024 and four new furnaces in 2023, with cosmetic updates throughout most units. Professionally managed and truly turnkey for the next owner.
-
2026-04-16price $439,000 382-char remark
Show marketing remark (382 chars)
7-unit historic brick multifamily building in downtown Sandusky, Ohio. Featuring a mix of two 2-bedroom, two 1-bedroom, and three efficiency units with large rear parking. Major capital improvements already completed including a new roof in 2024 and four new furnaces in 2023, with cosmetic updates throughout most units. Professionally managed and truly turnkey for the next owner.
-
2026-04-02$449,000 Active 382-char remark
Show marketing remark (382 chars)
7-unit historic brick multifamily building in downtown Sandusky, Ohio. Featuring a mix of two 2-bedroom, two 1-bedroom, and three efficiency units with large rear parking. Major capital improvements already completed including a new roof in 2024 and four new furnaces in 2023, with cosmetic updates throughout most units. Professionally managed and truly turnkey for the next owner.
-
2023-06-09soldstatus $359,000 Closed 657-char remark
Show marketing remark (657 chars)
UPDATED HISTORIC 7 UNIT DOWNTOWN SANDUSKY! Don't miss out on this great investment property, priced to sell. On the National Registry of Historic Buildings, this brick building has some newer vinyl windows, newly sealed roof, 4 brand new furnaces, new flooring and fixtures throughout all units all 7 units. 2- 2 bedroom units, 2-1 bedroom units and 3 efficiencies. 2 1/2 levels of living space with approximately just under 5000 square feet. Owner pays all utilities, all tenants currently in lease. Building is fully occupied, we will be scheduling showing in blocks. SHOWING - Saturday April 15th 12;00 to 2:00 pm. No need to register before the showing.
-
2023-04-17historical Active Under Contract 657-char remark
Show marketing remark (657 chars)
UPDATED HISTORIC 7 UNIT DOWNTOWN SANDUSKY! Don't miss out on this great investment property, priced to sell. On the National Registry of Historic Buildings, this brick building has some newer vinyl windows, newly sealed roof, 4 brand new furnaces, new flooring and fixtures throughout all units all 7 units. 2- 2 bedroom units, 2-1 bedroom units and 3 efficiencies. 2 1/2 levels of living space with approximately just under 5000 square feet. Owner pays all utilities, all tenants currently in lease. Building is fully occupied, we will be scheduling showing in blocks. SHOWING - Saturday April 15th 12;00 to 2:00 pm. No need to register before the showing.
-
2023-04-10$364,900 Active 657-char remark
Show marketing remark (657 chars)
UPDATED HISTORIC 7 UNIT DOWNTOWN SANDUSKY! Don't miss out on this great investment property, priced to sell. On the National Registry of Historic Buildings, this brick building has some newer vinyl windows, newly sealed roof, 4 brand new furnaces, new flooring and fixtures throughout all units all 7 units. 2- 2 bedroom units, 2-1 bedroom units and 3 efficiencies. 2 1/2 levels of living space with approximately just under 5000 square feet. Owner pays all utilities, all tenants currently in lease. Building is fully occupied, we will be scheduling showing in blocks. SHOWING - Saturday April 15th 12;00 to 2:00 pm. No need to register before the showing.
-
2019-12-18soldstatus $22,123
-
2019-12-18soldstatus $22,123 Closed
-
2019-11-19historical
-
2019-06-25$19,900
-
2019-06-25$19,900
-
1995-07-28soldstatus $60,000
ⓘ Source: listings_history table (triggers on properties + properties_extension) + one-shot
backfill from property_details.listing_events for pre-trigger history.
Tax reassessment forecast OH · Partial reset (capped growth)
- Current annual tax
- $6,804 · $567/mo
- Projected year-2 tax
- $6,804 · $567/mo
- Expected delta
- $0/yr ($0/mo · -0.0%)
ⓘ Screening estimate from a state-policy table — verify with the county assessor before closing.
Climate risk First Street
- Flood 1/10 Low FEMA zone X (unshaded) · 0% chance over 30 yrs
- Wildfire 1/10 Low
- Heat 3/10 Moderate 7 d/yr ≥94°F today · 16 d/yr by 30 yrs out
- Wind 2/10 Low
- Air quality 3/10 Moderate 2 unhealthy d/yr today · 3 by 30 yrs out
Nearby sold comps map
Loading sold comps map…
Walkable amenities ~0.75 mi
Loading nearby amenities…
Taxation est. · year 1
- Rental income
- $104,376
- − Mortgage interest
- −$24,003
- − Property taxes
- −$6,804
- − Insurance
- −$2,142
- − Repairs & maintenance
- −$8,350
- − Management
- −$8,350
- − Depreciation
- −$12,465
- Taxable income
- $42,261
- Est. tax owed @ 24.0%
- −$10,143
- After-tax cash flow
- $36,402/yr
For passive investors: Depreciation is non-cash, so a rental often shows a tax loss while cash-flowing — sheltering income. Rental losses are passive: they offset passive income freely, and up to $25,000/yr can offset ordinary (W-2) income if you actively participate and your MAGI is under $100k (phasing out to $0 by $150k); unused losses carry forward. On sale, claimed depreciation is recaptured at up to 25%, and gains may owe capital-gains tax (a 1031 exchange can defer both). Figures are a year-1 estimate at your 24.0% rate — not tax advice; consult a CPA.
Schools (NCES district)
- District
- Sandusky City
- NCES district ID
- 3904474
- Math proficiency
- 24% ▼ -17.00%
- Reading proficiency
- 37% ▼ -9.00%
- Median HH income
- $34,583
- Composite
- 25.1/100
- National rank
- #7532
- State rank
- #583 of 656 in OH
Livability — Sandusky
- Score
- 83/100
- State rank
- #63
- US rank
- #929
Category grades
Schools grade is shown separately in the Schools card above.
Census & demographics
- Census place
- Sandusky, OH
- County
- Erie County · 39,883 people
- City population
- 39,883
- Metro
- Sandusky, OH
- Population (ZIP)
- 39,883
- Household income
- $62,082
- Rent vs Own
- Severe rent burden
- 1602.0
Population outlook (Erie County) Hauer SSP2
- Today (2025)
- 73,204 people
- By 2030
- 71,341 · -2.5%
- By 2040
- 66,771 · -8.8%
- By 2050
- 62,512 · -14.6%
- By 2075
- 56,154 · -23.3%
- By 2100
- 49,045 · -33.0%
Race, ethnicity, and origin ACS 2023
- Neighborhood character
- Predominantly White (72%)
- Race & ethnicity
- White 72% Black 15% Two or more races 8% Hispanic / Latino 5%
- Common ancestry
- Romanian 3% Slovak 2% Subsaharan African 1%
- Foreign-born
- 1% · Canada
- Languages at home
- 96% English-only · Spanish 2%
Political lean MEDSL · Erie
- 2024 margin
- R (+14.1) · D 42.5% · R 56.6%
- 2008→2024 swing
- -28.0pp toward R · 2008: 13.9pp · 2024: -14.1pp
- All cycles
- 2024: R+14.1 2020: R+11.6 2016: R+9.8 2012: D+11.3 2008: D+13.9
Not yet ingested
- Civics
- —
Market trends
- HPI YoY
- ▼ -151.99%
- Current HPI
- 209.6383
- Rent YoY
- —
- Metro
- Sandusky, OH
- State GDP YoY
- ▲ 1.98%
- F500 in state
- 48
Industry mix (Fortune 500 HQ in OH)
| Industry | F500 HQs | Revenue |
|---|---|---|
| Insurance | 3 | $145B |
|
||
| Industrial Machinery | 3 | $49B |
|
||
| Financial Services | 3 | $24B |
|
||
| Consumer Goods | 2 | $93B |
|
||
| Aerospace / Defense | 2 | $47B |
|
||
| Utilities | 2 | $33B |
|
||
Price history
+622.5% since first listed13 events — show timeline
- 2026-05-08 Price Changed $433,500 FAOR
- 2026-05-01 Price Changed $436,500 FAOR
- 2026-04-16 Price Changed $439,000 FAOR
- 2026-04-02 Listed $449,000 FAOR
- 2023-06-09 Sold (MLS) $359,000 FAOR
- 2023-04-17 Contingent — FAOR
- 2023-04-10 Listed $364,900 FAOR
- 2019-12-18 Sold (MLS) $22,123 MLSNOW
- 2019-12-18 Sold (MLS) $22,123 FAOR
- 2019-11-19 Listing Removed — MLSNOW
- 2019-06-25 Listed $19,900 MLSNOW
- 2019-06-25 Listed $19,900 FAOR
- 1995-07-28 Sold (Public Records) $60,000 Public Records
Property tax history
+5.9%/yrLatest (2025): $6,804 · +0.7% YoY. Source: county tax records.
Cash-flow waterfall
monthlySold comps — $/sqft
last 12 mo · ≤1 miLoading sold comps…