 Multi-family
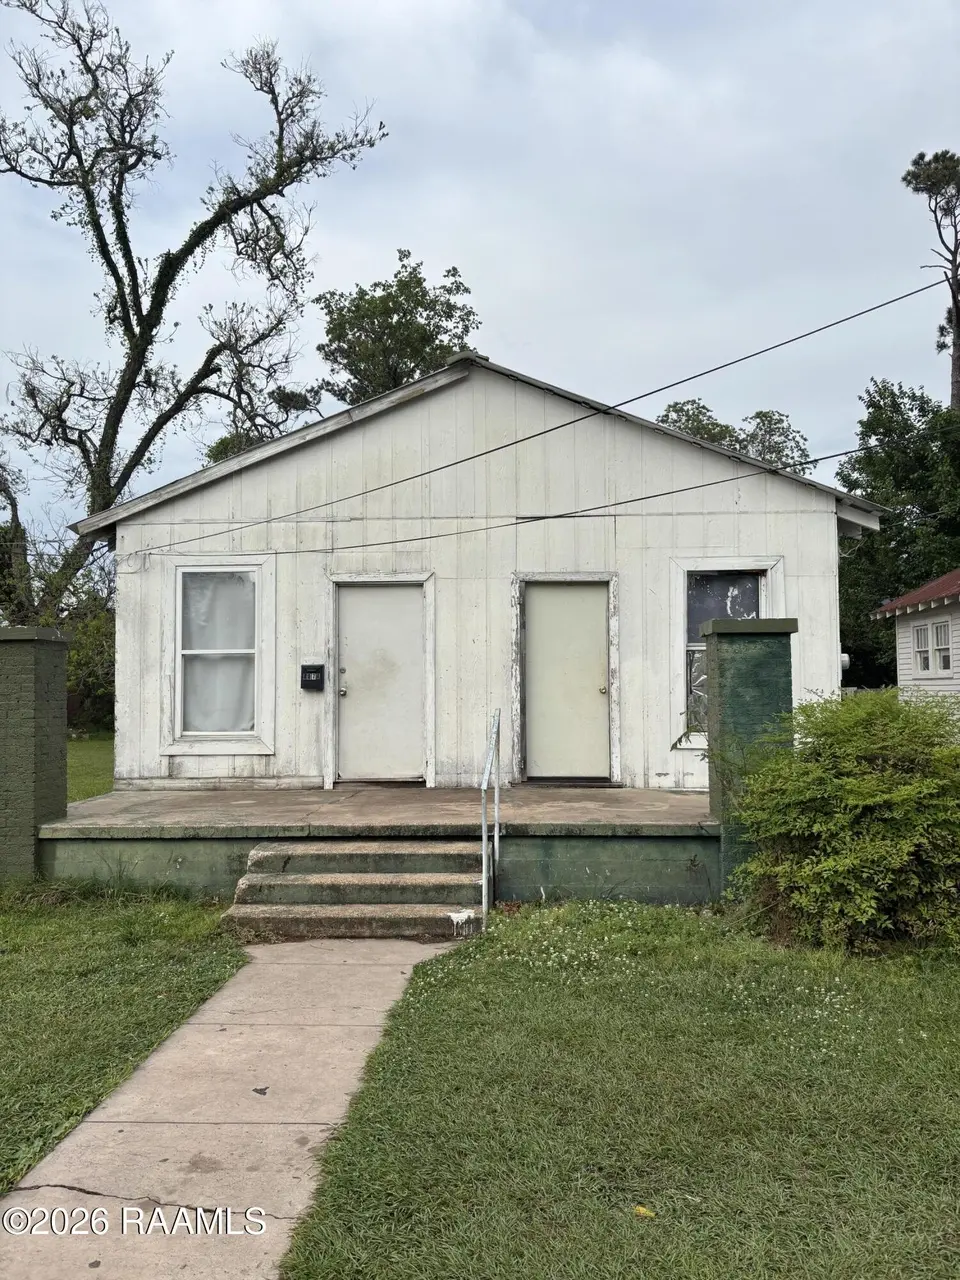
409 & 407 Walnut St Unit 1-4 · Bunkie, LA
Flood risk 1/10 · Minimal
- FEMA flood zone
- X
- Chance of flooding over 30 yrs
- 0.0%
- Est. flood insurance / yr
- $507 – $1,088
Fire risk 1/10 · Minimal
- Est. fire insurance / yr
- $1,269 – $2,357
Heat risk 8/10 · Major
- Hot days now (above 111°F)
- 7 days/yr
- Hot days in 30 yrs
- 19 days/yr
Wind risk 8/10 · Major
- Chance of severe wind over 30 yrs
- 99.0%
Air-quality risk 1/10 · Minimal
- Unhealthy air days now
- 0 days/yr
- Unhealthy air days in 30 yrs
- 0 days/yr
Risk factors via First Street. Map © Google.
Why this score? — see what drove the D+ grade
The composite is a weighted blend of 9 inputs, each scored 0–100. Each bar is that input's sub-score; the figure is the points it added to the 100-point composite (weight × sub-score).
- Cash flow +15.0/30.0
- ARV discount +7.5/15.0
- Appreciation +6.0/10.0
- 1% rule +5.0/10.0
- DSCR +5.0/10.0
- Livability +3.0/5.0
- Rent growth +2.5/5.0
- Condition / age +2.2/5.0
- Schools +2.1/10.0
$75,000
🖨 Deal sheet (PDF) 📄 Offer letter ✓ Due diligence
Multi-family units
County records classify this as Multi-Family (2-4 Unit). Listing-text estimate: 1 unit. estimate disagrees with records
Listing remarks
Value-add, income-producing four-unit property located in Bunkie. This semi tenant-occupied asset is currently generating cash flow, offering investors immediate income with meaningful long-term upside. The property features a solid structure, providing an excellent opportunity for strategic updates to enhance rental rates and overall return on investment. With thoughtful improvements, this property presents the opportunity to significantly increase both income and asset value. A minimum 24-hour notice is required for all showings in consideration of tenant occupancy.
Key facts
- Income-producing
- Four-unit property
- Cash flow
Tags
Property features AI
Finance
- Financial info: One of the four units is currently leased
Exterior
- Parking: Four parking spaces total; Parking arrangements vary by unit
- Utilities: Public sewer
- Home design: Duplex property; Four total units; Property described as a fixer
- Construction: Wood siding and other construction materials
- Exterior features: Porch; No fencing
Interior
- Kitchen: No appliances listed for kitchen
- Bedrooms: Duplex units (4 total) — bedroom counts per unit not provided
- Bathrooms: Four full bathrooms (total)
- Heating & cooling: Window air conditioning units; Central/standalone AC units; Heating present (unspecified type)
- Interior features: No built-in appliances included
- Laundry & utility: No laundry appliances listed
Neighborhood map
What this means for you Summary
Snapshot
- This is a 4-bed/4.0-bath multifamily listed at $75k. Condition is rated fair.
Deal economics
- At list price, monthly cash flow is $2k ($24k/yr) — positive.
- The deal already cash-flows at list — no discount required.
- Meets the 1% rule at list price ($3k rent vs $75k).
- Recommended offer: $70k (6.0% below list) — sets the bar for market timing.
Location & tenants
- Location reads 59/100 on livability (#267 in LA) — a working-class tenant base; expect higher turnover. Strengths: cost of living A+, housing B+; Watch: health & safety C-, amenities F, commute F.
- Avoyelles Parish (rural): math 22% / reading 30% proficiency, ranked #56 of 98 in LA (top 57%) — low school quality limits family demand, transient renter base, plan for 1-2y turnover; 75% free/reduced lunch — lower-income household profile, screen leases tightly.
- Zoned schools: Bunkie Elementary School (math 22% / reading 27%, grade F, #384 of 646 statewide, top 62%, 356 students, 77% FRL); Bunkie Magnet High School (math 23% / reading 28%, grade F, #149 of 265 statewide, top 56%, 702 students, 52% FRL).
- Market conditions: 23 active listings in the ZIP; 15 units permitted in Avoyelles Parish in 2024 (0 in 5+ unit buildings).
Forward outlook
- In year one you build about $2k of equity ($519 loan paydown + $1k appreciation (1.9% local appreciation)).
- Avoyelles County population projected at -18% by 2050 — secular population decline; favor cash flow + early exit over multi-decade hold.
- At projected returns (1.9% appreciation + 3.0% rent growth), your $21k cash investment doubles in ~1 year — after that, you're playing with house money.
Negotiation context
- It's been on market 66 days — a 6% lower offer ($70k) is reasonable based on typical stale-listing flexibility.
Risks & watch-outs
- Climate carrying-cost: severe wind risk, 99% chance of damaging wind over 30y; extreme-heat days projected 7→19/yr by 2055 (HVAC capex compounding) — expect insurance premiums to compound above CPI over the hold.
Questions for the listing agent
- It's been on market 66 days. Have you received any prior offers? Is the seller open to a 6% concession, seller financing, or rate buy-down credit?
- Have any recent inspections been done? Can we get a copy of the seller's disclosures and any deferred-maintenance estimates?
- Why hasn't it sold? Are there any deal-killer items the seller is aware of (foundation, flood, title, zoning, code violations)?
- Is there a deadline driving the sale (1031 exchange, divorce, estate, relocation)? That informs how much negotiation room exists.
- The area grade is low — what's the realistic commute time and amenity access for the typical tenant pool here? Any planned neighborhood developments (good or bad) we should know about?
- What's the average days-on-market for RENTAL listings here right now (not sales)? A rising rental-DOM trend means longer vacancies and softer asking-rent achievability than the comps imply.
- What's the recent tenant-quality profile in this submarket — average credit score on applications, eviction rate, late-payment / NSF rate, and stable-employment percentage? A property-management company in the area should have these aggregated.
- How much new apartment / multifamily construction is in the pipeline within 1–3 miles? Heavy new supply (>2% of stock underway) typically softens rents 12–24 months out; light construction supports rent growth.
Investment metrics
- 1% rule
- 4.28% ✓
- Cap rate
- 38.61%
- Cash-on-cash
- 115.43%
- DSCR
- 6.14
- GRM
- 1.9
CMA / ARV
No comps found within radius.
Projected returns pro-forma
1.94% appreciation · 3.0% rent growth · sell at horizon
- IRR
- —
- Equity multiple
- 7.36×
- Total profit
- $133,603
- Equity at exit
- $29,326
- IRR
- —
- Equity multiple
- 15.32×
- Total profit
- $300,762
- Equity at exit
- $42,035
Cash invested: $21,000 (down + closing). Projections, not guarantees.
Landlord ↔ Tenant lean methodology
- Overall (STATE)
- 90 Strongly Landlord-Friendly
- State Louisiana
- 90 Strongly Landlord-Friendly · R+12
- County
- — inherits STATE
- City
- — inherits STATE
ZIP-level market 71322
- Home prices YoY
- 2.4%
- Active inventory
- 23
- Price-to-rent
- 7.8×
Monthly cashflow live
- Estimated rent
- $3,213 medium interval (Pro) →
- Mortgage (P&I)
- −$393
- Tax est. 1.5%
- −$94 /mo · $1,125/yr
- Insurance
- −$31
- HOA
- −$0
- Vacancy / Maint / Mgmt
- −$675
- Net cashflow
- $2,020
Break-even live
Sensitivity live
| Price | -10% $2,072 | -5% $2,046 | +0% $2,020 | +5% $1,994 | +10% $1,968 |
|---|---|---|---|---|---|
| Rent | -10% $1,766 | -5% $1,893 | +0% $2,020 | +5% $2,147 | +10% $2,274 |
| Rate | -1.0pp $2,058 | -0.5pp $2,039 | base $2,020 | +0.5pp $2,001 | +1.0pp $1,981 |
4-unit breakdown (identical units grouped — click to expand)
| Units | Beds | Baths | Est. rent |
|---|---|---|---|
| 4× units | 2 | 1 | $3,212 |
| #1 | 2 | 1 | $803 |
| #2 | 2 | 1 | $803 |
| #3 | 2 | 1 | $803 |
| #4 | 2 | 1 | $803 |
| Total (4 units) | $3,213 | ||
UW: 25.0% down · 7.5% · 30yr · 1.5% tax · 5.0% vac · 8.0% maint · 8.0% mgmt
Financing live
Cash to close
- Down payment
- $18,750
- Closing costs
- $2,250
- Reserves months
- —
- Total cash needed
- —
Loan-product check · same deal, 3 products live
Conventional
25% down · 7.5% · 30yr
- Down + closing
- —
- Monthly P&I
- —
- Monthly cashflow
- —
- DSCR
- —
- Eligible?
- —
Personal DTI + credit; lowest rate.
DSCR
20% down · 8.5% · 30yr
- Down + closing
- —
- Monthly P&I
- —
- Monthly cashflow
- —
- DSCR
- —
- Eligible?
- —
No personal income docs; deal must DSCR.
Hard money
10% down · 12.0% · 12mo
- Down + closing
- —
- Monthly P&I
- —
- Monthly cashflow
- —
- DSCR
- —
- Eligible?
- —
Short-term bridge; refi at stabilization.
Listing history 17 events
-
2026-06-19days on market $75,000 Active 66 DOM
-
2026-06-18days on market $75,000 Active 65 DOM
-
2026-06-17days on market $75,000 Active 64 DOM
-
2026-06-16days on market $75,000 Active 63 DOM
-
2026-06-15days on market $75,000 Active 62 DOM
-
2026-06-14days on market $75,000 Active 60 DOM
-
2026-06-13days on market $75,000 Active 59 DOM
-
2026-06-10days on market $75,000 Active 57 DOM
-
2026-06-09days on market $75,000 Active 56 DOM
-
2026-06-08days on market $75,000 Active 55 DOM
-
2026-06-07days on market $75,000 Active 54 DOM
-
2026-06-03days on market $75,000 Active 50 DOM
-
2026-06-02days on market $75,000 Active 49 DOM
-
2026-06-01days on market $75,000 Active 48 DOM
-
2026-05-31days on market $75,000 Active 47 DOM
-
2026-05-30days on market $75,000 Active 46 DOM
-
2026-04-11$75,000 Active
ⓘ Source: listings_history table (triggers on properties + properties_extension) + one-shot
backfill from property_details.listing_events for pre-trigger history.
Climate risk First Street
- Flood 1/10 Low FEMA zone X · 0% chance over 30 yrs
- Wildfire 1/10 Low
- Heat 8/10 Severe 7 d/yr ≥111°F today · 19 d/yr by 30 yrs out
- Wind 8/10 Severe 99% chance of damaging wind over 30 yrs
- Air quality 1/10 Low 0 unhealthy d/yr today · 0 by 30 yrs out
Nearby sold comps map
Loading sold comps map…
Walkable amenities ~0.75 mi
Loading nearby amenities…
Taxation est. · year 1
- Rental income
- $38,556
- − Mortgage interest
- −$4,201
- − Property taxes
- −$1,125
- − Insurance
- −$375
- − Repairs & maintenance
- −$3,084
- − Management
- −$3,084
- − Depreciation
- −$2,182
- Taxable income
- $24,504
- Est. tax owed @ 24.0%
- −$5,881
- After-tax cash flow
- $18,359/yr
For passive investors: Depreciation is non-cash, so a rental often shows a tax loss while cash-flowing — sheltering income. Rental losses are passive: they offset passive income freely, and up to $25,000/yr can offset ordinary (W-2) income if you actively participate and your MAGI is under $100k (phasing out to $0 by $150k); unused losses carry forward. On sale, claimed depreciation is recaptured at up to 25%, and gains may owe capital-gains tax (a 1031 exchange can defer both). Figures are a year-1 estimate at your 24.0% rate — not tax advice; consult a CPA.
Condition & rehab AI · 14 photos
This property is in fair condition with some repairs and maintenance needed. The roof, exterior siding, flooring, interior walls, and HVAC and mechanical systems all require attention. Painting the exterior and interior, replacing the roof and flooring, and servicing the HVAC and mechanical systems can significantly increase the property's value.
Repairs flagged
- Major roof — The roof appears to be in poor condition, with visible wear and tear.
- Major exterior siding — The exterior siding appears to be in fair condition, with some discoloration and wear.
- Major flooring — The flooring in the interior appears to be in fair condition, with some wear and tear.
- Major interior walls/paint — The interior walls and paint appear to be in fair condition, with some discoloration and wear.
- Major HVAC and mechanical systems — The HVAC and mechanical systems appear to be in fair condition, with some wear and tear.
Value-add opportunities
- Both Paint the exterior siding and interior walls — Painting the exterior siding and interior walls can improve the curb appeal and interior aesthetics, which can increase both resale and rental value.
- Both Replace the roof — Replacing the roof can improve the structural integrity of the property and increase its overall value, which can increase both resale and rental value.
- Both Replace the flooring — Replacing the flooring can improve the interior aesthetics and increase the property's overall value, which can increase both resale and rental value.
- Both Service the HVAC and mechanical systems — Servicing the HVAC and mechanical systems can improve the property's energy efficiency and reduce utility costs, which can increase both resale and rental value.
Renovation cost estimate screening
| Repair item | Severity | Est. cost |
|---|---|---|
| roof · The roof appears to be in poor condition, with visible wear and tear. | Major | $15,000–50,000 |
| exterior siding · The exterior siding appears to be in fair condition, with some discoloration and wear. | Major | $15,000–50,000 |
| flooring · The flooring in the interior appears to be in fair condition, with some wear and tear. | Major | $15,000–50,000 |
| interior walls/paint · The interior walls and paint appear to be in fair condition, with some discoloration and wear. | Major | $15,000–50,000 |
| HVAC and mechanical systems · The HVAC and mechanical systems appear to be in fair condition, with some wear and tear. | Major | $15,000–50,000 |
| Total estimated repair cost · 5 items | $75,000–250,000 |
Value-add ROI direction
- Both Paint the exterior siding and interior walls — Painting the exterior siding and interior walls can improve the curb appeal and interior aesthetics, which can increase both resale and rental value. ↑
- Both Replace the roof — Replacing the roof can improve the structural integrity of the property and increase its overall value, which can increase both resale and rental value. ↑
- Both Replace the flooring — Replacing the flooring can improve the interior aesthetics and increase the property's overall value, which can increase both resale and rental value. ↑
- Both Service the HVAC and mechanical systems — Servicing the HVAC and mechanical systems can improve the property's energy efficiency and reduce utility costs, which can increase both resale and rental value. ↑
ⓘ Cost ranges are severity-bucket heuristics (US national rule-of-thumb). Get contractor quotes + a written scope before underwriting a rehab budget.
Schools (NCES district)
- District
- Avoyelles Parish
- NCES district ID
- 2200150
- Math proficiency
- 22% ▼ -32.00%
- Reading proficiency
- 30% ▼ -29.00%
- Median HH income
- $33,891
- Composite
- 21.32/100
- National rank
- #8378
- State rank
- #56 of 98 in LA
Livability — Bunkie
- Score
- 59/100
- State rank
- #267
- US rank
- #19665
Category grades
Schools grade is shown separately in the Schools card above.
Census & demographics
- Census place
- Bunkie, LA
- Population (ZIP)
- 5,257
Population outlook (Avoyelles County) Hauer SSP2
- Today (2025)
- 39,084 people
- By 2030
- 37,784 · -3.3%
- By 2040
- 35,049 · -10.3%
- By 2050
- 32,225 · -17.5%
- By 2075
- 25,695 · -34.3%
- By 2100
- 18,985 · -51.4%
Race, ethnicity, and origin ACS 2023
- Neighborhood character
- Diverse neighborhood (Simpson 0.55)
- Race & ethnicity
- Black 51% White 43% Two or more races 4% Hispanic / Latino 2%
- Common ancestry
- Lithuanian 10% Slovak 2% Italian 1%
- Foreign-born
- 1% · Canada
- Languages at home
- 95% English-only · Spanish 3% French/Haitian/Cajun 2%
Political lean MEDSL · Avoyelles
- 2024 margin
- Solid R (+43.1) · D 27.8% · R 71.0% · Other 1.2%
- 2008→2024 swing
- -20.1pp toward R · 2008: -23.1pp · 2024: -43.1pp
- All cycles
- 2024: R+43.1 2020: R+40.8 2016: R+37.0 2012: R+27.0 2008: R+23.1
Not yet ingested
- Civics
- —
Market trends
- HPI YoY
- ▲ 1.94%
- Current HPI
- 82.0658
- Rent YoY
- —
- Metro
- —
- State GDP YoY
- ▲ 3.29%
- F500 in state
- 10
Industry mix (Fortune 500 HQ in LA)
| Industry | F500 HQs | Revenue |
|---|---|---|
| Telecommunications | 2 | $23B |
|
||
| Utilities | 1 | $12B |
|
||
| Wholesale / Distribution | 1 | $5B |
|
||
| Advertising | 1 | $2B |
|
||
Price history
1 event — show timeline
- 2026-04-11 Listed $75,000 AcadianaMLS
Cash-flow waterfall
monthlySold comps — $/sqft
last 12 mo · ≤1 miLoading sold comps…