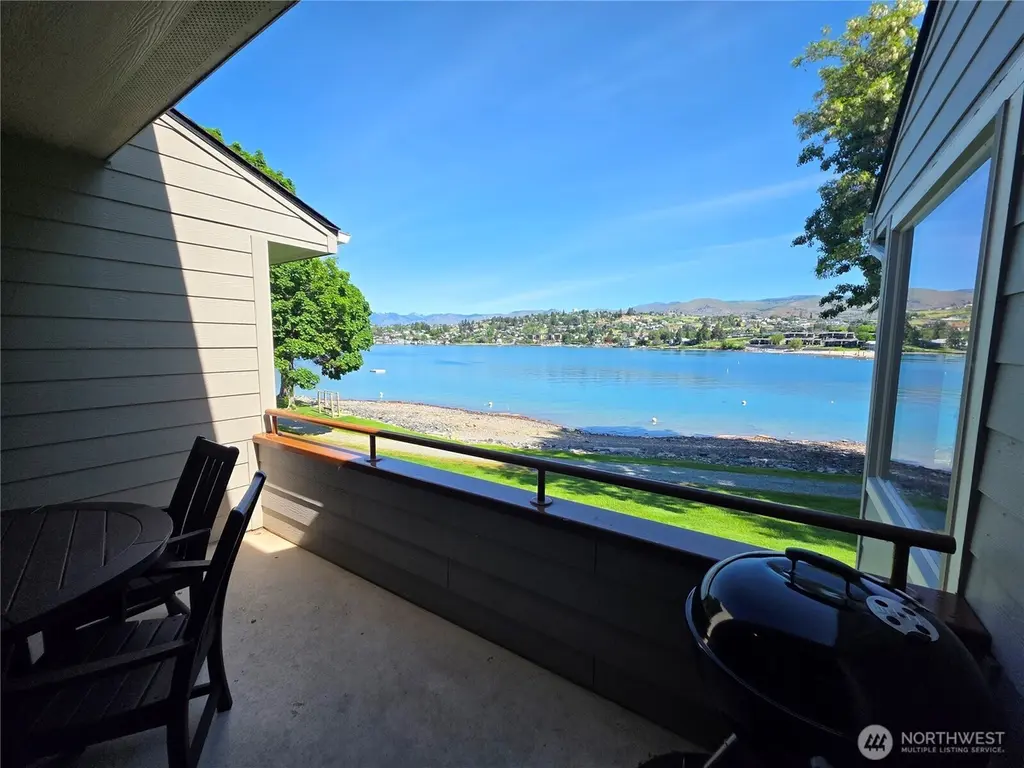
1 Beach 585-F · Manson, WA
Flood risk 1/10 · Minimal
- FEMA flood zone
- X
- Chance of flooding over 30 yrs
- 0.0%
- Est. flood insurance / yr
- $507 – $1,088
Fire risk 7/10 · Major
- Est. fire insurance / yr
- $604 – $1,122
Heat risk 4/10 · Minor
- Hot days now (above 95°F)
- 8 days/yr
- Hot days in 30 yrs
- 18 days/yr
Wind risk 1/10 · Minimal
- Chance of severe wind over 30 yrs
- —
Air-quality risk 10/10 · Severe
- Unhealthy air days now
- 23 days/yr
- Unhealthy air days in 30 yrs
- 25 days/yr
Risk factors via First Street. Map © Google.
Why this score? — see what drove the C- grade
The composite is a weighted blend of 9 inputs, each scored 0–100. Each bar is that input's sub-score; the figure is the points it added to the 100-point composite (weight × sub-score).
- Cash flow +15.0/30.0
- ARV discount +15.0/15.0
- 1% rule +5.0/10.0
- DSCR +5.0/10.0
- Schools +3.8/10.0
- Livability +3.1/5.0
- Rent growth +2.5/5.0
- Condition / age +2.5/5.0
- Appreciation +0.0/10.0
$1,250
🖨 Deal sheet 📄 Offer letter ✓ Due diligence
Listing remarks
LOCATION! LOCATION! Upper level 2 bedroom, 2 bath luxury waterfront suite with lake views from most every room. Upcoming Weeks: May 28-June 4 and Sept 24-Oct 1 in2026. Feb 25-March 4, June 24-July 1 & October 21-28 in 2027. March 23-30, July 20-27 & November 16-23 in 2028. April 19-26, August 16-23 & December 13-20 in 2029. Waterfront, boat moorage, lawn and walking path are directly in front of condo. HOA Fees $788/quarter includes 3 rotating weeks every year allowing you the most affordable way to experience all seasons at Wapato Point Resort. Use your weeks, rent for income or trade thru RCI or Interval International & visit other places. Purchase includes us
Key facts
- Indoor outdoor pools
- Waterfront
- Boat moorage
Tags
Neighborhood map
What this means for you Summary
Snapshot
- This is a 2-bed/2.0-bath timeshare listed at $1k.
Deal economics
- At list price, monthly cash flow is $1k ($14k/yr) — positive.
- The deal already cash-flows at list — no discount required.
- Meets the 1% rule at list price ($2k rent vs $1k).
- Recommended offer: $1k (6.0% below list) — sets the bar for market timing.
- Cap rate 1142.4% vs local median 2.9% in Manson — top-decile yield for the area; either an underpriced asset or a hidden risk that comps aren't pricing in. Stress-test before assuming the spread holds.
Location & tenants
- Location reads 62/100 on livability (#421 in WA) — a middle-class / working-renter tenant base. Strengths: crime A+; Watch: health & safety C-, cost of living D+, employment D.
- Manson School District (town): math 42% / reading 40% proficiency, ranked #211 of 291 in WA (top 72%) — families likely to look elsewhere, expect single-tenant / working-renter base with shorter leases; 64% free/reduced lunch — lower-income household profile, screen leases tightly.
- Market conditions: 212 active listings in the ZIP; 762 units permitted in Chelan County in 2024 (377 in 5+ unit buildings).
Forward outlook
- Local home prices are declining (-3.0%/yr); year-one equity from $8 of loan paydown is wiped out by about $38 of value loss. Plan a longer hold.
- Chelan County population projected at +13% by 2050 — modest demand growth; plan on rents tracking national, not racing it.
- At projected returns (-3.0% appreciation + 3.0% rent growth), your $350 cash investment doubles in ~1 year — after that, you're playing with house money.
Negotiation context
- It's been on market 90 days — a 6% lower offer ($1k) is reasonable based on typical stale-listing flexibility.
- 2 sale attempts since 6y ago with the ask held roughly flat each time — persistent listings suggest the price (not the market) is what's stuck; bring a comps-based counter.
Risks & watch-outs
- Climate carrying-cost: major wildfire risk — expect insurance premiums to compound above CPI over the hold.
Questions for the listing agent
- It's been on market 90 days. Have you received any prior offers? Is the seller open to a 6% concession, seller financing, or rate buy-down credit?
- What does the HOA fee cover, when was the last increase, and are there any pending special assessments or reserve-fund shortfalls?
- Why hasn't it sold? Are there any deal-killer items the seller is aware of (foundation, flood, title, zoning, code violations)?
- Is there a deadline driving the sale (1031 exchange, divorce, estate, relocation)? That informs how much negotiation room exists.
- Schools are D-rated, which usually means shorter tenancies and higher turnover. Who's the typical renter profile here, and what's been the actual vacancy rate?
- What's the average days-on-market for RENTAL listings here right now (not sales)? A rising rental-DOM trend means longer vacancies and softer asking-rent achievability than the comps imply.
- What's the recent tenant-quality profile in this submarket — average credit score on applications, eviction rate, late-payment / NSF rate, and stable-employment percentage? A property-management company in the area should have these aggregated.
- How much new for-sale + rental construction is in the pipeline within 1–3 miles? Heavy new supply typically softens prices + rents 12–24 months out; constrained supply supports both.
Investment metrics
- 1% rule
- 147.35% ✓
- Cap rate
- 1142.36%
- Cash-on-cash
- 4057.37%
- DSCR
- 181.53
- GRM
- 0.1
CMA / ARV
- ARV (median comp)
- $1,783
- List price
- $1,250
- Delta
- -29.90%
- Verdict
- UNDERPRICED
- Comps
- 20 within 1.0 mi
Show comp detail 12 sales within ~0.75 mi
| Address | Dist | Beds/Ba | Sqft | Sold | Price | $/sf | Match |
|---|---|---|---|---|---|---|---|
| 1 Beach 553-A | 0.07mi | 2/2.0 | 964 (0%) | 4mo | $3,500 | $4 | 94 |
| 1 Beach 549-I | 0.12mi | 2/2.0 | 964 (0%) | 2mo | $1 | — | 93 |
| 1 Beach 534-O | 0.12mi | 2/2.0 | 964 (0%) | 4mo | $2,600 | $3 | 91 |
| 1 Beach 536-J | 0.11mi | 2/2.0 | 964 (0%) | 8mo | $1 | — | 88 |
| 1 Lakeside 720-P | 0.24mi | 2/2.0 | 981 (+2%) | 4mo | $1,000 | $1 | 82 |
| 1 Lakeside 701-B | 0.29mi | 2/2.0 | 981 (+2%) | 2mo | $2,000 | $2 | 82 |
| 1 Lakeside 711-F | 0.27mi | 2/2.0 | 981 (+2%) | 4mo | $4,500 | $5 | 81 |
| 1 Lakeside 720-H | 0.24mi | 2/2.0 | 981 (+2%) | 6mo | $1 | — | 80 |
| 1 Lakeside 715-Q | 0.24mi | 2/2.0 | 981 (+2%) | 8mo | $3,500 | $4 | 79 |
| 1 Lodge 632-C | 0.33mi | 2/2.0 | 981 (+2%) | 4mo | $500 | $1 | 79 |
| 1 Beach 538-C | 0.64mi | 2/2.0 | 964 (0%) | 1mo | $1 | — | 70 |
| 1 Beach 542-C | 0.64mi | 2/2.0 | 964 (0%) | 5mo | $3,500 | $4 | 66 |
Match score weights: distance 35% · size 25% · config 20% · recency 20%. Top-matched comps best support the ARV.
Projected returns pro-forma
-3.0% appreciation · 3.0% rent growth · sell at horizon
- IRR
- —
- Equity multiple
- 216.31×
- Total profit
- $75,358
- Equity at exit
- $186
- IRR
- —
- Equity multiple
- 467.98×
- Total profit
- $163,443
- Equity at exit
- $108
Cash invested: $350 (down + closing). Projections, not guarantees.
Landlord ↔ Tenant lean methodology
- Overall (STATE)
- 28 Tenant-Leaning
- State Washington
- 28 Tenant-Leaning · D+8
- County
- — inherits STATE
- City
- — inherits STATE
ZIP-level market 98831
- Active inventory
- 212
- Price-to-rent
- 0.1×
Monthly cashflow live
- Estimated rent
- $1,842 medium interval (Pro) →
- Mortgage (P&I)
- −$7
- Tax est. 1.5%
- −$2 /mo · $19/yr
- Insurance
- −$1
- HOA
- −$263
- Vacancy / Maint / Mgmt
- −$387
- Net cashflow
- $1,183
Break-even live
UW: 25.0% down · 7.5% · 30yr · 1.5% tax · 5.0% vac · 8.0% maint · 8.0% mgmt
Financing live
Cash to close
- Down payment
- $312
- Closing costs
- $38
- Reserves months
- —
- Total cash needed
- —
Loan-product check · same deal, 3 products live
Conventional
25% down · 7.5% · 30yr
- Down + closing
- —
- Monthly P&I
- —
- Monthly cashflow
- —
- DSCR
- —
- Eligible?
- —
Personal DTI + credit; lowest rate.
DSCR
20% down · 8.5% · 30yr
- Down + closing
- —
- Monthly P&I
- —
- Monthly cashflow
- —
- DSCR
- —
- Eligible?
- —
No personal income docs; deal must DSCR.
Hard money
10% down · 12.0% · 12mo
- Down + closing
- —
- Monthly P&I
- —
- Monthly cashflow
- —
- DSCR
- —
- Eligible?
- —
Short-term bridge; refi at stabilization.
HOA detail
- Monthly dues
- $263 · $3,156/yr
- Likely covers
- water
Listing history 8 events
-
2026-06-03status $1,250 Pending 90 DOM
-
2026-06-02days on market $1,250 Active 90 DOM
-
2026-06-01days on market $1,250 Active 89 DOM
-
2026-05-31days on market $1,250 Active 88 DOM
-
2026-03-04$1,250 Active
-
2023-04-26soldstatus $1,500 Closed
-
2023-03-20status Pending
-
2020-07-09$2,500 Active
ⓘ Source: listings_history table (triggers on properties + properties_extension) + one-shot
backfill from property_details.listing_events for pre-trigger history.
Climate risk First Street
- Flood 1/10 Low FEMA zone X · 0% chance over 30 yrs
- Wildfire 7/10 Severe
- Heat 4/10 Moderate 8 d/yr ≥95°F today · 18 d/yr by 30 yrs out
- Wind 1/10 Low
- Air quality 10/10 Extreme 23 unhealthy d/yr today · 25 by 30 yrs out
Nearby sold comps map
Loading sold comps map…
Walkable amenities ~0.75 mi
Loading nearby amenities…
Taxation est. · year 1
- Rental income
- $22,102
- − Mortgage interest
- −$70
- − Property taxes
- −$19
- − Insurance
- −$6
- − Repairs & maintenance
- −$1,768
- − Management
- −$1,768
- − HOA
- −$3,156
- − Depreciation
- −$36
- Taxable income
- $15,278
- Est. tax owed @ 24.0%
- −$3,667
- After-tax cash flow
- $10,534/yr
For passive investors: Depreciation is non-cash, so a rental often shows a tax loss while cash-flowing — sheltering income. Rental losses are passive: they offset passive income freely, and up to $25,000/yr can offset ordinary (W-2) income if you actively participate and your MAGI is under $100k (phasing out to $0 by $150k); unused losses carry forward. On sale, claimed depreciation is recaptured at up to 25%, and gains may owe capital-gains tax (a 1031 exchange can defer both). Figures are a year-1 estimate at your 24.0% rate — not tax advice; consult a CPA.
Schools (NCES district)
- District
- Manson School District
- NCES district ID
- 5304740
- Math proficiency
- 42% ▲ 10.00%
- Reading proficiency
- 40% ▲ 4.00%
- Median HH income
- $48,123
- Composite
- 37.53/100
- National rank
- #8876
- State rank
- #211 of 291 in WA
Livability — Manson
- Score
- 62/100
- State rank
- #421
- US rank
- #16741
Category grades
Schools grade is shown separately in the Schools card above.
Census & demographics
- Census place
- Manson, WA
- Population (ZIP)
- 4,020
Population outlook (Chelan County) Hauer SSP2
- Today (2025)
- 81,630 people
- By 2030
- 84,312 · +3.3%
- By 2040
- 88,619 · +8.6%
- By 2050
- 91,915 · +12.6%
- By 2075
- 99,409 · +21.8%
- By 2100
- 100,032 · +22.5%
Race, ethnicity, and origin ACS 2023
- Neighborhood character
- Majority White (57%)
- Race & ethnicity
- White 57% Hispanic / Latino 40% Two or more races 10%
- Hispanic origin (detail)
- Mexican 37%
- Common ancestry
- Lithuanian 5% Portuguese 5% Iranian 2%
- Foreign-born
- 25% · Canada
- Languages at home
- 61% English-only · Spanish 38% German/W. Germanic 1%
Political lean MEDSL · Chelan
- 2024 margin
- Lean R (+9.5) · D 43.9% · R 53.4% · Other 2.7%
- 2008→2024 swing
- +2.5pp toward D · 2008: -12.0pp · 2024: -9.5pp
- All cycles
- 2024: R+9.5 2020: R+7.8 2016: R+15.7 2012: R+16.9 2008: R+12.0
Not yet ingested
- Civics
- —
Market trends
- HPI YoY
- ▼ -325.60%
- Current HPI
- 249.0392
- Rent YoY
- —
- Metro
- —
- State GDP YoY
- ▲ 4.65%
- F500 in state
- 22
Industry mix (Fortune 500 HQ in WA)
| Industry | F500 HQs | Revenue |
|---|---|---|
| Retail | 2 | $269B |
|
||
| Technology / Retail | 1 | $638B |
|
||
| Technology | 1 | $245B |
|
||
| Telecommunications | 1 | $38B |
|
||
| Food / Beverage | 1 | $36B |
|
||
| Automotive / Trucks | 1 | $34B |
|
||
Price history
-50.0% since first listed4 events — show timeline
- 2026-03-04 Listed $1,250 NWMLS as Distributed by MLS Grid
- 2023-04-26 Sold (MLS) $1,500 NWMLS as Distributed by MLS Grid
- 2023-03-20 Pending — NWMLS as Distributed by MLS Grid
- 2020-07-09 Listed $2,500 NWMLS as Distributed by MLS Grid
Cash-flow waterfall
monthlySold comps — $/sqft
last 12 mo · ≤1 miLoading sold comps…