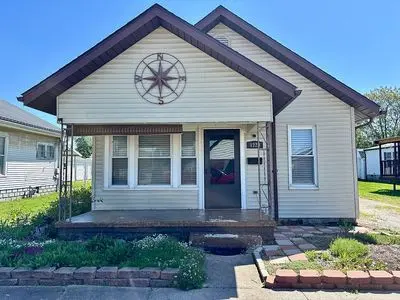
1224 S Prince St · Princeton, IN
Flood risk 1/10 · Minimal
- FEMA flood zone
- X (unshaded)
- Chance of flooding over 30 yrs
- 0.0%
- Est. flood insurance / yr
- $507 – $1,088
Fire risk 1/10 · Minimal
- Est. fire insurance / yr
- $717 – $1,331
Heat risk 5/10 · Moderate
- Hot days now (above 106°F)
- 7 days/yr
- Hot days in 30 yrs
- 20 days/yr
Wind risk 2/10 · Minimal
- Chance of severe wind over 30 yrs
- 3.0%
Air-quality risk 2/10 · Minimal
- Unhealthy air days now
- 1 days/yr
- Unhealthy air days in 30 yrs
- 2 days/yr
Risk factors via First Street. Map © Google.
Why this score? — see what drove the C- grade
The composite is a weighted blend of 9 inputs, each scored 0–100. Each bar is that input's sub-score; the figure is the points it added to the 100-point composite (weight × sub-score).
- Cash flow +26.5/30.0
- DSCR +9.0/10.0
- 1% rule +6.0/10.0
- Livability +3.6/5.0
- Schools +2.7/10.0
- Rent growth +2.5/5.0
- Condition / age +2.5/5.0
- ARV discount +0.0/15.0
- Appreciation +0.0/10.0
$129,555
🖨 Deal sheet (PDF) 📄 Offer letter ✓ Due diligence
Listing remarks
?? NEW LISTING & acirc; & euro; & ldquo; PRINCETON, INDIANA ?? 2 Bed | 1 Bath | Large Fenced Yard | Quiet Street If you & acirc; & euro; & trade; ve been looking for an affordable home with major updates already done & acirc; & euro; & brvbar; this is it. Welcome to this well-maintained 2 bedroom, 1 bathroom home tucked away on a quiet dead-end street in Princeton. With alley access and extra parking, this property offers both convenience and privacy & acirc; & euro; & rdquo; something that & acirc; & euro; & trade; s hard to find at this price point. ? Big-ticket items? Already handled: ?? New Roof (2025) ?? HVAC System (2019) ?
Key facts
- Laundry rm wall
- Roof
- Living room
Tags
Property features AI
Exterior
- Parking: Gravel parking
- Security: Smoke detector(s)
- Utilities: Public water; Public sewer; Cable available
- Home design: Single-family residence (site-built); One story; Above-grade finished living area
- Construction: Vinyl siding; Crawl space foundation; Built as site-built home
- Exterior features: Covered porch; Patio; Shed(s); Level, landscaped lot; Paved, public maintained road
Interior
- Kitchen: Refrigerator; Electric range
- Bathrooms: 1 full bathroom (main level)
- Heating & cooling: Natural gas heating; Central air; Window unit(s); Ceiling fans for cooling
- Interior features: Ceiling fan(s); Living room fireplace
- Laundry & utility: Washer hookup on main level; Electric dryer hookup; Gas water heater
Neighborhood map
What this means for you Summary
Snapshot
- This is a 2-bed/1.0-bath single-family listed at $130k.
Deal economics
- At list price, monthly cash flow is $343 ($4k/yr) — positive.
- The deal already cash-flows at list — no discount required.
- Meets the 1% rule at list price ($1k rent vs $130k).
- Cap rate 9.5% vs local median 5.3% in Princeton — top-decile yield for the area; either an underpriced asset or a hidden risk that comps aren't pricing in. Stress-test before assuming the spread holds.
Location & tenants
- Location reads 71/100 on livability (#131 in IN) — a middle-class / working-renter tenant base. Strengths: cost of living A+, housing A+; Watch: employment C-, amenities F, commute F.
- North Gibson School Corporation (rural): math 28% / reading 36% proficiency, ranked #223 of 301 in IN (top 74%) — families likely to look elsewhere, expect single-tenant / working-renter base with shorter leases.
- Zoned schools: Princeton Comm Primary School (414 students, 53% FRL); Princeton Community Middle (math 23% / reading 37%, grade F, #208 of 330 statewide, top 64%, 431 students, 53% FRL); Princeton Community High School (math 22% / reading 57%, grade F, #221 of 369 statewide, top 63%, 618 students, 41% FRL).
- Market conditions: 143 active listings in the ZIP; 4 comparable units currently listed for rent nearby; rentals lingering (median 45d on market — plan ~5-8 weeks vacancy on turnover, expect pricing pressure); 100% of comp listings sitting > 30 days — soft ceiling on asking rent; 167 units permitted in Gibson County in 2024 (68 in 5+ unit buildings).
Forward outlook
- Local home prices are declining (-3.0%/yr); year-one equity from $895 of loan paydown is wiped out by about $4k of value loss. Plan a longer hold.
- Gibson County population projected to shrink 10% by 2050 — rents likely to lag national; underwrite the cash flow, not the appreciation.
- At projected returns (-3.0% appreciation + 3.0% rent growth), your $36k cash investment doubles in ~10 years — after that, you're playing with house money.
Negotiation context
- Only 8 days on market — expect competitive offers; lowballing is unlikely to land.
- 2 sale attempts since 8y ago with the ask held roughly flat each time — persistent listings suggest the price (not the market) is what's stuck; bring a comps-based counter.
Risks & watch-outs
- Watch-outs: built in 1927 — expect roof / HVAC / electrical / plumbing capex.
- Climate carrying-cost: extreme-heat days projected 7→20/yr by 2055 (HVAC capex compounding) — expect insurance premiums to compound above CPI over the hold.
Questions for the listing agent
- Built in 1927 — when were the roof, HVAC, electrical panel, plumbing, and water heater last replaced?
- Is there a deadline driving the sale (1031 exchange, divorce, estate, relocation)? That informs how much negotiation room exists.
- Schools are D-rated, which usually means shorter tenancies and higher turnover. Who's the typical renter profile here, and what's been the actual vacancy rate?
- What's the average days-on-market for RENTAL listings here right now (not sales)? A rising rental-DOM trend means longer vacancies and softer asking-rent achievability than the comps imply.
- What's the recent tenant-quality profile in this submarket — average credit score on applications, eviction rate, late-payment / NSF rate, and stable-employment percentage? A property-management company in the area should have these aggregated.
- How much new for-sale + rental construction is in the pipeline within 1–3 miles? Heavy new supply typically softens prices + rents 12–24 months out; constrained supply supports both.
Investment metrics
- 1% rule
- 1.10% ✓
- Cap rate
- 9.47%
- Cash-on-cash
- 11.33%
- DSCR
- 1.50
- GRM
- 7.6
CMA / ARV
- ARV (median comp)
- $94,436
- List price
- $129,555
- Delta
- 53.44%
- Verdict
- OVERPRICED
- Comps
- 20 within 1.0 mi
Show comp detail 12 sales within ~0.75 mi
| Address | Dist | Beds/Ba | Sqft | Sold | Price | $/sf | Match |
|---|---|---|---|---|---|---|---|
| 121 W Mulberry St | 0.42mi | 2/1.0 | 928 (-2%) | 3mo | $154,500 | $166 | 75 |
| 403 E Illinois St | 0.31mi | 3/1.5 (+1) | 960 (+2%) | 2mo | $167,900 | $175 | 74 |
| 805 S Stormont St | 0.41mi | 2/2.0 | 968 (+2%) | 0mo | $131,000 | $135 | 72 |
| 915 S Hall St | 0.34mi | 2/1.0 | 875 (-7%) | 1mo | $175,000 | $200 | 71 |
| 613 S Prince St | 0.45mi | 2/1.0 | 1,000 (+6%) | 5mo | $79,600 | $80 | 65 |
| 208 W Makemson Ave | 0.18mi | 2/1.0 | 836 (-11%) | 12mo | $90,000 | $108 | 62 |
| 820 S Stormont St | 0.41mi | 2/1.0 | 1,045 (+11%) | 2mo | $113,000 | $108 | 62 |
| 916 S Stormont St | 0.36mi | 2/1.0 | 1,002 (+6%) | 16mo | $129,900 | $130 | 59 |
| 730 S Stormont St | 0.44mi | 2/1.0 | 828 (-12%) | 1mo | $53,500 | $65 | 58 |
| 1313 S Baldwin Ct | 0.25mi | 3/2.0 (+1) | 1,081 (+14%) | 2mo | $224,900 | $208 | 54 |
| 1117 S Virgil Blvd | 0.41mi | 2/1.0 | 1,040 (+10%) | 13mo | $169,000 | $163 | 53 |
| 212 E 150 S | 0.63mi | 3/1.0 (+1) | 1,080 (+14%) | 6mo | $15,000 | $14 | 36 |
Match score weights: distance 35% · size 25% · config 20% · recency 20%. Top-matched comps best support the ARV.
Projected returns pro-forma
-3.0% appreciation · 3.0% rent growth · sell at horizon
- IRR
- 0.6%
- Equity multiple
- 1.02×
- Total profit
- $778
- Equity at exit
- $19,317
- IRR
- 10.2%
- Equity multiple
- 1.79×
- Total profit
- $28,579
- Equity at exit
- $11,202
Cash invested: $36,275 (down + closing). Projections, not guarantees.
Landlord ↔ Tenant lean methodology
- Overall (STATE)
- 90 Strongly Landlord-Friendly
- State Indiana
- 90 Strongly Landlord-Friendly · R+11
- County
- — inherits STATE
- City
- — inherits STATE
ZIP-level market 47670
- Home prices YoY
- -32.2%
- Active inventory
- 143
- Price-to-rent
- 7.6×
Monthly cashflow live
- Estimated rent
- $1,424 medium interval (Pro) →
- Mortgage (P&I)
- −$679
- Tax from tax record
- −$49 /mo · $584/yr
- Insurance
- −$54
- HOA
- −$0
- Vacancy / Maint / Mgmt
- −$299
- Net cashflow
- $343
Break-even live
Sensitivity live
| Price | -10% $416 | -5% $379 | +0% $343 | +5% $306 | +10% $269 |
|---|---|---|---|---|---|
| Rent | -10% $230 | -5% $286 | +0% $343 | +5% $399 | +10% $455 |
| Rate | -1.0pp $408 | -0.5pp $376 | base $343 | +0.5pp $309 | +1.0pp $275 |
UW: 25.0% down · 7.5% · 30yr · 1.5% tax · 5.0% vac · 8.0% maint · 8.0% mgmt
Financing live
Cash to close
- Down payment
- $32,389
- Closing costs
- $3,887
- Reserves months
- —
- Total cash needed
- —
Loan-product check · same deal, 3 products live
Conventional
25% down · 7.5% · 30yr
- Down + closing
- —
- Monthly P&I
- —
- Monthly cashflow
- —
- DSCR
- —
- Eligible?
- —
Personal DTI + credit; lowest rate.
DSCR
20% down · 8.5% · 30yr
- Down + closing
- —
- Monthly P&I
- —
- Monthly cashflow
- —
- DSCR
- —
- Eligible?
- —
No personal income docs; deal must DSCR.
Hard money
10% down · 12.0% · 12mo
- Down + closing
- —
- Monthly P&I
- —
- Monthly cashflow
- —
- DSCR
- —
- Eligible?
- —
Short-term bridge; refi at stabilization.
Rent comps 4 comps
| Address | Beds | Baths | Sqft | Rent | $/sqft | DOM | Units | Dist |
|---|---|---|---|---|---|---|---|---|
| 220 W Garfield Ave Princeton, IN | 2.0 | 1.0 | 1000 | $1,700 | $1.70 | 44d | 2 | 0.19mi |
| 318 S Gibson St Unit A Princeton, IN | 1.0 | 1.0 | 750 | $795 | $1.06 | 44d | 1 | 0.66mi |
| 102 N Seminary St Princeton, IN | 2.0 | 1.0 | 884 | $995 | $1.13 | 44d | 1 | 0.87mi |
| 629 S Second Ave Princeton, IN | 1.0–3.0 | 1.0–2.0 | 1001 | $1,188 | $1.19 | 44d | 29 | 1.32mi |
Listing history 17 events
-
2026-06-21days on market $129,555 Active 8 DOM
-
2026-06-18days on market $129,555 Active 6 DOM
-
2026-06-17days on market $129,555 Active 5 DOM
-
2026-06-16days on market $129,555 Active 4 DOM
-
2026-06-15days on market $129,555 Active 3 DOM
-
2026-06-13pricedays on market $129,555 Active 1 DOM
-
2026-06-12days on market $144,900 Active 31 DOM
-
2026-06-09days on market $144,900 Active 28 DOM
-
2026-06-08days on market $144,900 Active 27 DOM
-
2026-06-07days on market $144,900 Active 26 DOM
-
2026-06-04days on market $144,900 Active 22 DOM
-
2026-06-02days on market $144,900 Active 21 DOM
-
2026-06-01days on market $144,900 Active 20 DOM
-
2026-05-31days on market $144,900 Active 19 DOM
-
2026-05-31days on market $144,900 Active 18 DOM
-
2026-05-12$144,900 Active 1675-char remark
-
2018-05-25$64,900
ⓘ Source: listings_history table (triggers on properties + properties_extension) + one-shot
backfill from property_details.listing_events for pre-trigger history.
Tax reassessment forecast IN · Partial reset (capped growth)
- Current annual tax
- $584 · $49/mo
- Projected year-2 tax
- $843 · $70/mo
- Expected delta
- +$259/yr (+$22/mo · 44.3%)
ⓘ Screening estimate from a state-policy table — verify with the county assessor before closing.
Climate risk First Street
- Flood 1/10 Low FEMA zone X (unshaded) · 0% chance over 30 yrs
- Wildfire 1/10 Low
- Heat 5/10 Major 7 d/yr ≥106°F today · 20 d/yr by 30 yrs out
- Wind 2/10 Low 3% chance of damaging wind over 30 yrs
- Air quality 2/10 Low 1 unhealthy d/yr today · 2 by 30 yrs out
Nearby sold comps map
Loading sold comps map…
Walkable amenities ~0.75 mi
Loading nearby amenities…
Taxation est. · year 1
- Rental income
- $17,083
- − Mortgage interest
- −$7,257
- − Property taxes
- −$584
- − Insurance
- −$648
- − Repairs & maintenance
- −$1,367
- − Management
- −$1,367
- − Depreciation
- −$3,769
- Taxable income
- $2,092
- Est. tax owed @ 24.0%
- −$502
- After-tax cash flow
- $3,609/yr
For passive investors: Depreciation is non-cash, so a rental often shows a tax loss while cash-flowing — sheltering income. Rental losses are passive: they offset passive income freely, and up to $25,000/yr can offset ordinary (W-2) income if you actively participate and your MAGI is under $100k (phasing out to $0 by $150k); unused losses carry forward. On sale, claimed depreciation is recaptured at up to 25%, and gains may owe capital-gains tax (a 1031 exchange can defer both). Figures are a year-1 estimate at your 24.0% rate — not tax advice; consult a CPA.
Schools (NCES district)
- District
- North Gibson School Corporation
- NCES district ID
- 1807770
- Math proficiency
- 28% ▼ -10.00%
- Reading proficiency
- 36% ▼ -4.00%
- Median HH income
- $44,595
- Composite
- 27.32/100
- National rank
- #6992
- State rank
- #223 of 301 in IN
Livability — Princeton
- Score
- 71/100
- State rank
- #131
- US rank
- #6840
Category grades
Schools grade is shown separately in the Schools card above.
Census & demographics
- Census place
- Princeton, IN
- Population (ZIP)
- 11,638
Population outlook (Gibson County) Hauer SSP2
- Today (2025)
- 33,671 people
- By 2030
- 33,409 · -0.8%
- By 2040
- 32,364 · -3.9%
- By 2050
- 30,453 · -9.6%
- By 2075
- 24,610 · -26.9%
- By 2100
- 16,217 · -51.8%
Race, ethnicity, and origin ACS 2023
- Neighborhood character
- Predominantly White (85%)
- Race & ethnicity
- White 85% Black 5% Hispanic / Latino 4% Two or more races 4%
- Common ancestry
- Lithuanian 2% Slovak 2% Serbian 1%
- Foreign-born
- 3% · Canada
- Languages at home
- 95% English-only · Spanish 3% Other Asian/Pacific 1%
Political lean MEDSL · Gibson
- 2024 margin
- Solid R (+51.4) · D 23.4% · R 74.8% · Other 1.8%
- 2008→2024 swing
- -38.2pp toward R · 2008: -13.2pp · 2024: -51.4pp
- All cycles
- 2024: R+51.4 2020: R+48.2 2016: R+47.6 2012: R+31.0 2008: R+13.2
Not yet ingested
- Civics
- —
Market trends
- HPI YoY
- ▼ -104.47%
- Current HPI
- 219.932
- Rent YoY
- —
- Metro
- —
- State GDP YoY
- ▲ 2.90%
- F500 in state
- 18
Industry mix (Fortune 500 HQ in IN)
| Industry | F500 HQs | Revenue |
|---|---|---|
| Industrial Machinery | 2 | $37B |
|
||
| Healthcare | 1 | $177B |
|
||
| Pharmaceuticals | 1 | $45B |
|
||
| Metals / Steel | 1 | $18B |
|
||
| Agriculture | 1 | $17B |
|
||
| Packaging | 1 | $12B |
|
||
Price history
+99.6% since first listed2 events — show timeline
- 2026-06-12 Listed $129,555 IRMLS
- 2018-05-25 Listed $64,900 IRMLS
Property tax history
-7.9%/yrLatest (2024): $584 · +3.2% YoY. Source: county tax records.
Cash-flow waterfall
monthlySold comps — $/sqft
last 12 mo · ≤1 miLoading sold comps…