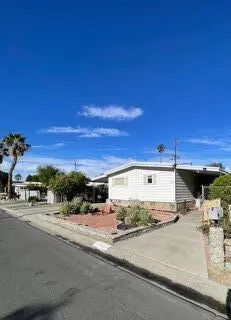
33460 Westchester Dr · Thousand Palms, CA
Flood risk 6/10 · Moderate
- FEMA flood zone
- AO
- Chance of flooding over 30 yrs
- 0.67%
- Est. flood insurance / yr
- $848 – $2,087
Fire risk 5/10 · Moderate
- Est. fire insurance / yr
- $659 – $1,223
Heat risk 9/10 · Severe
- Hot days now (above 114°F)
- 4 days/yr
- Hot days in 30 yrs
- 11 days/yr
Wind risk 1/10 · Minimal
- Chance of severe wind over 30 yrs
- —
Air-quality risk 4/10 · Minor
- Unhealthy air days now
- 5 days/yr
- Unhealthy air days in 30 yrs
- 7 days/yr
Risk factors via First Street. Map © Google.
Why this score? — see what drove the D+ grade
The composite is a weighted blend of 9 inputs, each scored 0–100. Each bar is that input's sub-score; the figure is the points it added to the 100-point composite (weight × sub-score).
- Cash flow +16.3/30.0
- ARV discount +7.9/15.0
- 1% rule +6.3/10.0
- DSCR +5.0/10.0
- Schools +2.7/10.0
- Livability +2.7/5.0
- Rent growth +2.5/5.0
- Condition / age +2.5/5.0
- Appreciation +0.0/10.0
$189,900
🖨 Deal sheet (PDF) 📄 Offer letter ✓ Due diligence
Listing remarks MLS
Charming Updated Golf-Course Home with Panoramic Views in Tri Palm Estates & Country Club! Discover affordable desert living in this beautifully updated 2-bedroom, 2-bath home perfectly situated on the 16th fairway, offering serene views of the pond and sweeping mountain vistas. Enjoy the scenery from your spacious wraparound deck—ideal for morning coffee, evening relaxation, and entertaining. Inside, the home features an updated kitchen with new appliances, fresh Luxury Vinyl Plank flooring, and taped & textured walls for a clean, modern feel. New double-pane windows enhance energy efficiency and comfort. This home is offered fully turnkey furnished, including all appliances—just move right in and start enjoying the lifestyle. Tri Palm Estates is an active 55+ community where you own the land, and ownership includes free, unlimited golf on both the 18-hole course and 9-hole par-3 course. Additional amenities include swimming pools and spas, tennis, pickleball, basketball, shuffleboard, a putting green, and a vibrant clubhouse with a banquet room, restaurant, bar, billiards, and free Wi-Fi. Conveniently located near Costco, Home Depot, Agua Caliente Rancho Mirage Casino, Eisenhower Health, and the acclaimed Acrisure Arena. With quick access to I-10, you're just minutes from the shopping, dining, and entertainment of Rancho Mirage, Palm Desert, and downtown Palm Springs. A wonderful opportunity to enjoy resort-style living with exceptional value—don't miss it!
Key facts
- Panoramic views
- Double pane windows
- New appliances
Tags
Neighborhood map
What this means for you Summary
Snapshot
- This is a 2-bed/2.0-bath manufactured listed at $190k.
Deal economics
- At list price, monthly cash flow is $-19 ($-224/yr) — negative.
- To cash-flow at today's rent, offer at most $187k (1.7% below list).
- Meets the 1% rule at list price ($2k rent vs $190k).
- Recommended offer: $167k (12.0% below list) — sets the bar for market timing.
- Cap rate 6.9% vs local median 5.2% in Thousand Palms — top-decile yield for the area; either an underpriced asset or a hidden risk that comps aren't pricing in. Stress-test before assuming the spread holds.
Location & tenants
- Location reads 53/100 on livability (#950 in CA) — a working-class tenant base; expect higher turnover. Strengths: housing A+; Watch: cost of living D, crime F, amenities F.
- Palm Springs Unified (suburban): math 21% / reading 42% proficiency, ranked #328 of 517 in CA (top 63%) — families likely to look elsewhere, expect single-tenant / working-renter base with shorter leases; 73% free/reduced lunch — lower-income household profile, screen leases tightly.
- Zoned schools: Della S. Lindley Elementary (584 students, 96% FRL); Nellie N. Coffman Middle (953 students, 98% FRL); Rancho Mirage High (math 15% / reading 38%, grade F, #804 of 1,170 statewide, top 69%, 1,491 students, 97% FRL) — zoned schools average 97% FRL vs 73% district-wide (24 pts higher); higher-poverty schools than district average — tighter screening recommended.
- Market conditions: 101 active listings in the ZIP; 14 comparable units currently listed for rent nearby; rentals lingering (median 46d on market — plan ~5-8 weeks vacancy on turnover, expect pricing pressure); 57% of comp listings sitting > 30 days — soft ceiling on asking rent; 9,195 units permitted in Riverside County in 2024 (1,512 in 5+ unit buildings).
Forward outlook
- Local home prices are declining (-3.0%/yr); year-one equity from $1k of loan paydown is wiped out by about $6k of value loss. Plan a longer hold.
- Riverside County population projected at +22% by 2050 — long-run rental-demand tailwind backs the buy-and-hold thesis.
Negotiation context
- It's been on market 184 days — a 12% lower offer ($167k) is reasonable based on typical stale-listing flexibility.
- 4 sale attempts since 22y ago with the ask held roughly flat each time — persistent listings suggest the price (not the market) is what's stuck; bring a comps-based counter.
- Current owner paid $116k; list at $190k implies a 63% gain — meaningful room to come down on a strong offer.
Risks & watch-outs
- Watch-outs: flood insurance adds $122/mo.
- Climate carrying-cost: in FEMA flood zone AO (mandatory federal flood insurance); moderate wildfire risk; extreme-heat days projected 4→11/yr by 2055 (HVAC capex compounding) — expect insurance premiums to compound above CPI over the hold.
Questions for the listing agent
- What do current leases actually rent for vs. the listed asking? Can we see a recent rent roll and the last 12 months of T-12 income?
- It's been on market 184 days. Have you received any prior offers? Is the seller open to a 12% concession, seller financing, or rate buy-down credit?
- Built in 1974 — when were the roof, HVAC, electrical panel, plumbing, and water heater last replaced?
- What's the actual annual flood-insurance premium (NFIP or private), and is the property in a SFHA with mandatory coverage?
- What does the HOA fee cover, when was the last increase, and are there any pending special assessments or reserve-fund shortfalls?
- Why hasn't it sold? Are there any deal-killer items the seller is aware of (foundation, flood, title, zoning, code violations)?
- Is there a deadline driving the sale (1031 exchange, divorce, estate, relocation)? That informs how much negotiation room exists.
- Schools are F-rated, which usually means shorter tenancies and higher turnover. Who's the typical renter profile here, and what's been the actual vacancy rate?
- Crime grade is F in this area — have there been break-ins, vandalism, or insurance claims at this property in the last 3 years? What carrier currently insures it and at what premium?
- The area grade is low — what's the realistic commute time and amenity access for the typical tenant pool here? Any planned neighborhood developments (good or bad) we should know about?
- What's the average days-on-market for RENTAL listings here right now (not sales)? A rising rental-DOM trend means longer vacancies and softer asking-rent achievability than the comps imply.
- What's the recent tenant-quality profile in this submarket — average credit score on applications, eviction rate, late-payment / NSF rate, and stable-employment percentage? A property-management company in the area should have these aggregated.
- How much new for-sale + rental construction is in the pipeline within 1–3 miles? Heavy new supply typically softens prices + rents 12–24 months out; constrained supply supports both.
Investment metrics
- 1% rule
- 1.13% ✓
- Cap rate
- 6.95%
- Cash-on-cash
- 2.34%
- DSCR
- 1.10
- GRM
- 7.4
CMA / ARV
- ARV (median comp)
- $191,476
- List price
- $189,900
- Delta
- -0.82%
- Verdict
- FAIR
- Comps
- 20 within 1.0 mi
Show comp detail 12 sales within ~0.75 mi
| Address | Dist | Beds/Ba | Sqft | Sold | Price | $/sf | Match |
|---|---|---|---|---|---|---|---|
| 33460 Westchester Dr | 0.00mi | 2/2.0 | 1,344 (0%) | 0mo | $169,000 | $126 | 100 |
| 33720 Westchester | 0.14mi | 2/2.0 | 1,344 (0%) | 2mo | $163,900 | $122 | 92 |
| 33261 Westchester Dr | 0.11mi | 2/2.0 | 1,296 (-4%) | 1mo | $190,000 | $147 | 88 |
| 73311 San Carlos Dr | 0.10mi | 2/2.0 | 1,440 (+7%) | 2mo | $275,000 | $191 | 82 |
| 33231 Laura Dr | 0.39mi | 2/2.0 | 1,344 (0%) | 2mo | $194,500 | $145 | 80 |
| 73420 Algonquin Pl | 0.44mi | 2/2.0 | 1,344 (0%) | 2mo | $200,000 | $149 | 77 |
| 73477 Broadmoor Dr | 0.31mi | 2/2.0 | 1,440 (+7%) | 1mo | $227,000 | $158 | 73 |
| 33490 Carlsbad Cir | 0.34mi | 2/2.0 | 1,440 (+7%) | 2mo | $197,000 | $137 | 71 |
| 32620 Bloomfield Ave Ave | 0.37mi | 2/2.0 | 1,248 (-7%) | 1mo | $150,000 | $120 | 70 |
| 32660 San Miguelito Dr | 0.38mi | 2/2.0 | 1,440 (+7%) | 2mo | $205,000 | $142 | 68 |
| 33411 San Lucas Trl | 0.23mi | 2/2.0 | 1,536 (+14%) | 2mo | $230,000 | $150 | 64 |
| 73331 Pine Vly | 0.55mi | 2/2.0 | 1,168 (-13%) | 3mo | $65,000 | $56 | 50 |
Match score weights: distance 35% · size 25% · config 20% · recency 20%. Top-matched comps best support the ARV.
Projected returns pro-forma
-3.0% appreciation · 3.0% rent growth · sell at horizon
- IRR
- -16.8%
- Equity multiple
- 0.40×
- Total profit
- $-31,684
- Equity at exit
- $28,315
- IRR
- -8.4%
- Equity multiple
- 0.47×
- Total profit
- $-27,999
- Equity at exit
- $16,419
Cash invested: $53,172 (down + closing). Projections, not guarantees.
Landlord ↔ Tenant lean methodology
- Overall (STATE)
- 18 Strongly Tenant-Friendly
- State California
- 18 Strongly Tenant-Friendly · D+13
- County
- — inherits STATE
- City
- — inherits STATE
ZIP-level market 92276
- Home prices YoY
- -10.9%
- Active inventory
- 101
- Price-to-rent
- 7.4×
Monthly cashflow live
- Estimated rent
- $2,139 high interval (Pro) →
- Mortgage (P&I)
- −$996
- Tax from tax record
- −$183 /mo · $2,197/yr
- Insurance
- −$79
- Flood insurance flood zone
- −$122 /mo · $1,468/yr
- HOA
- −$328
- Vacancy / Maint / Mgmt
- −$449
- Net cashflow
- $-19
Break-even live
Sensitivity live
| Price | -10% $89 | -5% $35 | +0% $-19 | +5% $-72 | +10% $-126 |
|---|---|---|---|---|---|
| Rent | -10% $-188 | -5% $-103 | +0% $-19 | +5% $66 | +10% $150 |
| Rate | -1.0pp $77 | -0.5pp $30 | base $-19 | +0.5pp $-68 | +1.0pp $-118 |
UW: 25.0% down · 7.5% · 30yr · 1.5% tax · 5.0% vac · 8.0% maint · 8.0% mgmt
Financing live
Cash to close
- Down payment
- $47,475
- Closing costs
- $5,697
- Reserves months
- —
- Total cash needed
- —
Loan-product check · same deal, 3 products live
Conventional
25% down · 7.5% · 30yr
- Down + closing
- —
- Monthly P&I
- —
- Monthly cashflow
- —
- DSCR
- —
- Eligible?
- —
Personal DTI + credit; lowest rate.
DSCR
20% down · 8.5% · 30yr
- Down + closing
- —
- Monthly P&I
- —
- Monthly cashflow
- —
- DSCR
- —
- Eligible?
- —
No personal income docs; deal must DSCR.
Hard money
10% down · 12.0% · 12mo
- Down + closing
- —
- Monthly P&I
- —
- Monthly cashflow
- —
- DSCR
- —
- Eligible?
- —
Short-term bridge; refi at stabilization.
Rent comps 14 comps
| Address | Beds | Baths | Sqft | Rent | $/sqft | DOM | Units | Dist |
|---|---|---|---|---|---|---|---|---|
| 33371 Tubac Trl Thousand Palms, CA | 2.0 | 2.0 | 1464 | $1,800 | $1.23 | 22d | 1 | 0.05mi |
| 33371 Tubac Trl Thousand Palms, CA | 2.0 | 2.0 | 1464 | $2,000 | $1.37 | 45d | 1 | 0.05mi |
| 32567 Southern Hills Ave Thousand Palms, CA | 3.0 | 1.0 | 912 | $1,399 | $1.53 | 45d | 1 | 0.37mi |
| 32545 Westchester Dr Thousand Palms, CA | 2.0 | 2.0 | 1200 | $1,950 | $1.62 | 26d | 1 | 0.42mi |
| 32373 Chiricahua Dr Thousand Palms, CA | 3.0 | 2.0 | 1344 | $2,500 | $1.86 | 45d | 1 | 0.65mi |
| 73951 White Sands Dr Thousand Palms, CA | 3.0 | 2.0 | 1517 | $3,200 | $2.11 | 0d | 1 | 0.76mi |
| 73274 Azure Rain #104 Palm Desert, CA | 2.0 | 2.0 | 1205 | $2,399 | $1.99 | 45d | 1 | 0.83mi |
| 31577 Via Pared Thousand Palms, CA | 3.0 | 2.0 | 1300 | $2,500 | $1.92 | 20d | 1 | 1.11mi |
| 73528 Cierra St Palm Desert, CA | 3.0 | 2.0 | 1547 | $2,995 | $1.94 | 16d | 1 | 1.15mi |
| 35460 Domani Dr Palm Desert, CA | 3.0 | 3.0 | 1705 | $2,800 | $1.64 | 9d | 1 | 1.23mi |
| 35515 Bains Ave Palm Desert, CA | 3.0 | 2.5 | 1705 | $3,399 | $1.99 | 45d | 1 | 1.26mi |
| 35751 Gateway Dr Palm Desert, CA | 1.0–3.0 | 1.0–2.0 | 1170 | $2,570 | $2.20 | 45d | 1 | 1.27mi |
| 91 Augusta Dr Rancho Mirage, CA | 2.0 | 2.0 | 1620 | $5,290 | $3.27 | 45d | 1 | 1.39mi |
| 36101 Explorer Dr Palm Desert, CA | 1.0–3.0 | 1.0 | 805 | $1,478 | $1.84 | 45d | 1 | 1.49mi |
HOA detail
- Monthly dues
- $328 · $3,936/yr
- Likely covers
- internetpool
Listing history 23 events
-
2026-06-08statusdays on market $189,900 Pending 184 DOM
-
2026-06-07days on market $189,900 Active 183 DOM
-
2026-06-04days on market $189,900 Active 180 DOM
-
2026-06-03days on market $189,900 Active 179 DOM
-
2026-06-02days on market $189,900 Active 178 DOM
-
2026-06-01days on market $189,900 Active 177 DOM
-
2026-05-31days on market $189,900 Active 176 DOM
-
2025-11-29$189,900 Active 1513-char remark
Show marketing remark (1513 chars)
Charming Updated Golf-Course Home with Panoramic Views in Tri Palm Estates & Country Club! Discover affordable desert living in this beautifully updated 2-bedroom, 2-bath home perfectly situated on the 16th fairway, offering serene views of the pond and sweeping mountain vistas. Enjoy the scenery from your spacious wraparound deck—ideal for morning coffee, evening relaxation, and entertaining. Inside, the home features an updated kitchen with new appliances, fresh Luxury Vinyl Plank flooring, and taped & textured walls for a clean, modern feel. New double-pane windows enhance energy efficiency and comfort. This home is offered fully turnkey furnished, including all appliances—just move right in and start enjoying the lifestyle. Tri Palm Estates is an active 55+ community where you own the land, and ownership includes free, unlimited golf on both the 18-hole course and 9-hole par-3 course. Additional amenities include swimming pools and spas, tennis, pickleball, basketball, shuffleboard, a putting green, and a vibrant clubhouse with a banquet room, restaurant, bar, billiards, and free Wi-Fi. Conveniently located near Costco, Home Depot, Agua Caliente Rancho Mirage Casino, Eisenhower Health, and the acclaimed Acrisure Arena. With quick access to I-10, you're just minutes from the shopping, dining, and entertainment of Rancho Mirage, Palm Desert, and downtown Palm Springs. A wonderful opportunity to enjoy resort-style living with exceptional value—don't miss it!
-
2025-06-06historical
-
2025-04-07price $185,000
-
2025-03-21$195,000 Active
-
2011-03-01soldstatus $116,500 Closed
-
2011-03-01soldstatus $116,500 Closed
-
2011-02-28soldstatus $60,000
-
2011-02-01historical
-
2011-01-12price $124,500
-
2010-10-26price $129,900
-
2010-07-09price $139,900
-
2010-02-26price $149,900
-
2009-10-01$159,900 Active
-
2004-11-01soldstatus $159,500
-
2004-09-24historical
-
2004-08-20$159,900
ⓘ Source: listings_history table (triggers on properties + properties_extension) + one-shot
backfill from property_details.listing_events for pre-trigger history.
Tax reassessment forecast CA · Resets to sale price
- Current annual tax
- $2,197 · $183/mo
- Projected year-2 tax
- $2,197 · $183/mo
- Expected delta
- $0/yr ($0/mo · 0.0%)
ⓘ Screening estimate from a state-policy table — verify with the county assessor before closing.
Climate risk First Street
- Flood 6/10 Major FEMA zone AO · 67% chance over 30 yrs
- Wildfire 5/10 Major
- Heat 9/10 Extreme 4 d/yr ≥114°F today · 11 d/yr by 30 yrs out
- Wind 1/10 Low
- Air quality 4/10 Moderate 5 unhealthy d/yr today · 7 by 30 yrs out
Nearby sold comps map
Loading sold comps map…
Walkable amenities ~0.75 mi
Loading nearby amenities…
Taxation est. · year 1
- Rental income
- $25,666
- − Mortgage interest
- −$10,637
- − Property taxes
- −$2,197
- − Insurance
- −$2,417
- − Repairs & maintenance
- −$2,053
- − Management
- −$2,053
- − HOA
- −$3,936
- − Depreciation
- −$5,524
- Taxable loss
- −$3,152
- Est. tax savings @ 24.0%
- +$756
- After-tax cash flow
- $533/yr
For passive investors: Depreciation is non-cash, so a rental often shows a tax loss while cash-flowing — sheltering income. Rental losses are passive: they offset passive income freely, and up to $25,000/yr can offset ordinary (W-2) income if you actively participate and your MAGI is under $100k (phasing out to $0 by $150k); unused losses carry forward. On sale, claimed depreciation is recaptured at up to 25%, and gains may owe capital-gains tax (a 1031 exchange can defer both). Figures are a year-1 estimate at your 24.0% rate — not tax advice; consult a CPA.
Schools (NCES district)
- District
- Palm Springs Unified
- NCES district ID
- 0629550
- Math proficiency
- 21% ▼ -7.00%
- Reading proficiency
- 42% ▬ 0.00%
- Median HH income
- $43,638
- Composite
- 26.76/100
- National rank
- #7131
- State rank
- #328 of 517 in CA
Livability — Thousand Palms
- Score
- 53/100
- State rank
- #950
- US rank
- #24426
Category grades
Schools grade is shown separately in the Schools card above.
Census & demographics
- Census place
- Thousand Palms, CA
- City population
- 7,662
- Population (ZIP)
- 7,662
Population outlook (Riverside County) Hauer SSP2
- Today (2025)
- 2,664,475 people
- By 2030
- 2,802,692 · +5.2%
- By 2040
- 3,050,904 · +14.5%
- By 2050
- 3,256,783 · +22.2%
- By 2075
- 3,655,058 · +37.2%
- By 2100
- 3,766,594 · +41.4%
Race, ethnicity, and origin ACS 2023
- Neighborhood character
- Majority Hispanic (64%)
- Race & ethnicity
- Hispanic / Latino 64% Two or more races 43% White 32% Native American 4%
- Hispanic origin (detail)
- Mexican 62%
- Common ancestry
- Slovak 2% Lithuanian 1% Portuguese 1%
- Foreign-born
- 16% · Canada
- Languages at home
- 54% English-only · Spanish 43% German/W. Germanic 1% Other Indo-European 1%
Political lean MEDSL · Riverside
- 2024 margin
- Toss-up / Even · D 48.0% · R 49.3% · Other 2.6%
- 2008→2024 swing
- -3.6pp toward R · 2008: 2.3pp · 2024: -1.3pp
- All cycles
- 2024: R+1.3 2020: D+8.0 2016: D+4.3 2012: R+0.4 2008: D+2.3
Not yet ingested
- Civics
- —
Market trends
- HPI YoY
- ▼ -46.86%
- Current HPI
- 382.4439
- Rent YoY
- —
- Metro
- —
- State GDP YoY
- ▲ 3.21%
- F500 in state
- 116
Industry mix (Fortune 500 HQ in CA)
| Industry | F500 HQs | Revenue |
|---|---|---|
| Technology | 27 | $1,492B |
|
||
| Financial Services | 3 | $174B |
|
||
| Retail | 3 | $44B |
|
||
| Insurance | 3 | $26B |
|
||
| Media / Entertainment | 2 | $115B |
|
||
| Pharmaceuticals / Biotech | 2 | $62B |
|
||
Price history
+18.8% since first listed16 events — show timeline
- 2025-11-29 Listed $189,900 GPSMLS
- 2025-06-06 Listing Removed — GPSMLS
- 2025-04-07 Price Changed $185,000 GPSMLS
- 2025-03-21 Listed $195,000 GPSMLS
- 2011-03-01 Sold (MLS) $116,500 GPSMLS
- 2011-03-01 Sold (MLS) $116,500 GPSMLS
- 2011-02-28 Sold (Public Records) $60,000 Public Records
- 2011-02-01 Listing Removed — GPSMLS
- 2011-01-12 Price Changed $124,500 GPSMLS
- 2010-10-26 Price Changed $129,900 GPSMLS
- 2010-07-09 Price Changed $139,900 GPSMLS
- 2010-02-26 Price Changed $149,900 GPSMLS
- 2009-10-01 Listed $159,900 GPSMLS
- 2004-11-01 Sold (Public Records) $159,500 Public Records
- 2004-09-24 Listing Removed — GPSMLS
- 2004-08-20 Listed $159,900 GPSMLS
Property tax history
+0.9%/yrLatest (2025): $2,197 · +0.2% YoY. Source: county tax records.
Cash-flow waterfall
monthlySold comps — $/sqft
last 12 mo · ≤1 miLoading sold comps…