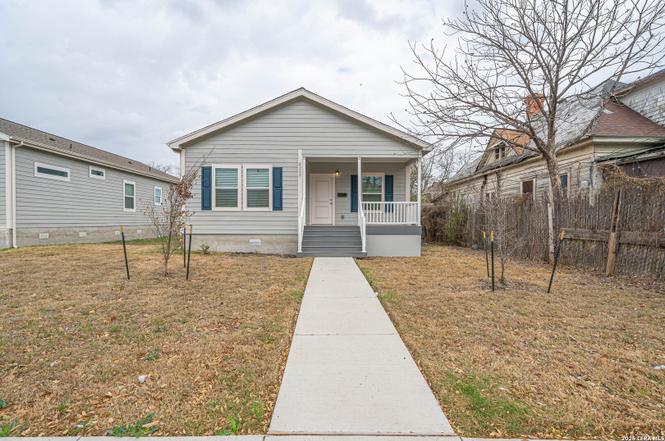
2111 W Houston · San Antonio, TX
Flood risk 1/10 · Minimal
- FEMA flood zone
- X (unshaded)
- Chance of flooding over 30 yrs
- 0.0%
- Est. flood insurance / yr
- $507 – $1,088
Fire risk 1/10 · Minimal
- Est. fire insurance / yr
- $1,222 – $2,270
Heat risk 8/10 · Major
- Hot days now (above 109°F)
- 7 days/yr
- Hot days in 30 yrs
- 22 days/yr
Wind risk 6/10 · Moderate
- Chance of severe wind over 30 yrs
- 77.0%
Air-quality risk 2/10 · Minimal
- Unhealthy air days now
- 1 days/yr
- Unhealthy air days in 30 yrs
- 2 days/yr
Risk factors via First Street. Map © Google.
Why this score? — see what drove the D grade
The composite is a weighted blend of 9 inputs, each scored 0–100. Each bar is that input's sub-score; the figure is the points it added to the 100-point composite (weight × sub-score).
- Cash flow +11.4/30.0
- Appreciation +10.0/10.0
- Rent growth +4.4/5.0
- Livability +4.0/5.0
- Condition / age +4.0/5.0
- 1% rule +3.3/10.0
- DSCR +3.3/10.0
- Schools +1.4/10.0
- ARV discount +0.0/15.0
$235,000
🖨 Deal sheet 📄 Offer letter ✓ Due diligence
Listing remarks
Welcome to 2111 Houston, built in 2023, just minutes from downtown San Antonio! This property features an open layout with a modern kitchen complete with stainless steel appliances, granite countertops, and updated cabinetry. Newer construction provides a peace of mind, and there's no HOA for added flexibility. Spacious bedrooms and a manageable backyard make it ideal for families. Conveniently located near Our Lady of the Lake University, Woodlawn Lake Park, and Market Square, with easy access to I-10 and Hwy 90 for quick commutes, shopping, and dining.
Key facts
- Newer construction
- Modern kitchen
- Granite countertops
Tags
Neighborhood map
What this means for you Summary
Snapshot
- This is a 4-bed/2.0-bath single-family listed at $235k. Condition is rated good.
Deal economics
- At list price, monthly cash flow is $-81 ($-968/yr) — negative.
- To cash-flow at today's rent, offer at most $223k (5.0% below list).
- To meet the 1% rule (rent ≥ 1% of price), the offer needs to be $195k (16.9% below list).
- Recommended offer: $195k (16.9% below list) — sets the bar for 1% rule.
- Cap rate 5.9% vs local median 3.8% in San Antonio — top-decile yield for the area; either an underpriced asset or a hidden risk that comps aren't pricing in. Stress-test before assuming the spread holds.
Location & tenants
- Location reads 80/100 on livability (#31 in TX, #1,616 nationally) — a professional / high-income tenant draw. Strengths: amenities A+, commute A+, cost of living A+; Watch: schools C-, crime F.
- San Antonio ISD (urban): math 12% / reading 22% proficiency, ranked #805 of 826 in TX (top 98%) — low school quality limits family demand, transient renter base, plan for 1-2y turnover; 80% free/reduced lunch — lower-income household profile, screen leases tightly.
- Market conditions: Rents rising fast (+7.7%/yr); 154 active listings in the ZIP; 22 comparable units currently listed for rent nearby; rentals at typical pace (median 24d on market — plan ~3-4 weeks tenant-placement turnaround); lower-income renter base — watch delinquency; 8,308 units permitted in Bexar County in 2024 (2,506 in 5+ unit buildings).
- At $1,954/mo this rent would consume 72% of the median local household income ($32k/yr) (locally 2789% of renters already pay >50% of income on rent) — very limited rent-growth headroom before tenants either downsize or default.
Forward outlook
- In year one you build about $25k of equity ($2k loan paydown + $24k appreciation (10.0% local appreciation)).
- Bexar County population projected at +50% by 2050 — long-run rental-demand tailwind backs the buy-and-hold thesis.
- At projected returns (10.0% appreciation + 7.7% rent growth), your $66k cash investment doubles in ~3 years — after that, you're playing with house money.
- By year 2, paydown + projected appreciation supports a ~$40k cash-out refi (75% LTV) — recoverable capital for the next deal without selling this one.
Negotiation context
- It's been on market 21 days — a 2% lower offer ($231k) is reasonable based on typical stale-listing flexibility.
Risks & watch-outs
- Climate carrying-cost: major wind risk, 77% chance of damaging wind over 30y; extreme-heat days projected 7→22/yr by 2055 (HVAC capex compounding) — expect insurance premiums to compound above CPI over the hold.
Questions for the listing agent
- What do current leases actually rent for vs. the listed asking? Can we see a recent rent roll and the last 12 months of T-12 income?
- Is there a deadline driving the sale (1031 exchange, divorce, estate, relocation)? That informs how much negotiation room exists.
- Crime grade is F in this area — have there been break-ins, vandalism, or insurance claims at this property in the last 3 years? What carrier currently insures it and at what premium?
- The area grade is low — what's the realistic commute time and amenity access for the typical tenant pool here? Any planned neighborhood developments (good or bad) we should know about?
- What's the average days-on-market for RENTAL listings here right now (not sales)? A rising rental-DOM trend means longer vacancies and softer asking-rent achievability than the comps imply.
- What's the recent tenant-quality profile in this submarket — average credit score on applications, eviction rate, late-payment / NSF rate, and stable-employment percentage? A property-management company in the area should have these aggregated.
- How much new for-sale + rental construction is in the pipeline within 1–3 miles? Heavy new supply typically softens prices + rents 12–24 months out; constrained supply supports both.
Investment metrics
- 1% rule
- 0.83% ✗
- Cap rate
- 5.88%
- Cash-on-cash
- -1.47%
- DSCR
- 0.93
- GRM
- 10.0
CMA / ARV
- ARV (on-the-fly)
- $177,555
- Comps found
- 5
Show comp detail 5 sales within ~0.75 mi
| Address | Dist | Beds/Ba | Sqft | Sold | Price | $/sf | Match |
|---|---|---|---|---|---|---|---|
| 2111 W Houston | 0.00mi | 4/2.0 | 1,869 (0%) | 1mo | $235,000 | $126 | 99 |
| 1421 Monterey | 0.33mi | 3/2.0 (-1) | 1,875 (+0%) | 12mo | $134,900 | $72 | 69 |
| 1212 Morales | 0.36mi | 3/2.0 (-1) | 1,900 (+2%) | 7mo | $229,999 | $121 | 69 |
| 519 N San Marcos | 0.61mi | 3/2.0 (-1) | 1,884 (+1%) | 6mo | $179,000 | $95 | 60 |
| 609 Ruiz St | 0.64mi | 3/1.5 (-1) | 1,628 (-13%) | 9mo | $70,000 | $43 | 34 |
Match score weights: distance 35% · size 25% · config 20% · recency 20%. Top-matched comps best support the ARV.
Projected returns pro-forma
10.0% appreciation · 7.73% rent growth · sell at horizon
- IRR
- 24.8%
- Equity multiple
- 3.02×
- Total profit
- $132,622
- Equity at exit
- $211,707
- IRR
- 23.2%
- Equity multiple
- 7.36×
- Total profit
- $418,527
- Equity at exit
- $456,553
Cash invested: $65,800 (down + closing). Projections, not guarantees.
Landlord ↔ Tenant lean methodology
- Overall (STATE)
- 87 Strongly Landlord-Friendly
- State Texas
- 87 Strongly Landlord-Friendly · R+5
- County
- — inherits STATE
- City
- — inherits STATE
ZIP-level market 78207
- Home prices YoY
- 15.2%
- Rents YoY
- 7.7%
- Active inventory
- 154
- Price-to-rent
- 10.0×
Monthly cashflow live
- Estimated rent
- $1,954 high interval (Pro) →
- Mortgage (P&I)
- −$1,232
- Tax est. 1.5%
- −$294 /mo · $3,525/yr
- Insurance
- −$98
- HOA
- −$0
- Vacancy / Maint / Mgmt
- −$410
- Net cashflow
- $-81
Break-even live
UW: 25.0% down · 7.5% · 30yr · 1.5% tax · 5.0% vac · 8.0% maint · 8.0% mgmt
Financing live
Cash to close
- Down payment
- $58,750
- Closing costs
- $7,050
- Reserves months
- —
- Total cash needed
- —
Loan-product check · same deal, 3 products live
Conventional
25% down · 7.5% · 30yr
- Down + closing
- —
- Monthly P&I
- —
- Monthly cashflow
- —
- DSCR
- —
- Eligible?
- —
Personal DTI + credit; lowest rate.
DSCR
20% down · 8.5% · 30yr
- Down + closing
- —
- Monthly P&I
- —
- Monthly cashflow
- —
- DSCR
- —
- Eligible?
- —
No personal income docs; deal must DSCR.
Hard money
10% down · 12.0% · 12mo
- Down + closing
- —
- Monthly P&I
- —
- Monthly cashflow
- —
- DSCR
- —
- Eligible?
- —
Short-term bridge; refi at stabilization.
Rent comps 22 comps
| Address | Beds | Baths | Sqft | Rent | $/sqft | DOM | Units | Dist |
|---|---|---|---|---|---|---|---|---|
| 2246 W Houston St San Antonio, TX | 4.0 | 3.0 | 1654 | $2,100 | $1.27 | 11d | 1 | 0.13mi |
| 2425 Monterey St San Antonio, TX | 3.0 | 2.0 | 1416 | $2,000 | $1.41 | 44d | 1 | 0.51mi |
| 143 Huntington St Unit 101 San Antonio, TX | 3.0 | 2.5 | 2298 | $1,550 | $0.67 | 44d | 1 | 0.62mi |
| 709 S Chupaderas St San Antonio, TX | 3.0 | 2.0 | 1518 | $1,345 | $0.89 | 24d | 1 | 0.68mi |
| 811 Rivas St San Antonio, TX | 3.0 | 2.0 | 1276 | $1,580 | $1.24 | 24d | 1 | 0.71mi |
| 2811 Buena Vista St San Antonio, TX | 4.0 | 2.0 | 1750 | $2,350 | $1.34 | 24d | 1 | 0.72mi |
| 230 Micklejohn St San Antonio, TX | 3.0 | 2.0 | 1368 | $1,595 | $1.17 | 24d | 1 | 0.97mi |
| 230 Micklejohn St San Antonio, TX | 3.0 | 2.0 | 1368 | $1,695 | $1.24 | 44d | 1 | 0.98mi |
| 1230 Rivas St San Antonio, TX | 3.0 | 2.5 | 1287 | $1,999 | $1.55 | 24d | 1 | 1.02mi |
| 210 Cadwallader St San Antonio, TX | 4.0 | 2.5 | 1396 | $1,975 | $1.41 | 44d | 1 | 1.05mi |
| 1615 N Navidad St Unit 101 San Antonio, TX | 3.0 | 2.0 | 1804 | $999 | $0.55 | 4d | 1 | 1.06mi |
| 1011 S Frio St San Antonio, TX | 3.0 | 1.0–3.0 | 1121 | $2,195 | $1.96 | 2d | 32 | 1.13mi |
| 939 S Frio St Unit 3294 San Antonio, TX | 3.0 | 2.0 | 1737 | $2,277 | $1.31 | 3d | 1 | 1.14mi |
| 100 N Santa Rosa San Antonio, TX | 3.0 | 1.0–3.0 | 1299 | $3,845 | $2.96 | 2d | 39 | 1.24mi |
| 3610 Palmwood Ter San Antonio, TX | 4.0 | 2.0 | 1634 | $1,799 | $1.10 | 44d | 1 | 1.26mi |
| 219 Princeton Ave San Antonio, TX | 3.0 | 2.0 | 1230 | $2,200 | $1.79 | 24d | 1 | 1.27mi |
| 603 W Euclid Ave #2 San Antonio, TX | 3.0 | 3.5 | 1887 | $2,775 | $1.47 | 3d | 1 | 1.28mi |
| 603 W Euclid Ave #4 San Antonio, TX | 3.0 | 3.5 | 2100 | $3,150 | $1.50 | 44d | 1 | 1.28mi |
| 135 Harvard Ter San Antonio, TX | 3.0 | 2.0 | 1509 | $1,875 | $1.24 | 4d | 1 | 1.29mi |
| 123 Park Ct San Antonio, TX | 3.0 | 2.0 | 1368 | $1,995 | $1.46 | 44d | 1 | 1.33mi |
| 1623 W Ashby Pl San Antonio, TX | 4.0 | 2.0 | 1556 | $1,900 | $1.22 | 24d | 1 | 1.46mi |
| 300 N Main Ave San Antonio, TX | 3.0 | 1.0–2.5 | 1153 | $10,437 | $9.05 | 2d | 101 | 1.47mi |
Listing history 4 events
-
2026-05-22soldstatus Sold
-
2026-04-03status Pending
-
2026-03-28price $235,000
-
2026-03-12$239,900 New
ⓘ Source: listings_history table (triggers on properties + properties_extension) + one-shot
backfill from property_details.listing_events for pre-trigger history.
Climate risk First Street
- Flood 1/10 Low FEMA zone X (unshaded) · 0% chance over 30 yrs
- Wildfire 1/10 Low
- Heat 8/10 Severe 7 d/yr ≥109°F today · 22 d/yr by 30 yrs out
- Wind 6/10 Major 77% chance of damaging wind over 30 yrs
- Air quality 2/10 Low 1 unhealthy d/yr today · 2 by 30 yrs out
Nearby sold comps map
Loading sold comps map…
Walkable amenities ~0.75 mi
Loading nearby amenities…
Taxation est. · year 1
- Rental income
- $23,444
- − Mortgage interest
- −$13,164
- − Property taxes
- −$3,525
- − Insurance
- −$1,175
- − Repairs & maintenance
- −$1,876
- − Management
- −$1,876
- − Depreciation
- −$6,836
- Taxable loss
- −$5,007
- Est. tax savings @ 24.0%
- +$1,202
- After-tax cash flow
- $234/yr
For passive investors: Depreciation is non-cash, so a rental often shows a tax loss while cash-flowing — sheltering income. Rental losses are passive: they offset passive income freely, and up to $25,000/yr can offset ordinary (W-2) income if you actively participate and your MAGI is under $100k (phasing out to $0 by $150k); unused losses carry forward. On sale, claimed depreciation is recaptured at up to 25%, and gains may owe capital-gains tax (a 1031 exchange can defer both). Figures are a year-1 estimate at your 24.0% rate — not tax advice; consult a CPA.
Condition & rehab AI · 13 photos
This 2023-built home in San Antonio is in good condition with modern updates and a well-maintained exterior. It offers a good investment opportunity with potential for further value enhancement through minor improvements.
Value-add opportunities
- Both Painting the exterior — Fresh paint can enhance curb appeal and property value.
- Both Landscaping improvements — A well-maintained yard can increase both resale and rental value.
- Both Adding smart home features — Smart home features can increase both resale and rental value by making the home more modern and convenient.
Renovation cost estimate screening
Value-add ROI direction
- Both Painting the exterior — Fresh paint can enhance curb appeal and property value. ↑
- Both Landscaping improvements — A well-maintained yard can increase both resale and rental value. ↑
- Both Adding smart home features — Smart home features can increase both resale and rental value by making the home more modern and convenient. ↑
ⓘ Cost ranges are severity-bucket heuristics (US national rule-of-thumb). Get contractor quotes + a written scope before underwriting a rehab budget.
Schools (NCES district)
- District
- San Antonio ISD
- NCES district ID
- 4838730
- Math proficiency
- 12% ▼ -21.00%
- Reading proficiency
- 22% ▼ -7.00%
- Median HH income
- $30,952
- Composite
- 13.57/100
- National rank
- #9512
- State rank
- #805 of 826 in TX
Livability — San Antonio
- Score
- 80/100
- State rank
- #31
- US rank
- #1616
Category grades
Schools grade is shown separately in the Schools card above.
Census & demographics
- Census place
- San Antonio, TX
- County
- Bexar County · 1,990,555 people
- City population
- 1,806,925
- Metro
- San Antonio-New Braunfels, TX
- Population (ZIP)
- 55,474
- Household income
- $32,472
- Rent vs Own
- Severe rent burden
- 2789.0
Population outlook (Bexar County) Hauer SSP2
- Today (2025)
- 2,336,851 people
- By 2030
- 2,560,728 · +9.6%
- By 2040
- 3,020,569 · +29.3%
- By 2050
- 3,493,522 · +49.5%
- By 2075
- 4,668,459 · +99.8%
- By 2100
- 5,533,242 · +136.8%
Race, ethnicity, and origin ACS 2023
- Neighborhood character
- Predominantly Hispanic (88%)
- Race & ethnicity
- Hispanic / Latino 88% Two or more races 41% White 6% Black 5% Native American 2%
- Hispanic origin (detail)
- Mexican 79%
- Foreign-born
- 19% · Canada
- Languages at home
- 39% English-only · Spanish 60%
Political lean MEDSL · Bexar
- 2024 margin
- Lean D (+9.8) · D 54.3% · R 44.6% · Other 1.1%
- 2008→2024 swing
- +4.2pp toward D · 2008: 5.6pp · 2024: 9.8pp
- All cycles
- 2024: D+9.8 2020: D+18.2 2016: D+13.5 2012: D+4.6 2008: D+5.6
Not yet ingested
- Civics
- —
Market trends
- HPI YoY
- ▲ 34.92%
- Current HPI
- 264.7559
- Rent YoY
- ▲ 7.73%
- Metro
- San Antonio-New Braunfels, TX
- State GDP YoY
- ▲ 3.95%
- F500 in state
- 110
Industry mix (Fortune 500 HQ in TX)
| Industry | F500 HQs | Revenue |
|---|---|---|
| Energy | 16 | $1,198B |
|
||
| Technology | 5 | $198B |
|
||
| Engineering / Construction | 4 | $72B |
|
||
| Energy Services | 3 | $60B |
|
||
| Utilities | 3 | $41B |
|
||
| Healthcare | 2 | $330B |
|
||
Price history
-2.0% since first listed4 events — show timeline
- 2026-05-22 Sold (MLS) — LERA
- 2026-04-03 Pending — LERA
- 2026-03-28 Price Changed $235,000 LERA
- 2026-03-12 Listed $239,900 LERA
Cash-flow waterfall
monthlySold comps — $/sqft
last 12 mo · ≤1 miLoading sold comps…