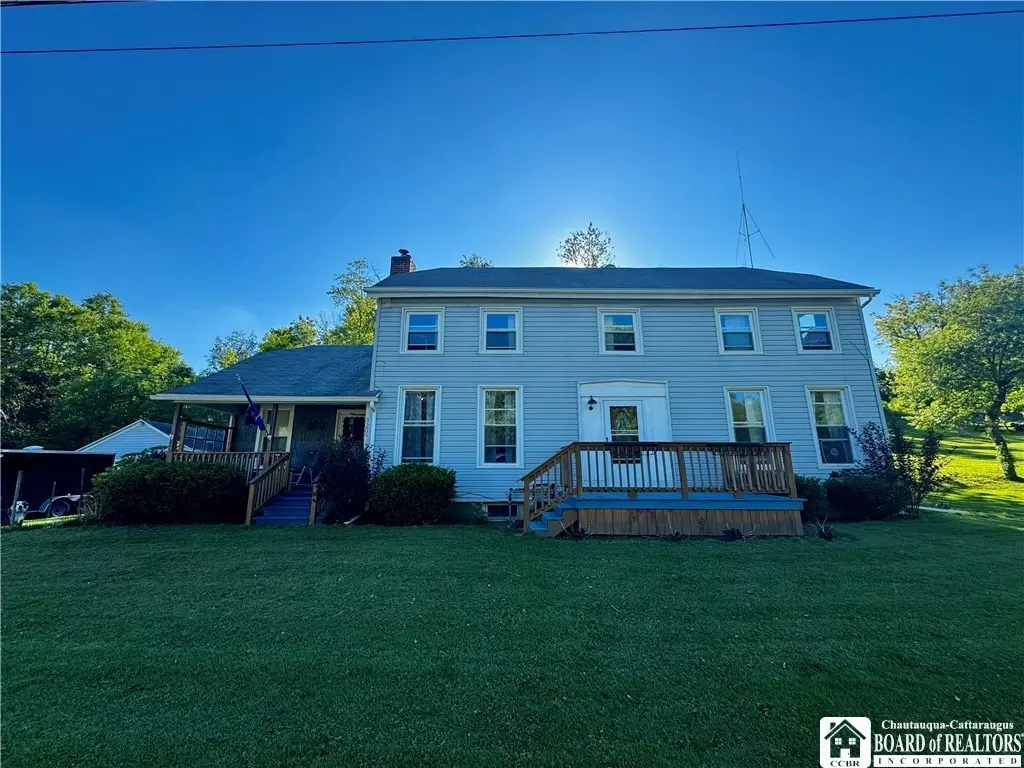
3209 Dutch Hollow Rd · Lakewood, NY
Flood risk 6/10 · Moderate
- FEMA flood zone
- X
- Chance of flooding over 30 yrs
- 0.73%
- Est. flood insurance / yr
- $473 – $860
Fire risk 1/10 · Minimal
- Est. fire insurance / yr
- $691 – $1,283
Heat risk 1/10 · Minimal
- Hot days now (above 91°F)
- 7 days/yr
- Hot days in 30 yrs
- 17 days/yr
Wind risk 1/10 · Minimal
- Chance of severe wind over 30 yrs
- —
Air-quality risk 2/10 · Minimal
- Unhealthy air days now
- 0 days/yr
- Unhealthy air days in 30 yrs
- 1 days/yr
Risk factors via First Street. Map © Google.
Why this score? — see what drove the B- grade
The composite is a weighted blend of 9 inputs, each scored 0–100. Each bar is that input's sub-score; the figure is the points it added to the 100-point composite (weight × sub-score).
- Cash flow +17.4/30.0
- ARV discount +15.0/15.0
- Appreciation +10.0/10.0
- Schools +5.5/10.0
- DSCR +5.4/10.0
- 1% rule +4.4/10.0
- Livability +3.6/5.0
- Rent growth +2.5/5.0
- Condition / age +2.5/5.0
$195,000
🖨 Deal sheet 📄 Offer letter ✓ Due diligence
Listing remarks MLS
This large 4 bedroom 2 full bath Colonial home sits on just shy of an acre of land in the Bemus Point School District. Oversized detached garage plus an additional 1 car metal garage with driveway entry are included. This country home is over 2200 sq feet with eat in kitchen, large central living room with a wood burning fire place w/ insert. Hardwood floors throughout, covered rear deck and front patio. First floor master bedroom suite. Located just a mile from Maple Grove HS.
Key facts
- Pole barn
- Updated electric
- Front porch
Tags
Property features AI
Exterior
- Parking: Detached garage with workshop; 2 garage spaces
- Utilities: Electricity connected (circuit breakers and fuses); Well water; Septic tank; High-speed internet available
- Home design: 2-story; Existing condition
- Construction: Vinyl siding; Asphalt roof; Stone foundation; Built previously (existing)
- Exterior features: Blacktop driveway; Gravel driveway; Irregular lot; Main thoroughfare frontage
Interior
- Kitchen: Dishwasher; Gas oven; Gas range
- Bedrooms: 2 main-level bedrooms
- Flooring: Hardwood; Laminate; Vinyl; Varies
- Bathrooms: 2 full bathrooms; 1 main-level bathroom
- Heating & cooling: Gas heating; Wood stove (see remarks)
- Interior features: Den; Eat-in kitchen; Separate/formal living room; Home office; Country kitchen; Has basement (full and crawl space); 3 fireplaces
- Laundry & utility: Gas water heater
Neighborhood map
What this means for you Summary
Snapshot
- This is a 4-bed/2.0-bath single-family listed at $195k.
Deal economics
- At list price, monthly cash flow is $146 ($2k/yr) — positive.
- The deal already cash-flows at list — no discount required.
- To meet the 1% rule (rent ≥ 1% of price), the offer needs to be $184k (5.7% below list).
- Recommended offer: $184k (5.7% below list) — sets the bar for 1% rule.
- Cap rate 7.2% vs local median 3.0% in Lakewood — top-decile yield for the area; either an underpriced asset or a hidden risk that comps aren't pricing in. Stress-test before assuming the spread holds.
Location & tenants
- Location reads 71/100 on livability (#398 in NY) — a middle-class / working-renter tenant base. Strengths: cost of living A+, housing A+, health & safety A+; Watch: schools D+, employment D+, amenities F.
- Bemus Point Central School District (rural): math 65% / reading 61% proficiency, ranked #238 of 755 in NY (top 32%) — acceptable for families but not a draw, mixed tenant base, ~2y average lease; only 18% free/reduced lunch — higher-income household profile.
- Market conditions: 47 active listings in the ZIP; 127 units permitted in Chautauqua County in 2024 (0 in 5+ unit buildings).
Forward outlook
- In year one you build about $21k of equity ($1k loan paydown + $20k appreciation (10.0% local appreciation)).
- Chautauqua County population projected at -22% by 2050 — secular population decline; favor cash flow + early exit over multi-decade hold.
- At projected returns (10.0% appreciation + 3.0% rent growth), your $55k cash investment doubles in ~3 years — after that, you're playing with house money.
- By year 2, paydown + projected appreciation supports a ~$34k cash-out refi (75% LTV) — recoverable capital for the next deal without selling this one.
Negotiation context
- Only 11 days on market — expect competitive offers; lowballing is unlikely to land.
- 3 sale attempts since 18y ago with the ask held roughly flat each time — persistent listings suggest the price (not the market) is what's stuck; bring a comps-based counter.
- Current owner paid $115k; list at $195k implies a 70% gain — meaningful room to come down on a strong offer.
Risks & watch-outs
- Watch-outs: built in 1930 — expect roof / HVAC / electrical / plumbing capex.
- Climate carrying-cost: major flood risk — expect insurance premiums to compound above CPI over the hold.
Questions for the listing agent
- Built in 1930 — when were the roof, HVAC, electrical panel, plumbing, and water heater last replaced?
- Is there a deadline driving the sale (1031 exchange, divorce, estate, relocation)? That informs how much negotiation room exists.
- Schools are D-rated, which usually means shorter tenancies and higher turnover. Who's the typical renter profile here, and what's been the actual vacancy rate?
- What's the average days-on-market for RENTAL listings here right now (not sales)? A rising rental-DOM trend means longer vacancies and softer asking-rent achievability than the comps imply.
- What's the recent tenant-quality profile in this submarket — average credit score on applications, eviction rate, late-payment / NSF rate, and stable-employment percentage? A property-management company in the area should have these aggregated.
- How much new for-sale + rental construction is in the pipeline within 1–3 miles? Heavy new supply typically softens prices + rents 12–24 months out; constrained supply supports both.
Investment metrics
- 1% rule
- 0.94% ✗
- Cap rate
- 7.19%
- Cash-on-cash
- 3.21%
- DSCR
- 1.14
- GRM
- 8.8
CMA / ARV
- ARV (on-the-fly)
- $245,300
- Comps found
- 1
Show comp detail 1 sale within ~0.75 mi
| Address | Dist | Beds/Ba | Sqft | Sold | Price | $/sf | Match |
|---|---|---|---|---|---|---|---|
| 3984 Pancake Hill Rd | 0.32mi | 3/2.0 (-1) | 1,912 (-14%) | 14mo | $209,900 | $110 | 44 |
Match score weights: distance 35% · size 25% · config 20% · recency 20%. Top-matched comps best support the ARV.
Projected returns pro-forma
10.0% appreciation · 3.0% rent growth · sell at horizon
- IRR
- 26.6%
- Equity multiple
- 3.12×
- Total profit
- $115,516
- Equity at exit
- $175,671
- IRR
- 23.3%
- Equity multiple
- 7.10×
- Total profit
- $332,859
- Equity at exit
- $378,842
Cash invested: $54,600 (down + closing). Projections, not guarantees.
Landlord ↔ Tenant lean methodology
- Overall (STATE)
- 15 Strongly Tenant-Friendly
- State New York
- 15 Strongly Tenant-Friendly · D+10
- County
- — inherits STATE
- City
- — inherits STATE
ZIP-level market 14712
- Home prices YoY
- 15.3%
- Active inventory
- 47
- Price-to-rent
- 8.8×
Monthly cashflow live
- Estimated rent
- $1,840 medium interval (Pro) →
- Mortgage (P&I)
- −$1,023
- Tax from tax record
- −$203 /mo · $2,441/yr
- Insurance
- −$81
- HOA
- −$0
- Vacancy / Maint / Mgmt
- −$386
- Net cashflow
- $146
Break-even live
UW: 25.0% down · 7.5% · 30yr · 1.5% tax · 5.0% vac · 8.0% maint · 8.0% mgmt
Financing live
Cash to close
- Down payment
- $48,750
- Closing costs
- $5,850
- Reserves months
- —
- Total cash needed
- —
Loan-product check · same deal, 3 products live
Conventional
25% down · 7.5% · 30yr
- Down + closing
- —
- Monthly P&I
- —
- Monthly cashflow
- —
- DSCR
- —
- Eligible?
- —
Personal DTI + credit; lowest rate.
DSCR
20% down · 8.5% · 30yr
- Down + closing
- —
- Monthly P&I
- —
- Monthly cashflow
- —
- DSCR
- —
- Eligible?
- —
No personal income docs; deal must DSCR.
Hard money
10% down · 12.0% · 12mo
- Down + closing
- —
- Monthly P&I
- —
- Monthly cashflow
- —
- DSCR
- —
- Eligible?
- —
Short-term bridge; refi at stabilization.
Listing history 9 events
-
2026-06-19days on market $195,000 Active 11 DOM
-
2026-06-18days on market $195,000 Active 10 DOM
-
2026-06-17days on market $195,000 Active 9 DOM
-
2026-06-16days on market $195,000 Active 8 DOM
-
2026-06-15days on market $195,000 Active 7 DOM
-
2026-06-14days on market $195,000 Active 5 DOM
-
2026-06-12days on market $195,000 Active 4 DOM
-
2026-06-09remarks 674-char remark
-
2026-06-09$195,000 Active 1 DOM
ⓘ Source: listings_history table (triggers on properties + properties_extension) + one-shot
backfill from property_details.listing_events for pre-trigger history.
Tax reassessment forecast NY · Partial reset (capped growth)
- Current annual tax
- $2,441 · $203/mo
- Projected year-2 tax
- $2,868 · $239/mo
- Expected delta
- +$427/yr (+$36/mo · 17.5%)
ⓘ Screening estimate from a state-policy table — verify with the county assessor before closing.
Climate risk First Street
- Flood 6/10 Major FEMA zone X · 73% chance over 30 yrs
- Wildfire 1/10 Low
- Heat 1/10 Low 7 d/yr ≥91°F today · 17 d/yr by 30 yrs out
- Wind 1/10 Low
- Air quality 2/10 Low 0 unhealthy d/yr today · 1 by 30 yrs out
Nearby sold comps map
Loading sold comps map…
Walkable amenities ~0.75 mi
Loading nearby amenities…
Taxation est. · year 1
- Rental income
- $22,078
- − Mortgage interest
- −$10,923
- − Property taxes
- −$2,441
- − Insurance
- −$975
- − Repairs & maintenance
- −$1,766
- − Management
- −$1,766
- − Depreciation
- −$5,673
- Taxable loss
- −$1,466
- Est. tax savings @ 24.0%
- +$352
- After-tax cash flow
- $2,106/yr
For passive investors: Depreciation is non-cash, so a rental often shows a tax loss while cash-flowing — sheltering income. Rental losses are passive: they offset passive income freely, and up to $25,000/yr can offset ordinary (W-2) income if you actively participate and your MAGI is under $100k (phasing out to $0 by $150k); unused losses carry forward. On sale, claimed depreciation is recaptured at up to 25%, and gains may owe capital-gains tax (a 1031 exchange can defer both). Figures are a year-1 estimate at your 24.0% rate — not tax advice; consult a CPA.
Schools (NCES district)
- District
- Bemus Point Central School District
- NCES district ID
- 3604530
- Math proficiency
- 65% ▼ -4.00%
- Reading proficiency
- 61% ▼ -9.00%
- Median HH income
- $50,968
- Composite
- 55.15/100
- National rank
- #2753
- State rank
- #238 of 755 in NY
Livability — Lakewood
- Score
- 71/100
- State rank
- #398
- US rank
- #6904
Category grades
Schools grade is shown separately in the Schools card above.
Census & demographics
- Population (ZIP)
- 3,079
Population outlook (Chautauqua County) Hauer SSP2
- Today (2025)
- 123,454 people
- By 2030
- 118,509 · -4.0%
- By 2040
- 107,311 · -13.1%
- By 2050
- 96,703 · -21.7%
- By 2075
- 76,757 · -37.8%
- By 2100
- 60,984 · -50.6%
Race, ethnicity, and origin ACS 2023
- Neighborhood character
- Predominantly White (95%)
- Race & ethnicity
- White 95% Two or more races 3% Hispanic / Latino 2%
- Common ancestry
- Iranian 3% Romanian 3% Slovak 3%
- Foreign-born
- 1% · Canada
- Languages at home
- 98% English-only · German/W. Germanic 1% Spanish 1%
Political lean MEDSL · Chautauqua
- 2024 margin
- Strong R (+22.0) · D 39.0% · R 61.0%
- 2008→2024 swing
- -22.9pp toward R · 2008: 0.9pp · 2024: -22.0pp
- All cycles
- 2024: R+22.0 2020: R+19.8 2016: R+24.6 2012: R+8.2 2008: D+0.9
Not yet ingested
- Civics
- —
Market trends
- HPI YoY
- ▲ 48.79%
- Current HPI
- 368.206
- Rent YoY
- —
- Metro
- —
- State GDP YoY
- ▲ 2.60%
- F500 in state
- 92
Industry mix (Fortune 500 HQ in NY)
| Industry | F500 HQs | Revenue |
|---|---|---|
| Financial Services | 10 | $950B |
|
||
| Consumer Goods | 9 | $162B |
|
||
| Insurance | 4 | $225B |
|
||
| Telecommunications | 2 | $144B |
|
||
| Pharmaceuticals | 2 | $112B |
|
||
| Media / Entertainment | 2 | $69B |
|
||
Price history
+154.9% since first listed10 events — show timeline
- 2026-06-08 Listed $195,000 UNYREIS
- 2021-10-12 Sold (Public Records) $115,000 Public Records
- 2021-10-01 Sold (MLS) $115,000 UNYREIS
- 2021-09-08 Pending — UNYREIS
- 2021-07-17 Listed $125,000 UNYREIS
- 2021-07-17 Listing Removed — UNYREIS
- 2021-07-06 Sold (Public Records) $57,921 Public Records
- 2008-12-04 Sold (MLS) $73,000 UNYREIS
- 2008-11-24 Sold (Public Records) $73,000 Public Records
- 2008-01-18 Listed $76,500 UNYREIS
Property tax history
-0.9%/yrLatest (2025): $2,441 · +0.4% YoY. Source: county tax records.
Cash-flow waterfall
monthlySold comps — $/sqft
last 12 mo · ≤1 miLoading sold comps…