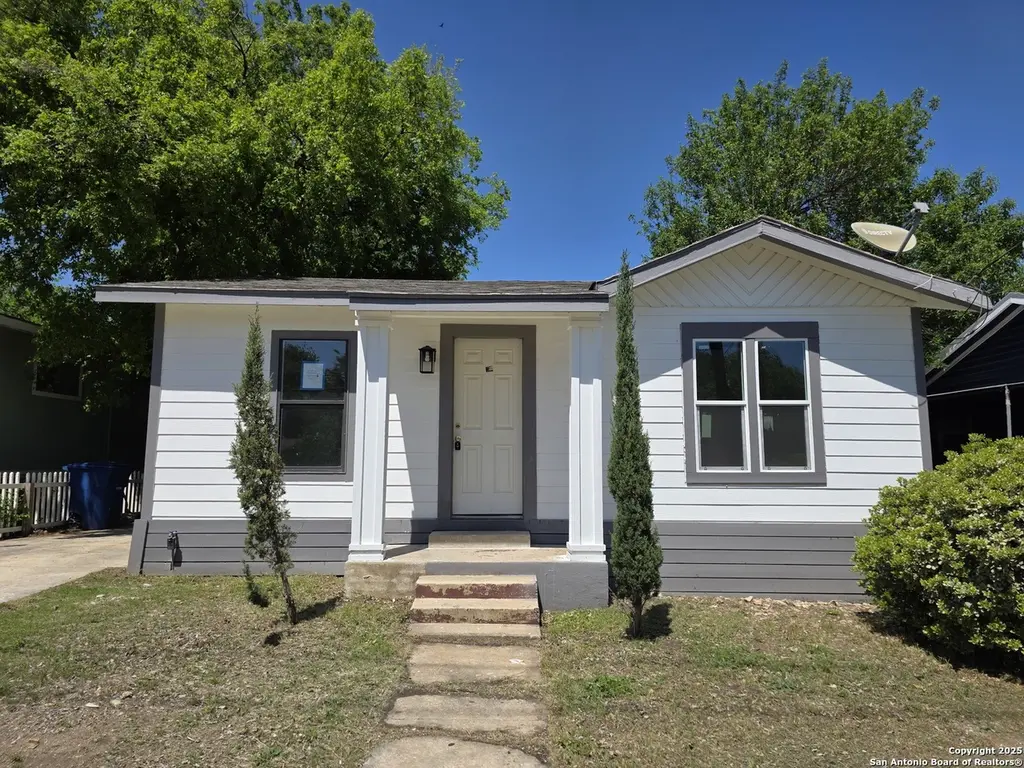
315 Muegge · San Antonio, TX
Flood risk 1/10 · Minimal
- FEMA flood zone
- X (unshaded)
- Chance of flooding over 30 yrs
- 0.0%
- Est. flood insurance / yr
- $507 – $1,088
Fire risk 1/10 · Minimal
- Est. fire insurance / yr
- $1,222 – $2,270
Heat risk 8/10 · Major
- Hot days now (above 108°F)
- 7 days/yr
- Hot days in 30 yrs
- 22 days/yr
Wind risk 8/10 · Major
- Chance of severe wind over 30 yrs
- 80.0%
Air-quality risk 2/10 · Minimal
- Unhealthy air days now
- 0 days/yr
- Unhealthy air days in 30 yrs
- 2 days/yr
Risk factors via First Street. Map © Google.
Why this score? — see what drove the B grade
The composite is a weighted blend of 9 inputs, each scored 0–100. Each bar is that input's sub-score; the figure is the points it added to the 100-point composite (weight × sub-score).
- Cash flow +20.8/30.0
- ARV discount +15.0/15.0
- Appreciation +10.0/10.0
- 1% rule +6.7/10.0
- DSCR +6.6/10.0
- Rent growth +4.5/5.0
- Livability +4.0/5.0
- Condition / age +2.5/5.0
- Schools +1.4/10.0
$119,900
🖨 Deal sheet 📄 Offer letter ✓ Due diligence
Listing remarks MLS
Buyer unable to obtain financing. Look at this incredible opportunity to own a 3- bedroom, 1-bath home just a short drive from downtown. This property offers a fenced front and back yard and covered back patio for outdoor enjoyment. Looking for an investment to expand your portfolio or want sweat equity in a starter home, this is the perfect fit.
Key facts
- Covered back patio
- 5,183 sq ft lot
- Garage
Tags
Neighborhood map
What this means for you Summary
Snapshot
- This is a 3-bed/1.0-bath single-family listed at $120k.
Deal economics
- At list price, monthly cash flow is $164 ($2k/yr) — positive.
- The deal already cash-flows at list — no discount required.
- Meets the 1% rule at list price ($1k rent vs $120k).
- Recommended offer: $106k (12.0% below list) — sets the bar for market timing.
- Cap rate 7.9% vs local median 3.8% in San Antonio — top-decile yield for the area; either an underpriced asset or a hidden risk that comps aren't pricing in. Stress-test before assuming the spread holds.
Location & tenants
- Location reads 80/100 on livability (#31 in TX, #1,616 nationally) — a professional / high-income tenant draw. Strengths: amenities A+, commute A+, cost of living A+; Watch: schools C-, crime F.
- San Antonio ISD (urban): math 12% / reading 22% proficiency, ranked #805 of 826 in TX (top 98%) — low school quality limits family demand, transient renter base, plan for 1-2y turnover; 80% free/reduced lunch — lower-income household profile, screen leases tightly.
- Market conditions: Rents rising fast (+8.2%/yr); 196 active listings in the ZIP; 40 comparable units currently listed for rent nearby; rentals at typical pace (median 24d on market — plan ~3-4 weeks tenant-placement turnaround); 8,308 units permitted in Bexar County in 2024 (2,506 in 5+ unit buildings).
Forward outlook
- In year one you build about $13k of equity ($829 loan paydown + $12k appreciation (10.0% local appreciation)).
- Bexar County population projected at +50% by 2050 — long-run rental-demand tailwind backs the buy-and-hold thesis.
- At projected returns (10.0% appreciation + 8.0% rent growth), your $34k cash investment doubles in ~3 years — after that, you're playing with house money.
- By year 3, paydown + projected appreciation supports a ~$32k cash-out refi (75% LTV) — recoverable capital for the next deal without selling this one.
Negotiation context
- It's been on market 243 days — a 12% lower offer ($106k) is reasonable based on typical stale-listing flexibility.
- 4 sale attempts; this cycle's ask has dropped $15k (11%) from the opening price — seller is motivated, your offer sets the floor, not the list.
- Current owner paid $47k; list at $120k implies a 154% gain — meaningful room to come down on a strong offer.
Risks & watch-outs
- Watch-outs: property tax is 2.6% of price; built in 1956 — expect roof / HVAC / electrical / plumbing capex.
- Climate carrying-cost: severe wind risk, 80% chance of damaging wind over 30y; extreme-heat days projected 7→22/yr by 2055 (HVAC capex compounding) — expect insurance premiums to compound above CPI over the hold.
Questions for the listing agent
- It's been on market 243 days. Have you received any prior offers? Is the seller open to a 12% concession, seller financing, or rate buy-down credit?
- Built in 1956 — when were the roof, HVAC, electrical panel, plumbing, and water heater last replaced?
- Property tax is high relative to price — has the assessment been appealed recently, and will the sale trigger a re-assessment?
- Why hasn't it sold? Are there any deal-killer items the seller is aware of (foundation, flood, title, zoning, code violations)?
- Is there a deadline driving the sale (1031 exchange, divorce, estate, relocation)? That informs how much negotiation room exists.
- Crime grade is F in this area — have there been break-ins, vandalism, or insurance claims at this property in the last 3 years? What carrier currently insures it and at what premium?
- What's the average days-on-market for RENTAL listings here right now (not sales)? A rising rental-DOM trend means longer vacancies and softer asking-rent achievability than the comps imply.
- What's the recent tenant-quality profile in this submarket — average credit score on applications, eviction rate, late-payment / NSF rate, and stable-employment percentage? A property-management company in the area should have these aggregated.
- How much new for-sale + rental construction is in the pipeline within 1–3 miles? Heavy new supply typically softens prices + rents 12–24 months out; constrained supply supports both.
Investment metrics
- 1% rule
- 1.17% ✓
- Cap rate
- 7.93%
- Cash-on-cash
- 5.86%
- DSCR
- 1.26
- GRM
- 7.1
CMA / ARV
- ARV (median comp)
- $155,743
- List price
- $119,900
- Delta
- -23.01%
- Verdict
- UNDERPRICED
- Comps
- 20 within 1.0 mi
Show comp detail 12 sales within ~0.75 mi
| Address | Dist | Beds/Ba | Sqft | Sold | Price | $/sf | Match |
|---|---|---|---|---|---|---|---|
| 2354 Burnet | 0.36mi | 3/1.0 | 1,046 (-1%) | 11mo | $150,000 | $143 | 73 |
| 2118 Burnet | 0.40mi | 3/2.5 | 1,088 (+3%) | 3mo | $130,000 | $119 | 68 |
| 1106 Onslow | 0.44mi | 3/1.0 | 1,080 (+2%) | 12mo | $155,000 | $144 | 65 |
| 2710 E Houston St | 0.60mi | 3/1.0 | 1,017 (-4%) | 2mo | $185,000 | $182 | 64 |
| 2055 E Crockett St | 0.70mi | 3/1.0 | 1,054 (-0%) | 5mo | $120,000 | $114 | 63 |
| 1102 Onslow | 0.45mi | 3/2.0 | 995 (-6%) | 6mo | $119,950 | $121 | 60 |
| 311 Hudson | 0.45mi | 3/2.0 | 1,008 (-4%) | 9mo | $170,000 | $169 | 60 |
| 1901 Nolan | 0.66mi | 3/1.0 | 1,116 (+6%) | 10mo | $160,000 | $143 | 52 |
| 218 Coleman | 0.70mi | 2/1.0 (-1) | 980 (-7%) | 1mo | $200,000 | $204 | 50 |
| 2836 E Houston St | 0.61mi | 2/1.0 (-1) | 945 (-10%) | 13mo | $185,000 | $196 | 38 |
| 1719 Dawson St | 0.75mi | 3/2.0 | 1,210 (+15%) | 4mo | $210,000 | $174 | 33 |
| 632 Canton | 0.73mi | 2/1.0 (-1) | 920 (-13%) | 10mo | $70,000 | $76 | 32 |
Match score weights: distance 35% · size 25% · config 20% · recency 20%. Top-matched comps best support the ARV.
Projected returns pro-forma
10.0% appreciation · 8.0% rent growth · sell at horizon
- IRR
- 30.8%
- Equity multiple
- 3.48×
- Total profit
- $83,235
- Equity at exit
- $108,015
- IRR
- 28.5%
- Equity multiple
- 8.61×
- Total profit
- $255,430
- Equity at exit
- $232,939
Cash invested: $33,572 (down + closing). Projections, not guarantees.
Landlord ↔ Tenant lean methodology
- Overall (STATE)
- 87 Strongly Landlord-Friendly
- State Texas
- 87 Strongly Landlord-Friendly · R+5
- County
- — inherits STATE
- City
- — inherits STATE
ZIP-level market 78202
- Home prices YoY
- 27.0%
- Rents YoY
- 8.2%
- Active inventory
- 196
- Price-to-rent
- 7.1×
Monthly cashflow live
- Estimated rent
- $1,401 high interval (Pro) →
- Mortgage (P&I)
- −$629
- Tax from tax record
- −$264 /mo · $3,171/yr
- Insurance
- −$50
- HOA
- −$0
- Vacancy / Maint / Mgmt
- −$294
- Net cashflow
- $164
Break-even live
UW: 25.0% down · 7.5% · 30yr · 1.5% tax · 5.0% vac · 8.0% maint · 8.0% mgmt
Financing live
Cash to close
- Down payment
- $29,975
- Closing costs
- $3,597
- Reserves months
- —
- Total cash needed
- —
Loan-product check · same deal, 3 products live
Conventional
25% down · 7.5% · 30yr
- Down + closing
- —
- Monthly P&I
- —
- Monthly cashflow
- —
- DSCR
- —
- Eligible?
- —
Personal DTI + credit; lowest rate.
DSCR
20% down · 8.5% · 30yr
- Down + closing
- —
- Monthly P&I
- —
- Monthly cashflow
- —
- DSCR
- —
- Eligible?
- —
No personal income docs; deal must DSCR.
Hard money
10% down · 12.0% · 12mo
- Down + closing
- —
- Monthly P&I
- —
- Monthly cashflow
- —
- DSCR
- —
- Eligible?
- —
Short-term bridge; refi at stabilization.
Rent comps 40 comps
| Address | Beds | Baths | Sqft | Rent | $/sqft | DOM | Units | Dist |
|---|---|---|---|---|---|---|---|---|
| 518 Rotary San Antonio, TX | 3.0 | 1.0 | 1080 | $1,225 | $1.13 | 14d | 1 | 0.18mi |
| 1010 Locke St Unit 710 San Antonio, TX | 2.0 | 2.0 | 950 | $879 | $0.93 | 3d | 1 | 0.22mi |
| 2142 Lamar St San Antonio, TX | 2.0 | 1.0 | 900 | $1,100 | $1.22 | 43d | 1 | 0.26mi |
| 2654 Dignowity Ave Unit 102 San Antonio, TX | 2.0 | 1.5 | 980 | $1,450 | $1.48 | 43d | 1 | 0.29mi |
| 2239 Burnet St San Antonio, TX | 3.0 | 2.0 | 1097 | $1,450 | $1.32 | 43d | 1 | 0.33mi |
| 2006 Hays St San Antonio, TX | 3.0 | 2.0 | 1176 | $1,750 | $1.49 | 20d | 1 | 0.38mi |
| 1223 N Walters St Unit 710 San Antonio, TX | 2.0 | 2.0 | 970 | $1,047 | $1.08 | 3d | 1 | 0.38mi |
| 2118 Burnet St San Antonio, TX | 3.0 | 2.0 | 1008 | $1,650 | $1.64 | 3d | 1 | 0.42mi |
| 932 Poinsettia St San Antonio, TX | 2.0 | 1.0 | 800 | $945 | $1.18 | 43d | 1 | 0.42mi |
| 710 Poinsettia San Antonio, TX | 2.0 | 1.0 | 708 | $1,195 | $1.69 | 43d | 1 | 0.48mi |
| 1650 Gorman San Antonio, TX | 2.0 | 1.0 | 950 | $1,111 | $1.17 | 23d | 1 | 0.49mi |
| 1622 Gorman San Antonio, TX | 3.0 | 2.0 | 1189 | $1,325 | $1.11 | 17d | 1 | 0.50mi |
| 1326 Ervin St San Antonio, TX | 3.0 | 2.0 | 1400 | $1,750 | $1.25 | 3d | 1 | 0.50mi |
| 1510 Gorman San Antonio, TX | 2.0 | 1.0 | 996 | $1,300 | $1.31 | 17d | 1 | 0.52mi |
| 1414 Gorman San Antonio, TX | 2.0 | 1.0 | 900 | $1,175 | $1.31 | 43d | 1 | 0.54mi |
| 906 Gulf St Unit 102 San Antonio, TX | 3.0 | 2.0 | 1300 | $1,750 | $1.35 | 4d | 1 | 0.57mi |
| 323 Gabriel San Antonio, TX | 3.0 | 2.0 | 1400 | $1,950 | $1.39 | 21d | 1 | 0.58mi |
| 323 Gabriel San Antonio, TX | 2.0 | 2.0 | 1000 | $1,375 | $1.38 | 23d | 1 | 0.58mi |
| 323 Gabriel Unit 1 201 San Antonio, TX | 2.0 | 2.5 | 1000 | $1,375 | $1.38 | 43d | 1 | 0.58mi |
| 323 Gabriel Unit 1 101 San Antonio, TX | 3.0 | 2.5 | 1400 | $1,950 | $1.39 | 23d | 1 | 0.58mi |
| 742 Gulf St Unit 746 San Antonio, TX | 2.0 | 1.0 | 744 | $975 | $1.31 | 12d | 1 | 0.59mi |
| 1104 N Gevers St San Antonio, TX | 3.0 | 2.5 | 1276 | $1,725 | $1.35 | 43d | 1 | 0.60mi |
| 746 Gulf San Antonio, TX | 2.0 | 1.0 | 744 | $975 | $1.31 | 14d | 1 | 0.60mi |
| 2818 E Houston St San Antonio, TX | 3.0 | 1.0 | 1184 | $1,495 | $1.26 | 14d | 1 | 0.63mi |
| 418 Lockhart San Antonio, TX | 4.0 | 2.0 | 1479 | $1,799 | $1.22 | 21d | 1 | 0.64mi |
| 418 Lockhart St Unit 1 San Antonio, TX | 4.0 | 2.0 | 1479 | $1,590 | $1.08 | 43d | 1 | 0.64mi |
| 607 Gulf San Antonio, TX | 3.0 | 2.0 | 1482 | $1,395 | $0.94 | 23d | 1 | 0.66mi |
| 1411 Lamar St San Antonio, TX | 2.0 | 1.0 | 700 | $1,125 | $1.61 | 43d | 1 | 0.69mi |
| 508 Bee St San Antonio, TX | 3.0 | 1.0 | 828 | $995 | $1.20 | 17d | 1 | 0.70mi |
| 508 Bee St Unit 508-b San Antonio, TX | 3.0 | 1.0 | 828 | $995 | $1.20 | 43d | 1 | 0.70mi |
| 601 Coleman St Unit 2 San Antonio, TX | 2.0 | 1.0 | 800 | $950 | $1.19 | 43d | 1 | 0.72mi |
| 639 Canton San Antonio, TX | 2.0 | 1.0 | 1008 | $1,295 | $1.28 | 43d | 1 | 0.72mi |
| 706 Canton San Antonio, TX | 2.0 | 1.0 | 994 | $1,545 | $1.55 | 23d | 1 | 0.73mi |
| 1323 Lamar St #1 San Antonio, TX | 2.0 | 1.0 | 900 | $999 | $1.11 | 43d | 1 | 0.75mi |
| 452 Gulf San Antonio, TX | 3.0 | 1.0 | 1244 | $1,899 | $1.53 | 21d | 1 | 0.79mi |
| 634 Hood St San Antonio, TX | 2.0 | 1.0 | 762 | $1,100 | $1.44 | 43d | 1 | 0.79mi |
| 1412 Hays St San Antonio, TX | 3.0 | 1.0 | 1250 | $1,495 | $1.20 | 23d | 1 | 0.80mi |
| 438 Gulf St San Antonio, TX | 2.0 | 1.0 | 799 | $975 | $1.22 | 14d | 1 | 0.81mi |
| 1435 Gibbs San Antonio, TX | 3.0 | 1.0 | 975 | $1,435 | $1.47 | 23d | 1 | 0.85mi |
| 1615 Nolan St Unit A San Antonio, TX | 2.0 | 1.0 | 1066 | $1,400 | $1.31 | 10d | 1 | 0.88mi |
Listing history 33 events
-
2026-06-18days on market $119,900 Active 243 DOM
-
2026-06-17days on market $119,900 Active 242 DOM
-
2026-06-16days on market $119,900 Active 241 DOM
-
2026-06-15days on market $119,900 Active 240 DOM
-
2026-06-13days on market $119,900 Active 238 DOM
-
2026-06-09days on market $119,900 Active 234 DOM
-
2026-06-08statusdays on market $119,900 Active 233 DOM
-
2026-06-07days on market $119,900 Price Change 232 DOM
-
2026-06-04days on market $119,900 Price Change 229 DOM
-
2026-06-03days on market $119,900 Price Change 228 DOM
-
2026-06-02days on market $119,900 Price Change 227 DOM
-
2026-06-01days on market $119,900 Price Change 226 DOM
-
2026-05-31days on market $119,900 Price Change 225 DOM
-
2026-04-28status Back on Market 350-char remark
Show marketing remark (350 chars)
Buyer unable to obtain financing. Look at this incredible opportunity to own a 3- bedroom, 1-bath home just a short drive from downtown. This property offers a fenced front and back yard and covered back patio for outdoor enjoyment. Looking for an investment to expand your portfolio or want sweat equity in a starter home, this is the perfect fit.
-
2026-03-26historical Active Option 350-char remark
Show marketing remark (350 chars)
Buyer unable to obtain financing. Look at this incredible opportunity to own a 3- bedroom, 1-bath home just a short drive from downtown. This property offers a fenced front and back yard and covered back patio for outdoor enjoyment. Looking for an investment to expand your portfolio or want sweat equity in a starter home, this is the perfect fit.
-
2025-10-18$134,900 New 350-char remark
Show marketing remark (350 chars)
Buyer unable to obtain financing. Look at this incredible opportunity to own a 3- bedroom, 1-bath home just a short drive from downtown. This property offers a fenced front and back yard and covered back patio for outdoor enjoyment. Looking for an investment to expand your portfolio or want sweat equity in a starter home, this is the perfect fit.
-
2025-10-07historical
-
2025-08-29status Back on Market
-
2025-08-19status Pending
-
2025-07-15historical Active Option
-
2025-05-28price $134,900
-
2025-04-09$139,900 New
-
2023-04-27soldstatus
-
2023-04-27soldstatus
-
2014-04-30soldstatus
-
2008-02-25soldstatus
-
2006-03-23soldstatus
-
2006-03-08soldstatus
-
2002-08-19soldstatus
-
2002-08-14soldstatus
-
2002-04-08soldstatus
-
1997-10-27soldstatus $47,215
-
1997-09-25soldstatus
ⓘ Source: listings_history table (triggers on properties + properties_extension) + one-shot
backfill from property_details.listing_events for pre-trigger history.
Tax reassessment forecast TX · Resets to sale price
- Current annual tax
- $3,171 · $264/mo
- Projected year-2 tax
- $3,171 · $264/mo
- Expected delta
- $0/yr ($0/mo · 0.0%)
ⓘ Screening estimate from a state-policy table — verify with the county assessor before closing.
Climate risk First Street
- Flood 1/10 Low FEMA zone X (unshaded) · 0% chance over 30 yrs
- Wildfire 1/10 Low
- Heat 8/10 Severe 7 d/yr ≥108°F today · 22 d/yr by 30 yrs out
- Wind 8/10 Severe 80% chance of damaging wind over 30 yrs
- Air quality 2/10 Low 0 unhealthy d/yr today · 2 by 30 yrs out
Nearby sold comps map
Loading sold comps map…
Walkable amenities ~0.75 mi
Loading nearby amenities…
Taxation est. · year 1
- Rental income
- $16,813
- − Mortgage interest
- −$6,716
- − Property taxes
- −$3,171
- − Insurance
- −$600
- − Repairs & maintenance
- −$1,345
- − Management
- −$1,345
- − Depreciation
- −$3,488
- Taxable income
- $148
- Est. tax owed @ 24.0%
- −$36
- After-tax cash flow
- $1,931/yr
For passive investors: Depreciation is non-cash, so a rental often shows a tax loss while cash-flowing — sheltering income. Rental losses are passive: they offset passive income freely, and up to $25,000/yr can offset ordinary (W-2) income if you actively participate and your MAGI is under $100k (phasing out to $0 by $150k); unused losses carry forward. On sale, claimed depreciation is recaptured at up to 25%, and gains may owe capital-gains tax (a 1031 exchange can defer both). Figures are a year-1 estimate at your 24.0% rate — not tax advice; consult a CPA.
Schools (NCES district)
- District
- San Antonio ISD
- NCES district ID
- 4838730
- Math proficiency
- 12% ▼ -21.00%
- Reading proficiency
- 22% ▼ -7.00%
- Median HH income
- $30,952
- Composite
- 13.57/100
- National rank
- #9512
- State rank
- #805 of 826 in TX
Livability — San Antonio
- Score
- 80/100
- State rank
- #31
- US rank
- #1616
Category grades
Schools grade is shown separately in the Schools card above.
Census & demographics
- Census place
- San Antonio, TX
- County
- Bexar County · 1,990,555 people
- City population
- 1,806,925
- Metro
- San Antonio-New Braunfels, TX
- Population (ZIP)
- 10,224
- Household income
- $47,478
- Rent vs Own
- Severe rent burden
- 543.0
Population outlook (Bexar County) Hauer SSP2
- Today (2025)
- 2,336,851 people
- By 2030
- 2,560,728 · +9.6%
- By 2040
- 3,020,569 · +29.3%
- By 2050
- 3,493,522 · +49.5%
- By 2075
- 4,668,459 · +99.8%
- By 2100
- 5,533,242 · +136.8%
Race, ethnicity, and origin ACS 2023
- Neighborhood character
- Predominantly Hispanic (66%)
- Race & ethnicity
- Hispanic / Latino 66% Two or more races 28% White 17% Black 16% Native American 1%
- Hispanic origin (detail)
- Mexican 57% Puerto Rican 1% Cuban 1%
- Common ancestry
- Italian 2% Slovak 1%
- Foreign-born
- 14% · Canada
- Languages at home
- 59% English-only · Spanish 41%
Political lean MEDSL · Bexar
- 2024 margin
- Lean D (+9.8) · D 54.3% · R 44.6% · Other 1.1%
- 2008→2024 swing
- +4.2pp toward D · 2008: 5.6pp · 2024: 9.8pp
- All cycles
- 2024: D+9.8 2020: D+18.2 2016: D+13.5 2012: D+4.6 2008: D+5.6
Not yet ingested
- Civics
- —
Market trends
- HPI YoY
- ▲ 53.82%
- Current HPI
- 253.3196
- Rent YoY
- ▲ 8.20%
- Metro
- San Antonio-New Braunfels, TX
- State GDP YoY
- ▲ 3.95%
- F500 in state
- 110
Industry mix (Fortune 500 HQ in TX)
| Industry | F500 HQs | Revenue |
|---|---|---|
| Energy | 16 | $1,198B |
|
||
| Technology | 5 | $198B |
|
||
| Engineering / Construction | 4 | $72B |
|
||
| Energy Services | 3 | $60B |
|
||
| Utilities | 3 | $41B |
|
||
| Healthcare | 2 | $330B |
|
||
Price history
+185.7% since first listed20 events — show timeline
- 2026-04-28 Relisted — LERA
- 2026-03-26 Contingent — LERA
- 2025-10-18 Listed $134,900 LERA
- 2025-10-07 Listing Removed — LERA
- 2025-08-29 Relisted — LERA
- 2025-08-19 Pending — LERA
- 2025-07-15 Contingent — LERA
- 2025-05-28 Price Changed $134,900 LERA
- 2025-04-09 Listed $139,900 LERA
- 2023-04-27 Sold (Public Records) — Public Records
- 2023-04-27 Sold (Public Records) — Public Records
- 2014-04-30 Sold (Public Records) — Public Records
- 2008-02-25 Sold (Public Records) — Public Records
- 2006-03-23 Sold (Public Records) — Public Records
- 2006-03-08 Sold (Public Records) — Public Records
- 2002-08-19 Sold (Public Records) — Public Records
- 2002-08-14 Sold (Public Records) — Public Records
- 2002-04-08 Sold (Public Records) — Public Records
- 1997-10-27 Sold (Public Records) $47,215 Public Records
- 1997-09-25 Sold (Public Records) — Public Records
Property tax history
+8.3%/yrLatest (2025): $3,171 · -2.6% YoY. Source: county tax records.
Cash-flow waterfall
monthlySold comps — $/sqft
last 12 mo · ≤1 miLoading sold comps…