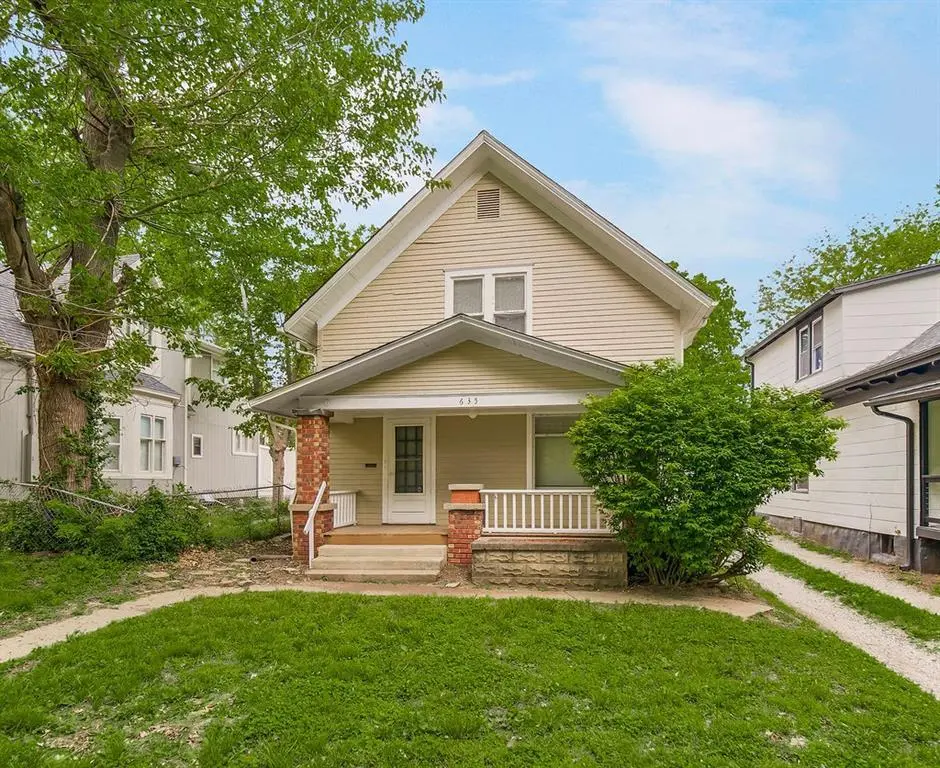
635 S Fuller Ave · Independence, MO
Flood risk 1/10 · Minimal
- FEMA flood zone
- X (unshaded)
- Chance of flooding over 30 yrs
- 0.0%
- Est. flood insurance / yr
- $473 – $860
Fire risk 1/10 · Minimal
- Est. fire insurance / yr
- $1,054 – $1,958
Heat risk 4/10 · Minor
- Hot days now (above 106°F)
- 7 days/yr
- Hot days in 30 yrs
- 17 days/yr
Wind risk 2/10 · Minimal
- Chance of severe wind over 30 yrs
- —
Air-quality risk 3/10 · Minor
- Unhealthy air days now
- 3 days/yr
- Unhealthy air days in 30 yrs
- 3 days/yr
Risk factors via First Street. Map © Google.
Why this score? — see what drove the D grade
The composite is a weighted blend of 9 inputs, each scored 0–100. Each bar is that input's sub-score; the figure is the points it added to the 100-point composite (weight × sub-score).
- ARV discount +15.0/15.0
- Cash flow +9.2/30.0
- Livability +4.1/5.0
- Rent growth +3.9/5.0
- Schools +2.7/10.0
- DSCR +2.6/10.0
- Condition / age +2.5/5.0
- 1% rule +1.8/10.0
- Appreciation +0.0/10.0
$180,000
🖨 Deal sheet 📄 Offer letter ✓ Due diligence
Listing remarks MLS
Step inside the door of this two story home and be amazed at the original wood trim, staircase and columns. Original pocket doors separating rooms on the main level. Kitchen features tile floors. Furnace & ac have been updated at some point in time. Charming updated bath. Sun porch upstairs off of a bedroom. Turn of the century style front porch-huge bedrooms. Children can walk to school (Procter Elementary)! This is a HUD acquired home sold as is case# 291-377071 “To submit offers visit HUD Home Store”
Key facts
- Sun porch
- Front porch
- Original woodwork
Tags
Property features AI
Finance
- HOA & community: No association fees
Exterior
- Parking: Off-street parking
- Security: Smoke detector(s)
- Utilities: Public water; Public sewer
- Home design: Single family residence; Residential property; 2 stories; Approximately 2,291 total living area (agent provided); Below-grade finished area present
- Construction: Wood siding; Composition roof
- Exterior features: Patio; Porch; Level lot
Interior
- Kitchen: Eat-in kitchen; Pantry; Ceramic tile in kitchen; Ceiling fan in kitchen
- Bedrooms: 3 bedrooms (all on the second floor)
- Flooring: Carpet; Wood; Ceramic tile (in kitchen)
- Bathrooms: 1 full bath; 1 half bath
- Heating & cooling: Forced air heating; Electric cooling
- Interior features: Ceiling fans; Pantry; Storm windows; Storm doors; Sun room; Eat-in kitchen and formal dining area; Has basement with a basement bedroom; Wood burning stove in dining room; Smoke detector(s)
- Laundry & utility: Laundry located on the upper/bedroom level
Neighborhood map
What this means for you Summary
Snapshot
- This is a 3-bed/1.0-bath single-family listed at $180k.
Deal economics
- At list price, monthly cash flow is $-137 ($-2k/yr) — negative.
- To cash-flow at today's rent, offer at most $156k (13.4% below list).
- To meet the 1% rule (rent ≥ 1% of price), the offer needs to be $123k (31.6% below list).
- Recommended offer: $123k (31.6% below list) — sets the bar for 1% rule.
Location & tenants
- Location reads 82/100 on livability (#10 in MO, #1,296 nationally) — a professional / high-income tenant draw. Strengths: amenities A+, commute A+, cost of living A+; Watch: employment D+, crime F.
- Independence 30 (suburban): math 26% / reading 38% proficiency, ranked #252 of 324 in MO (top 78%) — families likely to look elsewhere, expect single-tenant / working-renter base with shorter leases.
- Zoned schools: Procter Elem. (math 32% / reading 37%, grade F, #676 of 1,115 statewide, top 66%, 208 students, 82% FRL); William Chrisman High (math 21% / reading 45%, grade F, #351 of 521 statewide, top 68%, 1,406 students, 66% FRL) — zoned schools average 74% FRL vs 58% district-wide (15 pts higher); higher-poverty schools than district average — tighter screening recommended.
- Market conditions: Rents rising fast (+5.4%/yr); 127 active listings in the ZIP; 27 comparable units currently listed for rent nearby; rentals at typical pace (median 21d on market — plan ~3-4 weeks tenant-placement turnaround); 41% of comp listings sitting > 30 days — soft ceiling on asking rent; 4,002 units permitted in Jackson County in 2024 (2,271 in 5+ unit buildings).
Forward outlook
- Local home prices are declining (-3.0%/yr); year-one equity from $1k of loan paydown is wiped out by about $5k of value loss. Plan a longer hold.
- Jackson County population projected at +4% by 2050 — modest demand growth; plan on rents tracking national, not racing it.
Negotiation context
- Only 10 days on market — expect competitive offers; lowballing is unlikely to land.
- 3 sale attempts since 18y ago; this cycle's ask has dropped $10k (5%) from the opening price — seller is motivated, your offer sets the floor, not the list.
Risks & watch-outs
- Watch-outs: built in 1926 — expect roof / HVAC / electrical / plumbing capex.
Questions for the listing agent
- What do current leases actually rent for vs. the listed asking? Can we see a recent rent roll and the last 12 months of T-12 income?
- Built in 1926 — when were the roof, HVAC, electrical panel, plumbing, and water heater last replaced?
- Is there a deadline driving the sale (1031 exchange, divorce, estate, relocation)? That informs how much negotiation room exists.
- Crime grade is F in this area — have there been break-ins, vandalism, or insurance claims at this property in the last 3 years? What carrier currently insures it and at what premium?
- The area grade is low — what's the realistic commute time and amenity access for the typical tenant pool here? Any planned neighborhood developments (good or bad) we should know about?
- What's the average days-on-market for RENTAL listings here right now (not sales)? A rising rental-DOM trend means longer vacancies and softer asking-rent achievability than the comps imply.
- What's the recent tenant-quality profile in this submarket — average credit score on applications, eviction rate, late-payment / NSF rate, and stable-employment percentage? A property-management company in the area should have these aggregated.
- How much new for-sale + rental construction is in the pipeline within 1–3 miles? Heavy new supply typically softens prices + rents 12–24 months out; constrained supply supports both.
Investment metrics
- 1% rule
- 0.68% ✗
- Cap rate
- 5.38%
- Cash-on-cash
- -3.25%
- DSCR
- 0.86
- GRM
- 12.2
CMA / ARV
- ARV (median comp)
- $247,645
- List price
- $180,000
- Delta
- -27.32%
- Verdict
- UNDERPRICED
- Comps
- 20 within 1.0 mi
Show comp detail 12 sales within ~0.75 mi
| Address | Dist | Beds/Ba | Sqft | Sold | Price | $/sf | Match |
|---|---|---|---|---|---|---|---|
| 811 S Marion Ave | 0.19mi | 3/2.0 | 1,313 (-2%) | 1mo | $235,000 | $179 | 84 |
| 810 S Woodland Ave | 0.16mi | 3/2.0 | 1,300 (-3%) | 1mo | $125,000 | $96 | 83 |
| 1500 W Lexington Ave | 0.11mi | 3/2.0 | 1,276 (-4%) | 2mo | $239,000 | $187 | 82 |
| 1200 W Linden Ave | 0.18mi | 3/1.0 | 1,300 (-3%) | 9mo | $155,000 | $119 | 80 |
| 1613 S Norwood Ave | 0.41mi | 2/1.0 (-1) | 1,363 (+2%) | 1mo | $160,000 | $117 | 72 |
| 1510 S Vermont Ave | 0.58mi | 3/2.0 | 1,237 (-7%) | 1mo | $215,000 | $174 | 55 |
| 2320 S Vermont Ave | 0.70mi | 3/2.0 | 1,260 (-6%) | 1mo | $220,000 | $175 | 53 |
| 1835 S Claremont Ave | 0.57mi | 3/3.0 | 1,400 (+5%) | 9mo | $155,000 | $111 | 50 |
| 1403 W Bryson St | 0.71mi | 3/2.5 | 1,284 (-4%) | 9mo | $225,000 | $175 | 47 |
| 836 W Charles St | 0.74mi | 4/2.0 (+1) | 1,400 (+5%) | 2mo | $179,000 | $128 | 47 |
| 611 W 23rd St | 0.67mi | 2/1.0 (-1) | 1,520 (+14%) | 2mo | $144,900 | $95 | 39 |
| 1311 W Bryson St | 0.70mi | 4/2.0 (+1) | 1,532 (+15%) | 9mo | $209,999 | $137 | 27 |
Match score weights: distance 35% · size 25% · config 20% · recency 20%. Top-matched comps best support the ARV.
Projected returns pro-forma
-3.0% appreciation · 5.43% rent growth · sell at horizon
- IRR
- -19.4%
- Equity multiple
- 0.31×
- Total profit
- $-34,854
- Equity at exit
- $26,839
- IRR
- -8.3%
- Equity multiple
- 0.43×
- Total profit
- $-28,529
- Equity at exit
- $15,563
Cash invested: $50,400 (down + closing). Projections, not guarantees.
Landlord ↔ Tenant lean methodology
- Overall (STATE)
- 81 Strongly Landlord-Friendly
- State Missouri
- 81 Strongly Landlord-Friendly · R+10
- County
- — inherits STATE
- City
- — inherits STATE
ZIP-level market 64052
- Home prices YoY
- -34.6%
- Rents YoY
- 5.4%
- Active inventory
- 127
- Price-to-rent
- 12.2×
Monthly cashflow live
- Estimated rent
- $1,230 high interval (Pro) →
- Mortgage (P&I)
- −$944
- Tax from tax record
- −$90 /mo · $1,077/yr
- Insurance
- −$75
- HOA
- −$0
- Vacancy / Maint / Mgmt
- −$258
- Net cashflow
- $-137
Break-even live
UW: 25.0% down · 7.5% · 30yr · 1.5% tax · 5.0% vac · 8.0% maint · 8.0% mgmt
Financing live
Cash to close
- Down payment
- $45,000
- Closing costs
- $5,400
- Reserves months
- —
- Total cash needed
- —
Loan-product check · same deal, 3 products live
Conventional
25% down · 7.5% · 30yr
- Down + closing
- —
- Monthly P&I
- —
- Monthly cashflow
- —
- DSCR
- —
- Eligible?
- —
Personal DTI + credit; lowest rate.
DSCR
20% down · 8.5% · 30yr
- Down + closing
- —
- Monthly P&I
- —
- Monthly cashflow
- —
- DSCR
- —
- Eligible?
- —
No personal income docs; deal must DSCR.
Hard money
10% down · 12.0% · 12mo
- Down + closing
- —
- Monthly P&I
- —
- Monthly cashflow
- —
- DSCR
- —
- Eligible?
- —
Short-term bridge; refi at stabilization.
Rent comps 27 comps
| Address | Beds | Baths | Sqft | Rent | $/sqft | DOM | Units | Dist |
|---|---|---|---|---|---|---|---|---|
| 523 S Crysler Ave Unit A Independence, MO | 2.0 | 1.0 | 900 | $650 | $0.72 | 23d | 1 | 0.10mi |
| 724 S Grand Ave Independence, MO | 2.0 | 2.0 | 1000 | $1,149 | $1.15 | 43d | 1 | 0.25mi |
| 11709 E Winner Rd Independence, MO | 3.0 | 1.5 | 1300 | $1,195 | $0.92 | 16d | 1 | 0.25mi |
| 11616 E 16th St S Independence, MO | 2.0 | 1.0 | 1016 | $1,125 | $1.11 | 43d | 1 | 0.39mi |
| 1810 S Vermont Ave Independence, MO | 2.0 | 1.0 | 950 | $948 | $1.00 | 43d | 1 | 0.52mi |
| 11418 E 13th St S Independence, MO | 2.0 | 1.0 | 1760 | $1,100 | $0.62 | 43d | 1 | 0.62mi |
| 523 W Maple Ave Unit 2 A Independence, MO | 3.0 | 2.0 | 964 | $995 | $1.03 | 43d | 1 | 0.74mi |
| 2110 S Sterling Ave Independence, MO | 3.0 | 2.0 | 1722 | $1,849 | $1.07 | 16d | 1 | 0.76mi |
| 321 W South Ave Unit 8 Independence, MO | 2.0 | 1.5 | 980 | $1,895 | $1.93 | 1d | 1 | 0.77mi |
| 321 W South Ave Unit 11 Independence, MO | 3.0 | 2.0 | 1000 | $1,275 | $1.27 | 21d | 1 | 0.77mi |
| 321 W South Ave Unit 9 Independence, MO | 2.0 | 1.5 | 980 | $1,295 | $1.32 | 43d | 1 | 0.77mi |
| 2256 S Sterling Ave Independence, MO | 3.0 | 1.5 | 1284 | $1,399 | $1.09 | 16d | 1 | 0.80mi |
| 10817 E 19th Ter S Independence, MO | 3.0 | 1.0 | 1428 | $1,801 | $1.26 | 16d | 1 | 0.89mi |
| 1502 S Pleasant St Independence, MO | 3.0 | 2.0 | 1200 | $1,399 | $1.17 | 43d | 1 | 0.97mi |
| 10714 E 19th St S Independence, MO | 2.0 | 1.0 | 1010 | $895 | $0.89 | 2d | 1 | 1.00mi |
| 1404 S Osage St Independence, MO | 4.0 | 2.0 | 1300 | $1,750 | $1.35 | 14d | 1 | 1.01mi |
| 1425 S Northern Blvd Independence, MO | 3.0 | 1.5 | 1275 | $1,200 | $0.94 | 7d | 1 | 1.01mi |
| 11601 E US Highway 24 Apt DA Independence, MO | 2.0 | 1.0 | 900 | $1,400 | $1.56 | 43d | 1 | 1.15mi |
| 1109 S Appleton Ave Independence, MO | 3.0 | 2.0 | 1200 | $1,195 | $1.00 | 16d | 1 | 1.19mi |
| 10323 E 20th St S Independence, MO | 3.0 | 1.0 | 936 | $1,400 | $1.50 | 43d | 1 | 1.24mi |
| 10604 E 26th St S Independence, MO | 3.0 | 1.0 | 1068 | $1,610 | $1.51 | 7d | 1 | 1.30mi |
| 10522 E 10th St S Independence, MO | 2.0 | 1.0 | 1020 | $1,099 | $1.08 | 23d | 1 | 1.33mi |
| 11323 E Thompson St Sugar Creek, MO | 3.0 | 2.5 | 1794 | $1,800 | $1.00 | 12d | 1 | 1.36mi |
| 1214 N Union St Independence, MO | 2.0 | 1.0 | 912 | $975 | $1.07 | 43d | 1 | 1.37mi |
| 182 Novak St Sugar Creek, MO | 3.0 | 2.0 | 1350 | $1,800 | $1.33 | 17d | 1 | 1.40mi |
| 1207 N McCoy St Independence, MO | 3.0 | 2.0 | 972 | $1,295 | $1.33 | 7d | 1 | 1.42mi |
| 2920 S Harvard Ave Unit A Independence, MO | 4.0 | 2.5 | 1200 | $1,650 | $1.38 | 43d | 1 | 1.44mi |
Listing history 9 events
-
2026-05-11status Pending 592-char remark
-
2026-05-08price $180,000 592-char remark
-
2026-05-01$190,000 Active 592-char remark
-
2015-06-12soldstatus 526-char remark
Show marketing remark (526 chars)
Step inside the door of this two story home and be amazed at the original wood trim, staircase and columns. Original pocket doors separating rooms on the main level. Kitchen features tile floors. Furnace & ac have been updated at some point in time. Charming updated bath. Sun porch upstairs off of a bedroom. Turn of the century style front porch-huge bedrooms. Children can walk to school (Procter Elementary)! This is a HUD acquired home sold as is case# 291-377071 “To submit offers visit HUD Home Store”
-
2015-02-20$53,700 526-char remark
Show marketing remark (526 chars)
Step inside the door of this two story home and be amazed at the original wood trim, staircase and columns. Original pocket doors separating rooms on the main level. Kitchen features tile floors. Furnace & ac have been updated at some point in time. Charming updated bath. Sun porch upstairs off of a bedroom. Turn of the century style front porch-huge bedrooms. Children can walk to school (Procter Elementary)! This is a HUD acquired home sold as is case# 291-377071 “To submit offers visit HUD Home Store”
-
2008-08-11soldstatus
-
2008-08-07soldstatus
Show marketing remark (315 chars)
Fantastic buy for this one!Original pocket doors beautiful trim. Wonderful kit with tile floors. Furnace & ac updated in 05-06.Charming updated bth. Really nice sunporch upstairs. Lovely front porch-huge bdrms. Listed 6-7-08 price reduced. Walk to school (Procter Elementry)! Better hurry at this new price!!!
-
2008-06-07$89,500
Show marketing remark (315 chars)
Fantastic buy for this one!Original pocket doors beautiful trim. Wonderful kit with tile floors. Furnace & ac updated in 05-06.Charming updated bth. Really nice sunporch upstairs. Lovely front porch-huge bdrms. Listed 6-7-08 price reduced. Walk to school (Procter Elementry)! Better hurry at this new price!!!
-
1994-06-10soldstatus
ⓘ Source: listings_history table (triggers on properties + properties_extension) + one-shot
backfill from property_details.listing_events for pre-trigger history.
Tax reassessment forecast MO · Resets to sale price
- Current annual tax
- $1,077 · $90/mo
- Projected year-2 tax
- $1,746 · $146/mo
- Expected delta
- +$669/yr (+$56/mo · 62.1%)
ⓘ Screening estimate from a state-policy table — verify with the county assessor before closing.
Climate risk First Street
- Flood 1/10 Low FEMA zone X (unshaded) · 0% chance over 30 yrs
- Wildfire 1/10 Low
- Heat 4/10 Moderate 7 d/yr ≥106°F today · 17 d/yr by 30 yrs out
- Wind 2/10 Low
- Air quality 3/10 Moderate 3 unhealthy d/yr today · 3 by 30 yrs out
Nearby sold comps map
Loading sold comps map…
Walkable amenities ~0.75 mi
Loading nearby amenities…
Taxation est. · year 1
- Rental income
- $14,766
- − Mortgage interest
- −$10,083
- − Property taxes
- −$1,077
- − Insurance
- −$900
- − Repairs & maintenance
- −$1,181
- − Management
- −$1,181
- − Depreciation
- −$5,236
- Taxable loss
- −$4,893
- Est. tax savings @ 24.0%
- +$1,174
- After-tax cash flow
- $-465/yr
For passive investors: Depreciation is non-cash, so a rental often shows a tax loss while cash-flowing — sheltering income. Rental losses are passive: they offset passive income freely, and up to $25,000/yr can offset ordinary (W-2) income if you actively participate and your MAGI is under $100k (phasing out to $0 by $150k); unused losses carry forward. On sale, claimed depreciation is recaptured at up to 25%, and gains may owe capital-gains tax (a 1031 exchange can defer both). Figures are a year-1 estimate at your 24.0% rate — not tax advice; consult a CPA.
Schools (NCES district)
- District
- Independence 30
- NCES district ID
- 2915480
- Math proficiency
- 26% ▼ -8.00%
- Reading proficiency
- 38% ▼ -5.00%
- Median HH income
- $41,843
- Composite
- 27.04/100
- National rank
- #7054
- State rank
- #252 of 324 in MO
Livability — Independence
- Score
- 82/100
- State rank
- #10
- US rank
- #1296
Category grades
Schools grade is shown separately in the Schools card above.
Census & demographics
- Census place
- Independence, MO
- County
- Jackson County · 687,798 people
- City population
- 117,675
- Metro
- Kansas City, MO-KS
- Population (ZIP)
- 22,138
- Household income
- $59,007
- Rent vs Own
- Severe rent burden
- 965.0
Population outlook (Jackson County) Hauer SSP2
- Today (2025)
- 719,589 people
- By 2030
- 731,456 · +1.6%
- By 2040
- 746,689 · +3.8%
- By 2050
- 749,289 · +4.1%
- By 2075
- 736,227 · +2.3%
- By 2100
- 668,210 · -7.1%
Race, ethnicity, and origin ACS 2023
- Neighborhood character
- Diverse neighborhood (Simpson 0.56)
- Race & ethnicity
- White 62% Hispanic / Latino 23% Two or more races 15% Black 7% Asian 2%
- Hispanic origin (detail)
- Mexican 15%
- Common ancestry
- Italian 12% Slovak 2% Lithuanian 2%
- Foreign-born
- 11% · Canada, China
- Languages at home
- 85% English-only · Spanish 13% Other Asian/Pacific 1%
Political lean MEDSL · Jackson
- 2024 margin
- D (+19.3) · D 58.9% · R 39.5% · Other 1.6%
- 2008→2024 swing
- -6.1pp toward R · 2008: 25.4pp · 2024: 19.3pp
- All cycles
- 2024: D+19.3 2020: D+22.0 2016: D+16.6 2012: D+19.0 2008: D+25.4
Not yet ingested
- Civics
- —
Market trends
- HPI YoY
- ▼ -160.06%
- Current HPI
- 302.1124
- Rent YoY
- ▲ 5.43%
- Metro
- Kansas City, MO-KS
- State GDP YoY
- ▲ 1.84%
- F500 in state
- 20
Industry mix (Fortune 500 HQ in MO)
| Industry | F500 HQs | Revenue |
|---|---|---|
| Healthcare | 1 | $163B |
|
||
| Insurance | 1 | $21B |
|
||
| Industrial Technology | 1 | $17B |
|
||
| Retail | 1 | $16B |
|
||
| Industrial Distribution | 1 | $10B |
|
||
| Utilities | 1 | $9B |
|
||
Price history
+101.1% since first listed9 events — show timeline
- 2026-05-11 Pending — Heartland MLS as Distributed by MLS Grid
- 2026-05-08 Price Changed $180,000 Heartland MLS as Distributed by MLS Grid
- 2026-05-01 Listed $190,000 Heartland MLS as Distributed by MLS Grid
- 2015-06-12 Sold (MLS) — Heartland MLS as Distributed by MLS Grid
- 2015-02-20 Listed $53,700 Heartland MLS as Distributed by MLS Grid
- 2008-08-11 Sold (Public Records) — Public Records
- 2008-08-07 Sold (MLS) — Heartland MLS as Distributed by MLS Grid
- 2008-06-07 Listed $89,500 Heartland MLS as Distributed by MLS Grid
- 1994-06-10 Sold (Public Records) — Public Records
Property tax history
+1.0%/yrLatest (2025): $1,077 · +3.0% YoY. Source: county tax records.
Cash-flow waterfall
monthlySold comps — $/sqft
last 12 mo · ≤1 miLoading sold comps…