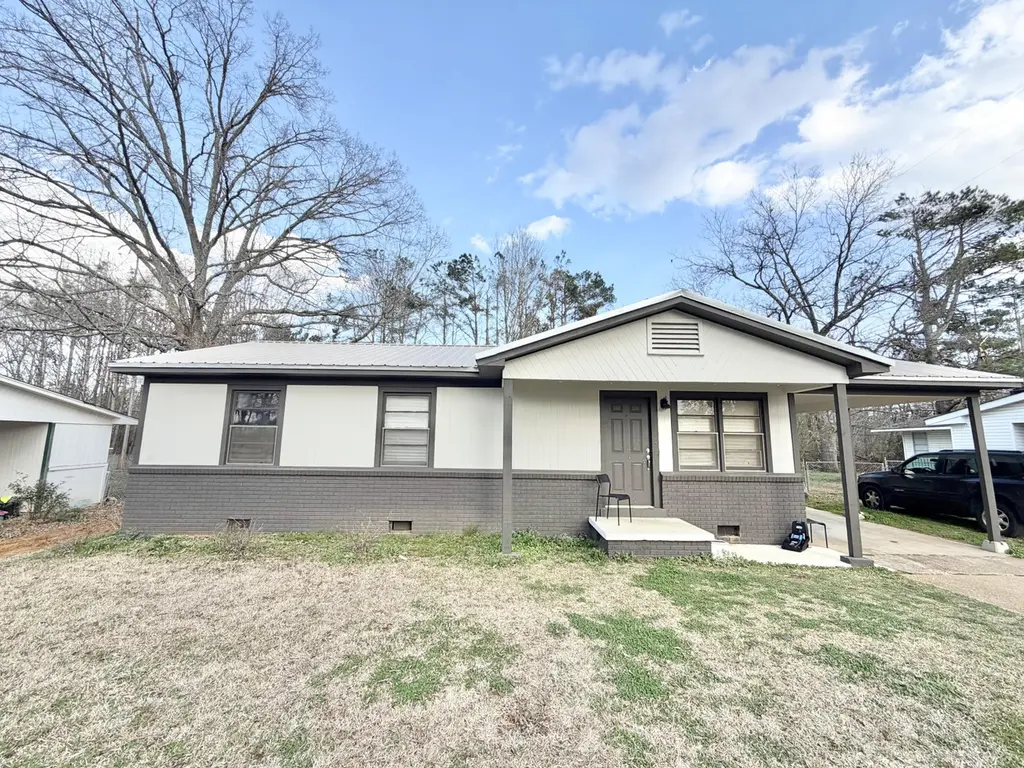
912 Moss Hill Dr · New Albany, MS
Flood risk 1/10 · Minimal
- FEMA flood zone
- X (unshaded)
- Chance of flooding over 30 yrs
- 0.0%
- Est. flood insurance / yr
- $507 – $1,088
Fire risk 4/10 · Minor
- Est. fire insurance / yr
- $1,241 – $2,305
Heat risk 6/10 · Moderate
- Hot days now (above 109°F)
- 7 days/yr
- Hot days in 30 yrs
- 20 days/yr
Wind risk 6/10 · Moderate
- Chance of severe wind over 30 yrs
- 27.0%
Air-quality risk 1/10 · Minimal
- Unhealthy air days now
- 0 days/yr
- Unhealthy air days in 30 yrs
- 0 days/yr
Risk factors via First Street. Map © Google.
Why this score? — see what drove the C+ grade
The composite is a weighted blend of 9 inputs, each scored 0–100. Each bar is that input's sub-score; the figure is the points it added to the 100-point composite (weight × sub-score).
- Cash flow +23.0/30.0
- ARV discount +15.0/15.0
- DSCR +7.4/10.0
- 1% rule +4.9/10.0
- Schools +3.9/10.0
- Livability +3.7/5.0
- Rent growth +2.5/5.0
- Condition / age +2.5/5.0
- Appreciation +0.0/10.0
$124,900
🖨 Deal sheet 📄 Offer letter ✓ Due diligence
Listing remarks MLS
This 4-bedroom, 1-bath home in New Albany offers a great opportunity for investors or first-time buyers. Located inside the city limits on a +/-0.22-acre lot, it features a fenced backyard that is perfect for privacy and outdoor living. Currently rented, it provides immediate income from day one. With easy access to schools, shopping, and local amenities, this home combines convenience and value. Don't miss out on this opportunity! All information is deemed accurate but is not guaranteed by Broker or Seller.
Key facts
- Local amenities
- Immediate income
- Fenced backyard
Tags
Neighborhood map
What this means for you Summary
Snapshot
- This is a 4-bed/1.0-bath single-family listed at $125k.
Deal economics
- At list price, monthly cash flow is $221 ($3k/yr) — positive.
- The deal already cash-flows at list — no discount required.
- To meet the 1% rule (rent ≥ 1% of price), the offer needs to be $123k (1.4% below list).
- Recommended offer: $114k (9.0% below list) — sets the bar for market timing.
Location & tenants
- Location reads 74/100 on livability (#13 in MS, #4,449 nationally) — a middle-class / working-renter tenant base. Strengths: crime A+, cost of living A+, health & safety A-; Watch: schools C-, employment D+, amenities F.
- New Albany Public Schools (rural): math 51% / reading 43% proficiency, ranked #22 of 130 in MS (top 17%) — families likely to look elsewhere, expect single-tenant / working-renter base with shorter leases.
- Market conditions: 156 active listings in the ZIP; 17 units permitted in Union County in 2024 (0 in 5+ unit buildings).
Forward outlook
- Local home prices are declining (-3.0%/yr); year-one equity from $864 of loan paydown is wiped out by about $4k of value loss. Plan a longer hold.
- Union County population projected at +19% by 2050 — long-run rental-demand tailwind backs the buy-and-hold thesis.
Negotiation context
- It's been on market 91 days — a 9% lower offer ($114k) is reasonable based on typical stale-listing flexibility.
Risks & watch-outs
- Watch-outs: built in 1959 — expect roof / HVAC / electrical / plumbing capex.
- Climate carrying-cost: major wind risk, 27% chance of damaging wind over 30y; extreme-heat days projected 7→20/yr by 2055 (HVAC capex compounding) — expect insurance premiums to compound above CPI over the hold.
Questions for the listing agent
- It's been on market 91 days. Have you received any prior offers? Is the seller open to a 9% concession, seller financing, or rate buy-down credit?
- Built in 1959 — when were the roof, HVAC, electrical panel, plumbing, and water heater last replaced?
- Why hasn't it sold? Are there any deal-killer items the seller is aware of (foundation, flood, title, zoning, code violations)?
- Is there a deadline driving the sale (1031 exchange, divorce, estate, relocation)? That informs how much negotiation room exists.
- What's the average days-on-market for RENTAL listings here right now (not sales)? A rising rental-DOM trend means longer vacancies and softer asking-rent achievability than the comps imply.
- What's the recent tenant-quality profile in this submarket — average credit score on applications, eviction rate, late-payment / NSF rate, and stable-employment percentage? A property-management company in the area should have these aggregated.
- How much new for-sale + rental construction is in the pipeline within 1–3 miles? Heavy new supply typically softens prices + rents 12–24 months out; constrained supply supports both.
Investment metrics
- 1% rule
- 0.99% ✗
- Cap rate
- 8.42%
- Cash-on-cash
- 7.60%
- DSCR
- 1.34
- GRM
- 8.5
CMA / ARV
- ARV (median comp)
- $181,247
- List price
- $124,900
- Delta
- -31.09%
- Verdict
- UNDERPRICED
- Comps
- 3 within 2.0 mi
Projected returns pro-forma
-3.0% appreciation · 3.0% rent growth · sell at horizon
- IRR
- -4.7%
- Equity multiple
- 0.82×
- Total profit
- $-6,183
- Equity at exit
- $18,623
- IRR
- 4.9%
- Equity multiple
- 1.36×
- Total profit
- $12,577
- Equity at exit
- $10,799
Cash invested: $34,972 (down + closing). Projections, not guarantees.
Landlord ↔ Tenant lean methodology
- Overall (STATE)
- 90 Strongly Landlord-Friendly
- State Mississippi
- 90 Strongly Landlord-Friendly · R+11
- County
- — inherits STATE
- City
- — inherits STATE
ZIP-level market 38652
- Home prices YoY
- -34.5%
- Active inventory
- 156
- Price-to-rent
- 8.5×
Monthly cashflow live
- Estimated rent
- $1,231 medium interval (Pro) →
- Mortgage (P&I)
- −$655
- Tax from tax record
- −$44 /mo · $528/yr
- Insurance
- −$52
- HOA
- −$0
- Vacancy / Maint / Mgmt
- −$259
- Net cashflow
- $221
Break-even live
UW: 25.0% down · 7.5% · 30yr · 1.5% tax · 5.0% vac · 8.0% maint · 8.0% mgmt
Financing live
Cash to close
- Down payment
- $31,225
- Closing costs
- $3,747
- Reserves months
- —
- Total cash needed
- —
Loan-product check · same deal, 3 products live
Conventional
25% down · 7.5% · 30yr
- Down + closing
- —
- Monthly P&I
- —
- Monthly cashflow
- —
- DSCR
- —
- Eligible?
- —
Personal DTI + credit; lowest rate.
DSCR
20% down · 8.5% · 30yr
- Down + closing
- —
- Monthly P&I
- —
- Monthly cashflow
- —
- DSCR
- —
- Eligible?
- —
No personal income docs; deal must DSCR.
Hard money
10% down · 12.0% · 12mo
- Down + closing
- —
- Monthly P&I
- —
- Monthly cashflow
- —
- DSCR
- —
- Eligible?
- —
Short-term bridge; refi at stabilization.
Listing history 9 events
-
2026-06-09days on market $124,900 Active 91 DOM
-
2026-06-08days on market $124,900 Active 90 DOM
-
2026-06-07days on market $124,900 Active 89 DOM
-
2026-06-07days on market $124,900 Active 88 DOM
-
2026-06-04days on market $124,900 Active 85 DOM
-
2026-06-02days on market $124,900 Active 84 DOM
-
2026-06-01days on market $124,900 Active 83 DOM
-
2026-05-31days on market $124,900 Active 82 DOM
-
2026-03-10$124,900 Active 513-char remark
Show marketing remark (513 chars)
This 4-bedroom, 1-bath home in New Albany offers a great opportunity for investors or first-time buyers. Located inside the city limits on a +/-0.22-acre lot, it features a fenced backyard that is perfect for privacy and outdoor living. Currently rented, it provides immediate income from day one. With easy access to schools, shopping, and local amenities, this home combines convenience and value. Don't miss out on this opportunity! All information is deemed accurate but is not guaranteed by Broker or Seller.
ⓘ Source: listings_history table (triggers on properties + properties_extension) + one-shot
backfill from property_details.listing_events for pre-trigger history.
Tax reassessment forecast MS · Resets to sale price
- Current annual tax
- $528 · $44/mo
- Projected year-2 tax
- $987 · $82/mo
- Expected delta
- +$459/yr (+$38/mo · 87.1%)
ⓘ Screening estimate from a state-policy table — verify with the county assessor before closing.
Climate risk First Street
- Flood 1/10 Low FEMA zone X (unshaded) · 0% chance over 30 yrs
- Wildfire 4/10 Moderate
- Heat 6/10 Major 7 d/yr ≥109°F today · 20 d/yr by 30 yrs out
- Wind 6/10 Major 27% chance of damaging wind over 30 yrs
- Air quality 1/10 Low 0 unhealthy d/yr today · 0 by 30 yrs out
Nearby sold comps map
Loading sold comps map…
Walkable amenities ~0.75 mi
Loading nearby amenities…
Taxation est. · year 1
- Rental income
- $14,772
- − Mortgage interest
- −$6,996
- − Property taxes
- −$528
- − Insurance
- −$624
- − Repairs & maintenance
- −$1,182
- − Management
- −$1,182
- − Depreciation
- −$3,633
- Taxable income
- $627
- Est. tax owed @ 24.0%
- −$150
- After-tax cash flow
- $2,508/yr
For passive investors: Depreciation is non-cash, so a rental often shows a tax loss while cash-flowing — sheltering income. Rental losses are passive: they offset passive income freely, and up to $25,000/yr can offset ordinary (W-2) income if you actively participate and your MAGI is under $100k (phasing out to $0 by $150k); unused losses carry forward. On sale, claimed depreciation is recaptured at up to 25%, and gains may owe capital-gains tax (a 1031 exchange can defer both). Figures are a year-1 estimate at your 24.0% rate — not tax advice; consult a CPA.
Schools (NCES district)
- District
- New Albany Public Schools
- NCES district ID
- 2803120
- Math proficiency
- 51% ▼ -13.00%
- Reading proficiency
- 43% ▼ -10.00%
- Median HH income
- $37,325
- Composite
- 39.13/100
- National rank
- #4037
- State rank
- #22 of 130 in MS
Livability — New Albany
- Score
- 74/100
- State rank
- #13
- US rank
- #4449
Category grades
Schools grade is shown separately in the Schools card above.
Census & demographics
- Census place
- New Albany, MS
- City population
- 15,540
- Population (ZIP)
- 15,540
Population outlook (Union County) Hauer SSP2
- Today (2025)
- 30,992 people
- By 2030
- 32,294 · +4.2%
- By 2040
- 34,789 · +12.3%
- By 2050
- 36,987 · +19.3%
- By 2075
- 40,835 · +31.8%
- By 2100
- 40,538 · +30.8%
Race, ethnicity, and origin ACS 2023
- Neighborhood character
- Predominantly White (68%)
- Race & ethnicity
- White 68% Black 20% Hispanic / Latino 8% Two or more races 4%
- Hispanic origin (detail)
- Mexican 8%
- Common ancestry
- Lithuanian 2% Italian 1% Serbian 1%
- Foreign-born
- 4% · Canada
- Languages at home
- 94% English-only · Spanish 6%
Political lean MEDSL · Union
- 2024 margin
- Solid R (+70.1) · D 14.5% · R 84.6%
- 2008→2024 swing
- -20.2pp toward R · 2008: -49.9pp · 2024: -70.1pp
- All cycles
- 2024: R+70.1 2020: R+64.8 2016: R+63.2 2012: R+51.0 2008: R+49.9
Not yet ingested
- Civics
- —
Market trends
- HPI YoY
- ▼ -80.75%
- Current HPI
- 153.1381
- Rent YoY
- —
- Metro
- —
- State GDP YoY
- —
- F500 in state
- 0
Price history
1 event — show timeline
- 2026-03-10 Listed $124,900 NEMSBD
Property tax history
+4.7%/yrLatest (2025): $528 · +3.8% YoY. Source: county tax records.
Cash-flow waterfall
monthlySold comps — $/sqft
last 12 mo · ≤1 miLoading sold comps…