221 Picabo Street St Unit H (3-B) · Ketchum, ID
Flood risk 9/10 · Severe
- FEMA flood zone
- X (shaded)
- Chance of flooding over 30 yrs
- 0.99%
- Est. flood insurance / yr
- $507 – $1,088
Fire risk 8/10 · Major
- Est. fire insurance / yr
- $584 – $1,086
Heat risk 2/10 · Minimal
- Hot days now (above 82°F)
- 11 days/yr
- Hot days in 30 yrs
- 26 days/yr
Wind risk 1/10 · Minimal
- Chance of severe wind over 30 yrs
- —
Air-quality risk 7/10 · Major
- Unhealthy air days now
- 15 days/yr
- Unhealthy air days in 30 yrs
- 16 days/yr
Risk factors via First Street. Map © Google.
Why this score? — see what drove the D grade
The composite is a weighted blend of 9 inputs, each scored 0–100. Each bar is that input's sub-score; the figure is the points it added to the 100-point composite (weight × sub-score).
- Appreciation +10.0/10.0
- 1% rule +8.2/10.0
- ARV discount +7.5/15.0
- Condition / age +4.8/5.0
- Schools +3.9/10.0
- Livability +3.4/5.0
- Cash flow +3.3/30.0
- Rent growth +2.5/5.0
- DSCR +0.0/10.0
$240,000
🖨 Deal sheet (PDF) 📄 Offer letter ✓ Due diligence
Listing remarks
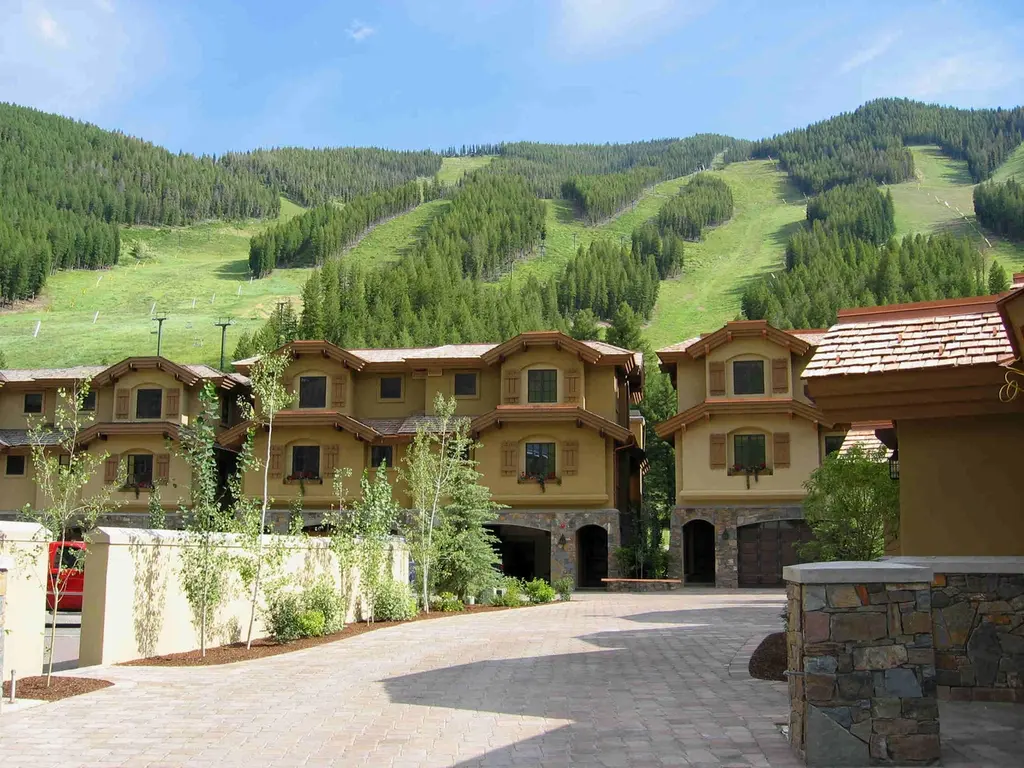
World Cup skiing returns to Sun Valley in 2027--own your place in the action! Steps from the lifts, Warm Springs Creek & pristine trails, this elegant 12-guest condo delivers mountain views, private elevator, 2-car garage & daily housekeeping. Clubhouse gym, steam room, outdoor pool & hot tub await. 1/9 fractional ownership. Effortless luxury. Your mountain legacy starts here.
Key facts
- $1,579 HOA
- 2 garage spots
- Community pool
Property features AI
Finance
- Financial info: Association fee: $4,738.50 quarterly
- HOA & community: Community pool and spa/hot tub; Quarterly association fee
Exterior
- Parking: Attached heated garage; Paver block driveway; 2 garage spaces
- Utilities: Underground utilities; Cable available
- Home design: Residential condominium
- Construction: Crawl space
- Exterior features: Balcony; Spa/Hot Tub; Pool; Storage; Landscaped grounds; Paved access
Interior
- Kitchen: Cooktop; Dishwasher; Garbage disposal; Microwave; Electric oven; Gas range; Refrigerator; Freezer
- Heating & cooling: Forced air heating with humidity control; Central air conditioning
- Interior features: Walk-in closets; Cathedral ceilings; Elevator; High ceilings; Window coverings; Furnished; Gas and wood-burning fireplaces; Intercom
- Laundry & utility: Washer; Dryer
Neighborhood map
What this means for you Summary
Snapshot
- This is a 4-bed/4.0-bath condo listed at $240k. Condition is rated excellent.
Deal economics
- At list price, monthly cash flow is $-810 ($-10k/yr) — negative.
- To cash-flow at today's rent, offer at most $123k (48.8% below list).
- Meets the 1% rule at list price ($3k rent vs $240k).
- Recommended offer: $123k (48.8% below list) — sets the bar for cash-flow.
Location & tenants
- Location reads 68/100 on livability (#76 in ID) — a middle-class / working-renter tenant base. Strengths: crime A+, employment A+; Watch: housing C-, health & safety C-, amenities F.
- Blaine County District (town): math 37% / reading 51% proficiency, ranked #47 of 92 in ID (top 51%) — families likely to look elsewhere, expect single-tenant / working-renter base with shorter leases.
- Zoned schools: Wood River Middle School (math 35% / reading 51%, grade D-, #62 of 109 statewide, top 58%, 568 students, 32% FRL) — zoned schools at 32% FRL track the district average.
- Market conditions: 136 active listings in the ZIP; 119 units permitted in Blaine County in 2024 (19 in 5+ unit buildings).
Forward outlook
- In year one you build about $26k of equity ($2k loan paydown + $24k appreciation (10.0% local appreciation)).
- Blaine County population projected to shrink 6% by 2050 — rents likely to lag national; underwrite the cash flow, not the appreciation.
- By year 2, paydown + projected appreciation supports a ~$41k cash-out refi (75% LTV) — recoverable capital for the next deal without selling this one.
Negotiation context
- It's been on market 45 days — a 3% lower offer ($233k) is reasonable based on typical stale-listing flexibility.
Risks & watch-outs
- Watch-outs: flood insurance adds $66/mo; HOA is 50% of rent.
- Climate carrying-cost: severe flood risk; severe wildfire risk — expect insurance premiums to compound above CPI over the hold.
Questions for the listing agent
- What do current leases actually rent for vs. the listed asking? Can we see a recent rent roll and the last 12 months of T-12 income?
- It's been on market 45 days. Have you received any prior offers? Is the seller open to a 49% concession, seller financing, or rate buy-down credit?
- What's the actual annual flood-insurance premium (NFIP or private), and is the property in a SFHA with mandatory coverage?
- What does the HOA fee cover, when was the last increase, and are there any pending special assessments or reserve-fund shortfalls?
- Any open or pending special assessments — roof, HVAC, plumbing, elevator, façade? What's the per-unit balance and payoff schedule, and is the seller paying it off at close or rolling it to the buyer?
- Is there a deadline driving the sale (1031 exchange, divorce, estate, relocation)? That informs how much negotiation room exists.
- Schools are A-rated — typically a magnet for longer-tenancy family renters. What's the average tenant stay here, and is there a school-zone premium baked into asking?
- The area grade is low — what's the realistic commute time and amenity access for the typical tenant pool here? Any planned neighborhood developments (good or bad) we should know about?
- What's the average days-on-market for RENTAL listings here right now (not sales)? A rising rental-DOM trend means longer vacancies and softer asking-rent achievability than the comps imply.
- What's the recent tenant-quality profile in this submarket — average credit score on applications, eviction rate, late-payment / NSF rate, and stable-employment percentage? A property-management company in the area should have these aggregated.
- How much new apartment / multifamily construction is in the pipeline within 1–3 miles? Heavy new supply (>2% of stock underway) typically softens rents 12–24 months out; light construction supports rent growth.
Investment metrics
- 1% rule
- 1.32% ✓
- Cap rate
- 2.57%
- Cash-on-cash
- -13.28%
- DSCR
- 0.41
- GRM
- 6.3
CMA / ARV
No comps found within radius.
Projected returns pro-forma
10.0% appreciation · 3.0% rent growth · sell at horizon
- IRR
- 14.4%
- Equity multiple
- 2.19×
- Total profit
- $80,170
- Equity at exit
- $216,211
- IRR
- 14.4%
- Equity multiple
- 5.15×
- Total profit
- $278,771
- Equity at exit
- $466,267
Cash invested: $67,200 (down + closing). Projections, not guarantees.
Landlord ↔ Tenant lean methodology
- Overall (STATE)
- 91 Strongly Landlord-Friendly
- State Idaho
- 91 Strongly Landlord-Friendly · R+18
- County
- — inherits STATE
- City
- — inherits STATE
ZIP-level market 83340
- Home prices YoY
- 3.8%
- Active inventory
- 136
- Price-to-rent
- 6.3×
Monthly cashflow live
- Estimated rent
- $3,157 medium interval (Pro) →
- Mortgage (P&I)
- −$1,259
- Tax est. 1.5%
- −$300 /mo · $3,600/yr
- Insurance
- −$100
- Flood insurance flood zone
- −$66 /mo · $798/yr
- HOA
- −$1,579
- Vacancy / Maint / Mgmt
- −$663
- Net cashflow
- $-810
Break-even live
Sensitivity live
| Price | -10% $-644 | -5% $-727 | +0% $-810 | +5% $-893 | +10% $-976 |
|---|---|---|---|---|---|
| Rent | -10% $-1,060 | -5% $-935 | +0% $-810 | +5% $-685 | +10% $-561 |
| Rate | -1.0pp $-689 | -0.5pp $-749 | base $-810 | +0.5pp $-872 | +1.0pp $-936 |
UW: 25.0% down · 7.5% · 30yr · 1.5% tax · 5.0% vac · 8.0% maint · 8.0% mgmt
Financing live
Cash to close
- Down payment
- $60,000
- Closing costs
- $7,200
- Reserves months
- —
- Total cash needed
- —
Loan-product check · same deal, 3 products live
Conventional
25% down · 7.5% · 30yr
- Down + closing
- —
- Monthly P&I
- —
- Monthly cashflow
- —
- DSCR
- —
- Eligible?
- —
Personal DTI + credit; lowest rate.
DSCR
20% down · 8.5% · 30yr
- Down + closing
- —
- Monthly P&I
- —
- Monthly cashflow
- —
- DSCR
- —
- Eligible?
- —
No personal income docs; deal must DSCR.
Hard money
10% down · 12.0% · 12mo
- Down + closing
- —
- Monthly P&I
- —
- Monthly cashflow
- —
- DSCR
- —
- Eligible?
- —
Short-term bridge; refi at stabilization.
HOA detail condo
- Monthly dues
- $1,579 · $18,948/yr
- Likely covers
- poolgym
- Assessments
- None detected in remarks — confirm with the listing agent.
Listing history 4 events
-
2026-06-03days on market $240,000 Active 45 DOM
-
2026-06-01days on market $240,000 Active 44 DOM
-
2026-05-31days on market $240,000 Active 43 DOM
-
2026-04-18$240,000 Active
ⓘ Source: listings_history table (triggers on properties + properties_extension) + one-shot
backfill from property_details.listing_events for pre-trigger history.
Climate risk First Street
- Flood 9/10 Extreme FEMA zone X (shaded) · 99% chance over 30 yrs
- Wildfire 8/10 Severe
- Heat 2/10 Low 11 d/yr ≥82°F today · 26 d/yr by 30 yrs out
- Wind 1/10 Low
- Air quality 7/10 Severe 15 unhealthy d/yr today · 16 by 30 yrs out
Nearby sold comps map
Loading sold comps map…
Walkable amenities ~0.75 mi
Loading nearby amenities…
Taxation est. · year 1
- Rental income
- $37,882
- − Mortgage interest
- −$13,444
- − Property taxes
- −$3,600
- − Insurance
- −$1,997
- − Repairs & maintenance
- −$3,031
- − Management
- −$3,031
- − HOA
- −$18,948
- − Depreciation
- −$6,982
- Taxable loss
- −$13,150
- Est. tax savings @ 24.0%
- +$3,156
- After-tax cash flow
- $-6,566/yr
For passive investors: Depreciation is non-cash, so a rental often shows a tax loss while cash-flowing — sheltering income. Rental losses are passive: they offset passive income freely, and up to $25,000/yr can offset ordinary (W-2) income if you actively participate and your MAGI is under $100k (phasing out to $0 by $150k); unused losses carry forward. On sale, claimed depreciation is recaptured at up to 25%, and gains may owe capital-gains tax (a 1031 exchange can defer both). Figures are a year-1 estimate at your 24.0% rate — not tax advice; consult a CPA.
Condition & rehab AI · 13 photos
This luxury condo is in excellent condition with modern amenities and stunning mountain views. It's move-in ready and perfect for both resale and rental.
Value-add opportunities
- Both landscaping — enhances curb appeal and adds value
- Both interior paint — fresh paint can make a big difference in appearance
Renovation cost estimate screening
Value-add ROI direction
- Both landscaping — enhances curb appeal and adds value ↑
- Both interior paint — fresh paint can make a big difference in appearance ↑
ⓘ Cost ranges are severity-bucket heuristics (US national rule-of-thumb). Get contractor quotes + a written scope before underwriting a rehab budget.
Schools (NCES district)
- District
- Blaine County District
- NCES district ID
- 1600300
- Math proficiency
- 37% ▼ -9.00%
- Reading proficiency
- 51% ▼ -9.00%
- Median HH income
- $57,869
- Composite
- 38.51/100
- National rank
- #4175
- State rank
- #47 of 92 in ID
Livability — Ketchum
- Score
- 68/100
- State rank
- #76
- US rank
- #9340
Category grades
Schools grade is shown separately in the Schools card above.
Census & demographics
- Census place
- Ketchum, ID
- Population (ZIP)
- 5,379
Population outlook (Blaine County) Hauer SSP2
- Today (2025)
- 22,350 people
- By 2030
- 22,411 · +0.3%
- By 2040
- 21,897 · -2.0%
- By 2050
- 21,062 · -5.8%
- By 2075
- 19,591 · -12.3%
- By 2100
- 17,221 · -22.9%
Race, ethnicity, and origin ACS 2023
- Neighborhood character
- Predominantly White (78%)
- Race & ethnicity
- White 78% Hispanic / Latino 19% Two or more races 2%
- Hispanic origin (detail)
- Mexican 8%
- Common ancestry
- Portuguese 9% Serbian 7% Iranian 5%
- Foreign-born
- 18% · Canada, China
- Languages at home
- 83% English-only · Spanish 14% French/Haitian/Cajun 1% Other Indo-European 1%
Political lean MEDSL · Blaine
- 2024 margin
- Solid D (+31.7) · D 64.4% · R 32.7% · Other 2.9%
- 2008→2024 swing
- -1.5pp toward R · 2008: 33.2pp · 2024: 31.7pp
- All cycles
- 2024: D+31.7 2020: D+36.8 2016: D+28.7 2012: D+20.1 2008: D+33.2
Not yet ingested
- Civics
- —
Market trends
- HPI YoY
- ▲ 10.04%
- Current HPI
- 272.384
- Rent YoY
- —
- Metro
- —
- State GDP YoY
- ▲ 4.51%
- F500 in state
- 6
Industry mix (Fortune 500 HQ in ID)
| Industry | F500 HQs | Revenue |
|---|---|---|
| Retail | 1 | $79B |
|
||
| Technology | 1 | $25B |
|
||
| Food / Agriculture | 1 | $6B |
|
||
Price history
1 event — show timeline
- 2026-04-18 Listed $240,000 SVBOR
Cash-flow waterfall
monthlySold comps — $/sqft
last 12 mo · ≤1 miLoading sold comps…