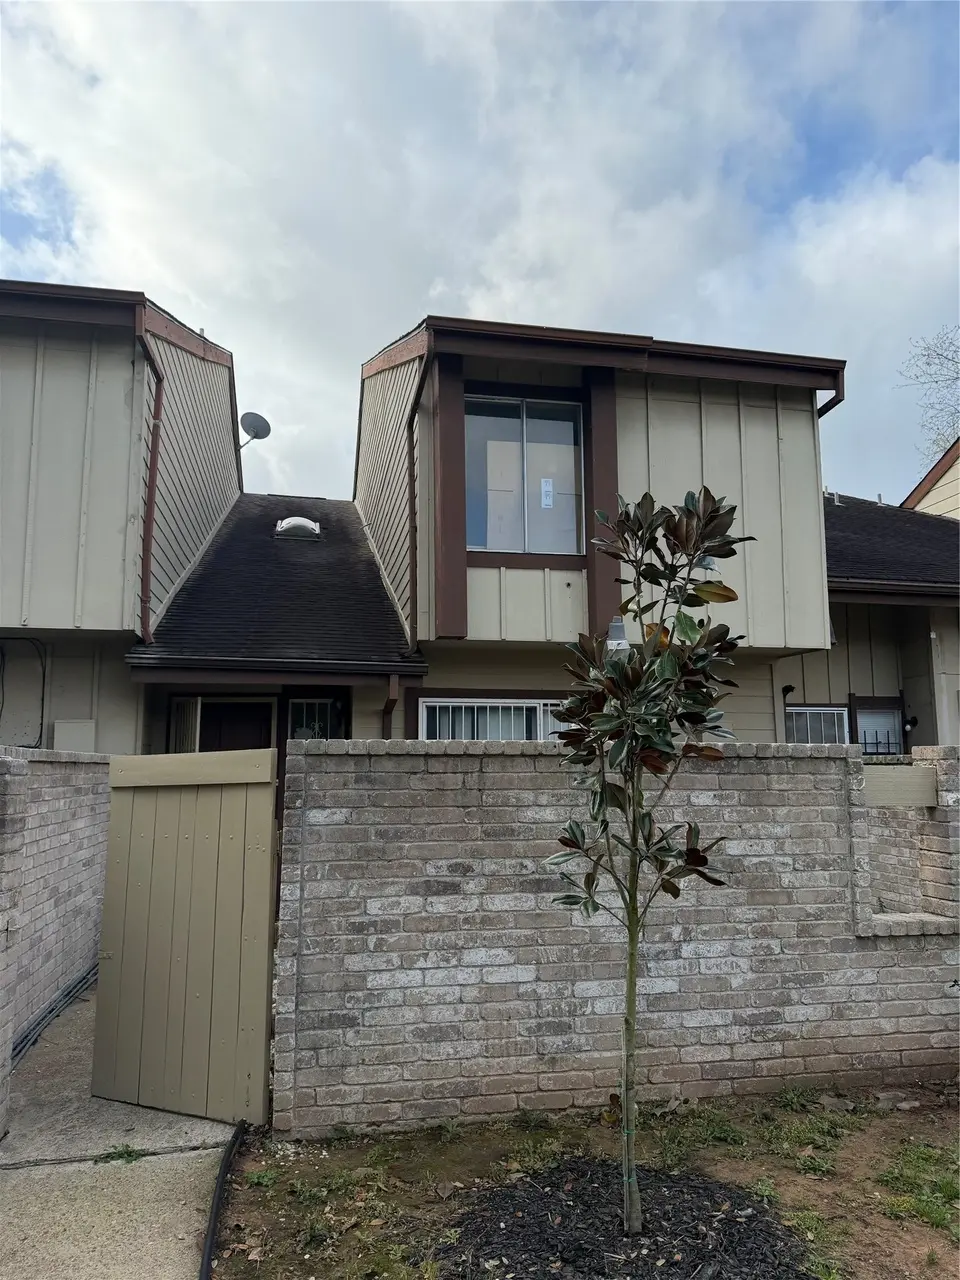
12682 Newbrook Dr · Houston, TX
Flood risk 5/10 · Moderate
- FEMA flood zone
- A
- Chance of flooding over 30 yrs
- 0.41%
- Est. flood insurance / yr
- $1,009 – $1,996
Fire risk 1/10 · Minimal
- Est. fire insurance / yr
- $1,222 – $2,270
Heat risk 9/10 · Severe
- Hot days now (above 110°F)
- 7 days/yr
- Hot days in 30 yrs
- 23 days/yr
Wind risk 9/10 · Severe
- Chance of severe wind over 30 yrs
- 99.0%
Air-quality risk 2/10 · Minimal
- Unhealthy air days now
- 2 days/yr
- Unhealthy air days in 30 yrs
- 2 days/yr
Risk factors via First Street. Map © Google.
Why this score? — see what drove the D+ grade
The composite is a weighted blend of 9 inputs, each scored 0–100. Each bar is that input's sub-score; the figure is the points it added to the 100-point composite (weight × sub-score).
- ARV discount +15.0/15.0
- Cash flow +10.2/30.0
- 1% rule +7.2/10.0
- Livability +3.7/5.0
- DSCR +2.9/10.0
- Rent growth +2.5/5.0
- Condition / age +2.5/5.0
- Schools +2.1/10.0
- Appreciation +0.0/10.0
$120,000
🖨 Deal sheet 📄 Offer letter ✓ Due diligence
Listing remarks MLS
2 bedroom 2.5 bath. Great potential for first time buyers or investment home. Good size bedrooms each with bathroom. 1 bedroom has an open window to the stairs area. Recently replaced AC Unit. Small patio area in front of home great for cooking outdoors. Kitchen countertops and cabinets recently redone.
Key facts
- $233 HOA
- 2 garage spots
- Built 1977
Tags
Neighborhood map
What this means for you Summary
Snapshot
- This is a 2-bed/2.5-bath townhouse listed at $120k.
Deal economics
- At list price, monthly cash flow is $-193 ($-2k/yr) — negative.
- To cash-flow at today's rent, offer at most $86k (28.4% below list).
- Meets the 1% rule at list price ($1k rent vs $120k).
- Recommended offer: $86k (28.4% below list) — sets the bar for cash-flow.
- Cap rate 5.6% vs local median 3.2% in Houston — top-decile yield for the area; either an underpriced asset or a hidden risk that comps aren't pricing in. Stress-test before assuming the spread holds.
Location & tenants
- Location reads 74/100 on livability (#184 in TX, #4,771 nationally) — a middle-class / working-renter tenant base. Strengths: amenities A+, cost of living A+, housing A+; Watch: schools D, crime F.
- Alief ISD (urban): math 23% / reading 28% proficiency, ranked #717 of 826 in TX (top 87%) — low school quality limits family demand, transient renter base, plan for 1-2y turnover; 74% free/reduced lunch — lower-income household profile, screen leases tightly.
- Market conditions: Rents flat; 204 active listings in the ZIP; 40 comparable units currently listed for rent nearby; rentals at typical pace (median 22d on market — plan ~3-4 weeks tenant-placement turnaround); 42% of comp listings sitting > 30 days — soft ceiling on asking rent; 29,883 units permitted in Harris County in 2024 (8,621 in 5+ unit buildings).
- This rent runs 34% of the median local income ($51k/yr) — at the standard rent-burdened threshold; future hikes will face affordability resistance.
Forward outlook
- Local home prices are declining (-3.0%/yr); year-one equity from $830 of loan paydown is wiped out by about $4k of value loss. Plan a longer hold.
- Harris County population projected at +47% by 2050 — long-run rental-demand tailwind backs the buy-and-hold thesis.
Negotiation context
- It's been on market 94 days — a 9% lower offer ($109k) is reasonable based on typical stale-listing flexibility.
- 2 sale attempts with the ask held roughly flat each time — persistent listings suggest the price (not the market) is what's stuck; bring a comps-based counter.
Risks & watch-outs
- Watch-outs: property tax is 3.1% of price; flood insurance adds $125/mo.
- Climate carrying-cost: in FEMA flood zone A (mandatory federal flood insurance); severe wind risk, 99% chance of damaging wind over 30y; extreme-heat days projected 7→23/yr by 2055 (HVAC capex compounding) — expect insurance premiums to compound above CPI over the hold.
Questions for the listing agent
- What do current leases actually rent for vs. the listed asking? Can we see a recent rent roll and the last 12 months of T-12 income?
- It's been on market 94 days. Have you received any prior offers? Is the seller open to a 28% concession, seller financing, or rate buy-down credit?
- Built in 1977 — when were the roof, HVAC, electrical panel, plumbing, and water heater last replaced?
- Property tax is high relative to price — has the assessment been appealed recently, and will the sale trigger a re-assessment?
- What's the actual annual flood-insurance premium (NFIP or private), and is the property in a SFHA with mandatory coverage?
- What does the HOA fee cover, when was the last increase, and are there any pending special assessments or reserve-fund shortfalls?
- Why hasn't it sold? Are there any deal-killer items the seller is aware of (foundation, flood, title, zoning, code violations)?
- Is there a deadline driving the sale (1031 exchange, divorce, estate, relocation)? That informs how much negotiation room exists.
- Schools are D-rated, which usually means shorter tenancies and higher turnover. Who's the typical renter profile here, and what's been the actual vacancy rate?
- Crime grade is F in this area — have there been break-ins, vandalism, or insurance claims at this property in the last 3 years? What carrier currently insures it and at what premium?
- The area grade is low — what's the realistic commute time and amenity access for the typical tenant pool here? Any planned neighborhood developments (good or bad) we should know about?
- What's the average days-on-market for RENTAL listings here right now (not sales)? A rising rental-DOM trend means longer vacancies and softer asking-rent achievability than the comps imply.
- What's the recent tenant-quality profile in this submarket — average credit score on applications, eviction rate, late-payment / NSF rate, and stable-employment percentage? A property-management company in the area should have these aggregated.
- How much new for-sale + rental construction is in the pipeline within 1–3 miles? Heavy new supply typically softens prices + rents 12–24 months out; constrained supply supports both.
Investment metrics
- 1% rule
- 1.22% ✓
- Cap rate
- 5.62%
- Cash-on-cash
- -2.41%
- DSCR
- 0.89
- GRM
- 6.8
CMA / ARV
- ARV (median comp)
- $147,952
- List price
- $120,000
- Delta
- -18.89%
- Verdict
- UNDERPRICED
- Comps
- 20 within 1.0 mi
Show comp detail 12 sales within ~0.75 mi
| Address | Dist | Beds/Ba | Sqft | Sold | Price | $/sf | Match |
|---|---|---|---|---|---|---|---|
| 12502 Newbrook Dr | 0.18mi | 3/2.5 (+1) | 1,304 (-6%) | 1mo | $115,000 | $88 | 77 |
| 12606 Wellington Park Dr | 0.10mi | 3/2.0 (+1) | 1,264 (-8%) | 3mo | $148,000 | $117 | 72 |
| 12500 Brookglade Cir #166 | 0.40mi | 3/2.5 (+1) | 1,320 (-4%) | 0mo | $149,900 | $114 | 69 |
| 12552 Newbrook Dr | 0.14mi | 3/2.0 (+1) | 1,264 (-8%) | 7mo | $150,000 | $119 | 66 |
| 12500 Brookglade Cir #176 | 0.40mi | 3/2.5 (+1) | 1,320 (-4%) | 5mo | $135,000 | $102 | 65 |
| 8030 Singing Sonnet Ln | 0.69mi | 2/2.5 | 1,408 (+2%) | 1mo | $189,000 | $134 | 64 |
| 12524 Pebblestone St | 0.60mi | 3/2.5 (+1) | 1,364 (-1%) | 1mo | $197,990 | $145 | 64 |
| 12400 Brookglade Cir #55 | 0.51mi | 3/2.5 (+1) | 1,330 (-4%) | 11mo | $159,500 | $120 | 56 |
| 13111 Brutus Hill Ln | 0.62mi | 3/2.5 (+1) | 1,544 (+12%) | 2mo | $229,000 | $148 | 45 |
| 13122 Stratford Skies Ln | 0.63mi | 3/2.5 (+1) | 1,532 (+11%) | 8mo | $215,000 | $140 | 41 |
| 13103 Cressida Glen Ln | 0.68mi | 3/2.5 (+1) | 1,532 (+11%) | 5mo | $215,000 | $140 | 41 |
| 7930 Montague Manor Ln | 0.75mi | 3/2.5 (+1) | 1,532 (+11%) | 4mo | $179,500 | $117 | 39 |
Match score weights: distance 35% · size 25% · config 20% · recency 20%. Top-matched comps best support the ARV.
Projected returns pro-forma
-3.0% appreciation · 0.05% rent growth · sell at horizon
- IRR
- -34.0%
- Equity multiple
- -0.06×
- Total profit
- $-35,591
- Equity at exit
- $17,892
- IRR
- -86.0%
- Equity multiple
- -0.84×
- Total profit
- $-61,726
- Equity at exit
- $10,375
Cash invested: $33,600 (down + closing). Projections, not guarantees.
Landlord ↔ Tenant lean methodology
- Overall (STATE)
- 87 Strongly Landlord-Friendly
- State Texas
- 87 Strongly Landlord-Friendly · R+5
- County
- — inherits STATE
- City
- — inherits STATE
ZIP-level market 77072
- Home prices YoY
- -26.4%
- Rents YoY
- 0.1%
- Active inventory
- 204
- Price-to-rent
- 6.8×
Monthly cashflow live
- Estimated rent
- $1,464 high interval (Pro) →
- Mortgage (P&I)
- −$629
- Tax from tax record
- −$311 /mo · $3,736/yr
- Insurance
- −$50
- Flood insurance flood zone
- −$125 /mo · $1,502/yr
- HOA
- −$233
- Vacancy / Maint / Mgmt
- −$307
- Net cashflow
- $-193
Break-even live
UW: 25.0% down · 7.5% · 30yr · 1.5% tax · 5.0% vac · 8.0% maint · 8.0% mgmt
Financing live
Cash to close
- Down payment
- $30,000
- Closing costs
- $3,600
- Reserves months
- —
- Total cash needed
- —
Loan-product check · same deal, 3 products live
Conventional
25% down · 7.5% · 30yr
- Down + closing
- —
- Monthly P&I
- —
- Monthly cashflow
- —
- DSCR
- —
- Eligible?
- —
Personal DTI + credit; lowest rate.
DSCR
20% down · 8.5% · 30yr
- Down + closing
- —
- Monthly P&I
- —
- Monthly cashflow
- —
- DSCR
- —
- Eligible?
- —
No personal income docs; deal must DSCR.
Hard money
10% down · 12.0% · 12mo
- Down + closing
- —
- Monthly P&I
- —
- Monthly cashflow
- —
- DSCR
- —
- Eligible?
- —
Short-term bridge; refi at stabilization.
Rent comps 40 comps
| Address | Beds | Baths | Sqft | Rent | $/sqft | DOM | Units | Dist |
|---|---|---|---|---|---|---|---|---|
| 12717 Yoshino Cherry St Houston, TX | 3.0 | 2.5 | 1650 | $1,950 | $1.18 | 24d | 1 | 0.13mi |
| 12510 Newbrook Dr #223 Houston, TX | 2.0 | 1.5 | 1131 | $1,585 | $1.40 | 43d | 1 | 0.19mi |
| 13027 Bacard Ln Houston, TX | 3.0 | 2.0 | 1748 | $1,750 | $1.00 | 43d | 1 | 0.50mi |
| 12400 Brookglade Cir Houston, TX | 2.0 | 2.5 | 1212 | $1,450 | $1.20 | 43d | 1 | 0.52mi |
| 8006 Cook Rd Houston, TX | 3.0 | 2.0 | 1200 | $1,250 | $1.04 | 43d | 1 | 0.59mi |
| 13156 Bissonnet St Houston, TX | 2.0 | 2.0 | 950 | $1,149 | $1.21 | 43d | 1 | 0.64mi |
| 9506 S Dairy Ashford Rd Houston, TX | 2.0–3.0 | 1.5–2.5 | 1223 | $1,060 | $0.87 | 1d | 13 | 0.69mi |
| 9420 S Dairy Ashford Rd Houston, TX | 3.0 | 2.0 | 1228 | $1,370 | $1.12 | 43d | 1 | 0.73mi |
| 7520 Cook Rd Unit 2112 Houston, TX | 2.0 | 2.0 | 935 | $1,019 | $1.09 | 2d | 1 | 0.78mi |
| 7520 Cook Rd Unit 422 Houston, TX | 2.0 | 2.0 | 935 | $1,027 | $1.10 | 7d | 1 | 0.78mi |
| 7520 Cook Rd Unit 421 Houston, TX | 2.0 | 2.0 | 935 | $1,051 | $1.12 | 10d | 1 | 0.78mi |
| 7520 Cook Rd Unit 424 Houston, TX | 2.0 | 2.0 | 935 | $1,027 | $1.10 | 5d | 1 | 0.78mi |
| 7520 Cook Rd Unit 7553 Houston, TX | 3.0 | 2.0 | 1290 | $1,346 | $1.04 | 10d | 1 | 0.78mi |
| 7520 Cook Rd Unit 3148 Houston, TX | 3.0 | 2.0 | 1290 | $1,314 | $1.02 | 2d | 1 | 0.78mi |
| 9400 Coventry Square Dr Houston, TX | 1.0–2.0 | 1.0–2.0 | 770 | $1,205 | $1.56 | 43d | 6 | 0.82mi |
| 7526 Cook Rd Houston, TX | 3.0 | 2.0 | 1290 | $1,287 | $1.00 | 43d | 1 | 0.85mi |
| 9401 Coventry Square Dr Houston, TX | 1.0–2.0 | 1.0–2.0 | 770 | $1,389 | $1.80 | 1d | 9 | 0.85mi |
| 7520 Cook Rd Unit 2047 Houston, TX | 2.0 | 2.0 | 935 | $1,062 | $1.14 | 10d | 1 | 0.85mi |
| 9903 S Dairy Ashford Rd Unit 2162 Houston, TX | 2.0 | 2.0 | 947 | $1,075 | $1.14 | 7d | 1 | 0.96mi |
| 9903 S Dairy Ashford Rd Unit 510 Houston, TX | 3.0 | 2.0 | 1082 | $1,137 | $1.05 | 2d | 1 | 0.96mi |
| 7119 Brendam Ln Houston, TX | 2.0 | 1.5 | 1231 | $1,400 | $1.14 | 3d | 1 | 0.99mi |
| 9903 S Dairy Ashford Rd Unit 2047 Houston, TX | 2.0 | 2.0 | 947 | $1,067 | $1.13 | 2d | 1 | 1.02mi |
| 12023 Bissonnet St Houston, TX | 1.0–2.0 | 1.0–2.0 | 753 | $1,155 | $1.53 | 43d | 66 | 1.08mi |
| 12023 Bissonnet St Unit 12056 Houston, TX | 3.0 | 2.0 | 1179 | $1,515 | $1.28 | 2d | 1 | 1.08mi |
| 10343 Huntington Place Dr Houston, TX | 3.0 | 3.0 | 1472 | $1,649 | $1.12 | 21d | 1 | 1.08mi |
| 13009 Greenway Chase Ct #3009 Houston, TX | 2.0 | 2.5 | 1422 | $1,350 | $0.95 | 43d | 1 | 1.09mi |
| 13009 Greenway Chase Ct Houston, TX | 2.0 | 3.0 | 1422 | $1,350 | $0.95 | 43d | 1 | 1.09mi |
| 12701 Leader St Houston, TX | 2.0 | 1.0 | 1000 | $1,475 | $1.48 | 11d | 1 | 1.12mi |
| 13004 Greenway Chase Ct Houston, TX | 2.0 | 2.0 | 1332 | $1,500 | $1.13 | 43d | 1 | 1.13mi |
| 6975 Westbranch Dr Houston, TX | 3.0 | 2.0 | 1287 | $1,425 | $1.11 | 43d | 1 | 1.15mi |
| 12710 Leader St Houston, TX | 2.0 | 2.0 | 1107 | $1,200 | $1.08 | 43d | 1 | 1.16mi |
| 7006 Cook Rd Houston, TX | 2.0 | 2.0 | 965 | $1,255 | $1.30 | 43d | 1 | 1.16mi |
| 7000 Cook Rd Unit 425 Houston, TX | 2.0 | 2.0 | 965 | $886 | $0.92 | 2d | 1 | 1.17mi |
| 7000 Cook Rd Unit 424 Houston, TX | 2.0 | 2.0 | 965 | $894 | $0.93 | 7d | 1 | 1.17mi |
| 7000 Cook Rd Unit 2162 Houston, TX | 2.0 | 2.0 | 965 | $894 | $0.93 | 5d | 1 | 1.17mi |
| 9734 Clifton Park Dr Houston, TX | 3.0 | 2.5 | 1800 | $1,774 | $0.99 | 5d | 4 | 1.18mi |
| 9850 S Kirkwood Rd Houston, TX | 1.0–2.0 | 1.0–2.0 | 736 | $1,210 | $1.64 | 19d | 15 | 1.19mi |
| 6843 Greenway Chase St Houston, TX | 3.0 | 3.0 | 1422 | $2,200 | $1.55 | 43d | 1 | 1.22mi |
| 13034 Leader St Houston, TX | 2.0 | 2.0 | 1241 | $1,400 | $1.13 | 24d | 1 | 1.24mi |
| 12506 Panther Place Dr Houston, TX | 3.0 | 2.5 | 1730 | $1,825 | $1.05 | 43d | 1 | 1.26mi |
HOA detail
- Monthly dues
- $233 · $2,796/yr
Listing history 22 events
-
2026-06-18days on market $120,000 Active 94 DOM
-
2026-06-17days on market $120,000 Active 93 DOM
-
2026-06-16days on market $120,000 Active 92 DOM
-
2026-06-15days on market $120,000 Active 91 DOM
-
2026-06-13days on market $120,000 Active 89 DOM
-
2026-06-09days on market $120,000 Active 85 DOM
-
2026-06-08days on market $120,000 Active 84 DOM
-
2026-06-07days on market $120,000 Active 83 DOM
-
2026-06-04days on market $120,000 Active 80 DOM
-
2026-06-03days on market $120,000 Active 79 DOM
-
2026-06-02days on market $120,000 Active 78 DOM
-
2026-06-01days on market $120,000 Active 77 DOM
-
2026-05-31days on market $120,000 Active 76 DOM
-
2026-05-01price $120,000 304-char remark
Show marketing remark (304 chars)
2 bedroom 2.5 bath. Great potential for first time buyers or investment home. Good size bedrooms each with bathroom. 1 bedroom has an open window to the stairs area. Recently replaced AC Unit. Small patio area in front of home great for cooking outdoors. Kitchen countertops and cabinets recently redone.
-
2026-03-16$125,000 Active 304-char remark
Show marketing remark (304 chars)
2 bedroom 2.5 bath. Great potential for first time buyers or investment home. Good size bedrooms each with bathroom. 1 bedroom has an open window to the stairs area. Recently replaced AC Unit. Small patio area in front of home great for cooking outdoors. Kitchen countertops and cabinets recently redone.
-
2026-03-05historical
-
2026-01-02price $130,000
-
2025-10-17price $140,000
-
2025-08-14$160,000 Active
-
2018-01-08soldstatus
-
2001-08-28soldstatus
-
1998-08-17soldstatus
ⓘ Source: listings_history table (triggers on properties + properties_extension) + one-shot
backfill from property_details.listing_events for pre-trigger history.
Tax reassessment forecast TX · Resets to sale price
- Current annual tax
- $3,736 · $311/mo
- Projected year-2 tax
- $3,736 · $311/mo
- Expected delta
- $0/yr ($0/mo · 0.0%)
ⓘ Screening estimate from a state-policy table — verify with the county assessor before closing.
Climate risk First Street
- Flood 5/10 Major FEMA zone A · 41% chance over 30 yrs
- Wildfire 1/10 Low
- Heat 9/10 Extreme 7 d/yr ≥110°F today · 23 d/yr by 30 yrs out
- Wind 9/10 Extreme 99% chance of damaging wind over 30 yrs
- Air quality 2/10 Low 2 unhealthy d/yr today · 2 by 30 yrs out
Nearby sold comps map
Loading sold comps map…
Walkable amenities ~0.75 mi
Loading nearby amenities…
Taxation est. · year 1
- Rental income
- $17,563
- − Mortgage interest
- −$6,722
- − Property taxes
- −$3,736
- − Insurance
- −$2,102
- − Repairs & maintenance
- −$1,405
- − Management
- −$1,405
- − HOA
- −$2,796
- − Depreciation
- −$3,491
- Taxable loss
- −$4,095
- Est. tax savings @ 24.0%
- +$983
- After-tax cash flow
- $-1,329/yr
For passive investors: Depreciation is non-cash, so a rental often shows a tax loss while cash-flowing — sheltering income. Rental losses are passive: they offset passive income freely, and up to $25,000/yr can offset ordinary (W-2) income if you actively participate and your MAGI is under $100k (phasing out to $0 by $150k); unused losses carry forward. On sale, claimed depreciation is recaptured at up to 25%, and gains may owe capital-gains tax (a 1031 exchange can defer both). Figures are a year-1 estimate at your 24.0% rate — not tax advice; consult a CPA.
Schools (NCES district)
- District
- Alief ISD
- NCES district ID
- 4807830
- Math proficiency
- 23% ▼ -19.00%
- Reading proficiency
- 28% ▼ -8.00%
- Median HH income
- $37,775
- Composite
- 21.29/100
- National rank
- #8391
- State rank
- #717 of 826 in TX
Livability — Houston
- Score
- 74/100
- State rank
- #184
- US rank
- #4771
Category grades
Schools grade is shown separately in the Schools card above.
Census & demographics
- Census place
- Houston, TX
- County
- Harris County · 4,702,590 people
- City population
- 3,226,434
- Metro
- Houston-The Woodlands-Sugar Land, TX
- Population (ZIP)
- 57,108
- Household income
- $51,070
- Rent vs Own
- Severe rent burden
- 3500.0
Population outlook (Harris County) Hauer SSP2
- Today (2025)
- 5,571,493 people
- By 2030
- 6,089,821 · +9.3%
- By 2040
- 7,142,806 · +28.2%
- By 2050
- 8,185,864 · +46.9%
- By 2075
- 10,574,329 · +89.8%
- By 2100
- 12,109,958 · +117.4%
Race, ethnicity, and origin ACS 2023
- Neighborhood character
- Diverse neighborhood (Simpson 0.68)
- Race & ethnicity
- Hispanic / Latino 45% Asian 24% Black 23% Two or more races 19% White 5% Native American 2%
- Hispanic origin (detail)
- Mexican 24% Puerto Rican 2%
- Foreign-born
- 52% · Canada, Vietnam, China
- Languages at home
- 30% English-only · Spanish 40% Vietnamese 16% Chinese 3%
Political lean MEDSL · Harris
- 2024 margin
- Lean D (+5.5) · D 52.0% · R 46.4% · Other 1.6%
- 2008→2024 swing
- +3.9pp toward D · 2008: 1.6pp · 2024: 5.5pp
- All cycles
- 2024: D+5.5 2020: D+13.3 2016: D+12.4 2012: D+0.1 2008: D+1.6
Not yet ingested
- Civics
- —
Market trends
- HPI YoY
- ▼ -130.12%
- Current HPI
- 362.1985
- Rent YoY
- ▬ 0.05%
- Metro
- Houston-The Woodlands-Sugar Land, TX
- State GDP YoY
- ▲ 3.95%
- F500 in state
- 110
Industry mix (Fortune 500 HQ in TX)
| Industry | F500 HQs | Revenue |
|---|---|---|
| Energy | 16 | $1,198B |
|
||
| Technology | 5 | $198B |
|
||
| Engineering / Construction | 4 | $72B |
|
||
| Energy Services | 3 | $60B |
|
||
| Utilities | 3 | $41B |
|
||
| Healthcare | 2 | $330B |
|
||
Price history
-25.0% since first listed9 events — show timeline
- 2026-05-01 Price Changed $120,000 HARMLS
- 2026-03-16 Listed $125,000 HARMLS
- 2026-03-05 Listing Removed — HARMLS
- 2026-01-02 Price Changed $130,000 HARMLS
- 2025-10-17 Price Changed $140,000 HARMLS
- 2025-08-14 Listed $160,000 HARMLS
- 2018-01-08 Sold (Public Records) — Public Records
- 2001-08-28 Sold (Public Records) — Public Records
- 1998-08-17 Sold (Public Records) — Public Records
Property tax history
+4.1%/yrLatest (2025): $3,736 · -2.1% YoY. Source: county tax records.
Cash-flow waterfall
monthlySold comps — $/sqft
last 12 mo · ≤1 miLoading sold comps…