13 Foothill Ct · Sunrise Beach, MO
Flood risk 1/10 · Minimal
- FEMA flood zone
- X (unshaded)
- Chance of flooding over 30 yrs
- 0.0%
- Est. flood insurance / yr
- $507 – $1,088
Fire risk 3/10 · Minor
- Est. fire insurance / yr
- $1,054 – $1,958
Heat risk 4/10 · Minor
- Hot days now (above 107°F)
- 7 days/yr
- Hot days in 30 yrs
- 19 days/yr
Wind risk 2/10 · Minimal
- Chance of severe wind over 30 yrs
- —
Air-quality risk 2/10 · Minimal
- Unhealthy air days now
- 1 days/yr
- Unhealthy air days in 30 yrs
- 1 days/yr
Risk factors via First Street. Map © Google.
Why this score? — see what drove the D grade
The composite is a weighted blend of 9 inputs, each scored 0–100. Each bar is that input's sub-score; the figure is the points it added to the 100-point composite (weight × sub-score).
- ARV discount +15.0/15.0
- Cash flow +7.6/30.0
- Schools +4.0/10.0
- Condition / age +3.8/5.0
- Livability +3.2/5.0
- Rent growth +2.5/5.0
- 1% rule +2.2/10.0
- DSCR +1.7/10.0
- Appreciation +0.0/10.0
$174,900
🖨 Deal sheet 📄 Offer letter ✓ Due diligence
Listing remarks
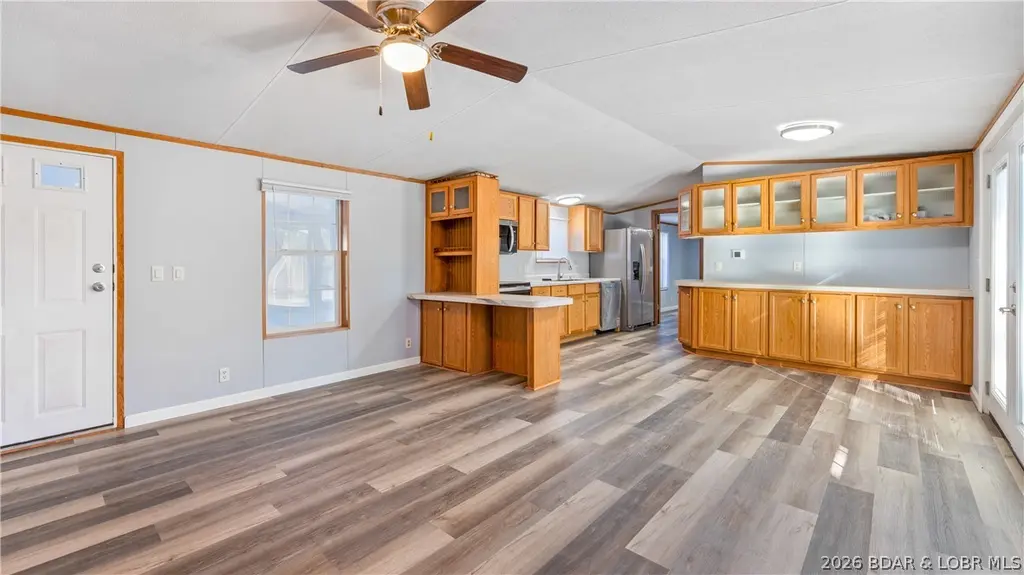
Completely refreshed and move-in ready, this beautifully remodeled 2 bedroom, 2 bathroom home offers stylish updates, practical improvements, and affordable peace of mind. Inside, you'll find a well-designed open layout with tasteful modern finishes throughout including fresh paint, updated flooring, stainless steel appliances, and sleek contemporary fixtures that create a clean, inviting feel. A convenient mud/entry room adds valuable functionality with ideal space for extra storage, pantry use, or additional appliances. Built with low-maintenance materials and thoughtfully upgraded where it counts, this home is designed to help keep future repair costs in check with a new well pump, HVAC
Key facts
- New well pump
- Open layout
- Mud entry room
Tags
Property features AI
Exterior
- Parking: Gravel parking; no garage
- Utilities: Private well water; Septic tank
- Home design: Single family detached residence; One level; Updated/remodeled
- Construction: Vinyl siding; Metal roof; Block foundation; Built on crawl space
- Exterior features: Storage; Deck; Sloped, gently sloping lot; Gravel road access
Interior
- Kitchen: Cooktop; Range; Microwave; Dishwasher; Refrigerator
- Flooring: Vinyl flooring
- Bathrooms: 2 full bathrooms
- Heating & cooling: Electric heating; Forced air; Heat pump; Central air conditioning
- Interior features: Vaulted ceilings; Accessible full bathroom
- Laundry & utility: Washer hookup; Washer; Dryer
Neighborhood map
What this means for you Summary
Snapshot
- This is a 2-bed/2.0-bath single-family listed at $175k. Condition is rated good.
Deal economics
- At list price, monthly cash flow is $-207 ($-2k/yr) — negative.
- To cash-flow at today's rent, offer at most $145k (17.1% below list).
- To meet the 1% rule (rent ≥ 1% of price), the offer needs to be $127k (27.5% below list).
- Recommended offer: $127k (27.5% below list) — sets the bar for 1% rule.
- Cap rate 4.9% vs local median 0.9% in Sunrise Beach — top-decile yield for the area; either an underpriced asset or a hidden risk that comps aren't pricing in. Stress-test before assuming the spread holds.
Location & tenants
- Location reads 65/100 on livability (#280 in MO) — a middle-class / working-renter tenant base. Strengths: crime A+, cost of living A+, housing A+; Watch: schools D+, amenities F, commute F.
- Camdenton R-III (rural): math 46% / reading 48% proficiency, ranked #68 of 324 in MO (top 21%) — families likely to look elsewhere, expect single-tenant / working-renter base with shorter leases.
- Market conditions: 416 active listings in the ZIP; 272 units permitted in Camden County in 2024 (0 in 5+ unit buildings).
Forward outlook
- Local home prices are declining (-3.0%/yr); year-one equity from $1k of loan paydown is wiped out by about $5k of value loss. Plan a longer hold.
- Camden County population projected to shrink 6% by 2050 — rents likely to lag national; underwrite the cash flow, not the appreciation.
Negotiation context
- It's been on market 45 days — a 3% lower offer ($170k) is reasonable based on typical stale-listing flexibility.
- 2 sale attempts with the ask held roughly flat each time — persistent listings suggest the price (not the market) is what's stuck; bring a comps-based counter.
Questions for the listing agent
- What do current leases actually rent for vs. the listed asking? Can we see a recent rent roll and the last 12 months of T-12 income?
- It's been on market 45 days. Have you received any prior offers? Is the seller open to a 28% concession, seller financing, or rate buy-down credit?
- Is there a deadline driving the sale (1031 exchange, divorce, estate, relocation)? That informs how much negotiation room exists.
- Schools are D-rated, which usually means shorter tenancies and higher turnover. Who's the typical renter profile here, and what's been the actual vacancy rate?
- The area grade is low — what's the realistic commute time and amenity access for the typical tenant pool here? Any planned neighborhood developments (good or bad) we should know about?
- What's the average days-on-market for RENTAL listings here right now (not sales)? A rising rental-DOM trend means longer vacancies and softer asking-rent achievability than the comps imply.
- What's the recent tenant-quality profile in this submarket — average credit score on applications, eviction rate, late-payment / NSF rate, and stable-employment percentage? A property-management company in the area should have these aggregated.
- How much new for-sale + rental construction is in the pipeline within 1–3 miles? Heavy new supply typically softens prices + rents 12–24 months out; constrained supply supports both.
Investment metrics
- 1% rule
- 0.72% ✗
- Cap rate
- 4.87%
- Cash-on-cash
- -5.08%
- DSCR
- 0.77
- GRM
- 11.5
CMA / ARV
- ARV (median comp)
- $318,233
- List price
- $174,900
- Delta
- -45.04%
- Verdict
- UNDERPRICED
- Comps
- 2 within 2.0 mi
Projected returns pro-forma
-3.0% appreciation · 3.0% rent growth · sell at horizon
- IRR
- -24.9%
- Equity multiple
- 0.15×
- Total profit
- $-41,522
- Equity at exit
- $26,078
- IRR
- -20.7%
- Equity multiple
- -0.08×
- Total profit
- $-53,076
- Equity at exit
- $15,122
Cash invested: $48,972 (down + closing). Projections, not guarantees.
Landlord ↔ Tenant lean methodology
- Overall (STATE)
- 81 Strongly Landlord-Friendly
- State Missouri
- 81 Strongly Landlord-Friendly · R+10
- County
- — inherits STATE
- City
- — inherits STATE
ZIP-level market 65020
- Home prices YoY
- -32.9%
- Active inventory
- 416
- Price-to-rent
- 11.5×
Monthly cashflow live
- Estimated rent
- $1,268 medium interval (Pro) →
- Mortgage (P&I)
- −$917
- Tax est. 1.5%
- −$219 /mo · $2,624/yr
- Insurance
- −$73
- HOA
- −$0
- Vacancy / Maint / Mgmt
- −$266
- Net cashflow
- $-207
Break-even live
UW: 25.0% down · 7.5% · 30yr · 1.5% tax · 5.0% vac · 8.0% maint · 8.0% mgmt
Financing live
Cash to close
- Down payment
- $43,725
- Closing costs
- $5,247
- Reserves months
- —
- Total cash needed
- —
Loan-product check · same deal, 3 products live
Conventional
25% down · 7.5% · 30yr
- Down + closing
- —
- Monthly P&I
- —
- Monthly cashflow
- —
- DSCR
- —
- Eligible?
- —
Personal DTI + credit; lowest rate.
DSCR
20% down · 8.5% · 30yr
- Down + closing
- —
- Monthly P&I
- —
- Monthly cashflow
- —
- DSCR
- —
- Eligible?
- —
No personal income docs; deal must DSCR.
Hard money
10% down · 12.0% · 12mo
- Down + closing
- —
- Monthly P&I
- —
- Monthly cashflow
- —
- DSCR
- —
- Eligible?
- —
Short-term bridge; refi at stabilization.
Listing history 19 events
-
2026-06-19days on market $174,900 Active 45 DOM
-
2026-06-18days on market $174,900 Active 44 DOM
-
2026-06-17days on market $174,900 Active 43 DOM
-
2026-06-16days on market $174,900 Active 42 DOM
-
2026-06-15days on market $174,900 Active 41 DOM
-
2026-06-14days on market $174,900 Active 39 DOM
-
2026-06-12days on market $174,900 Active 38 DOM
-
2026-06-09days on market $174,900 Active 35 DOM
-
2026-06-09status $174,900 Active 34 DOM
-
2026-06-08days on market $174,900 Active Under Contract 34 DOM
-
2026-06-07days on market $174,900 Active Under Contract 33 DOM
-
2026-06-05days on market $174,900 Active Under Contract 30 DOM
-
2026-06-03days on market $174,900 Active Under Contract 29 DOM
-
2026-06-03status $174,900 Active Under Contract 28 DOM
-
2026-06-02days on market $174,900 Active 28 DOM
-
2026-06-01days on market $174,900 Active 27 DOM
-
2026-05-31days on market $174,900 Active 26 DOM
-
2026-05-30days on market $174,900 Active 25 DOM
-
2026-05-05$174,900 Active 1073-char remark
ⓘ Source: listings_history table (triggers on properties + properties_extension) + one-shot
backfill from property_details.listing_events for pre-trigger history.
Climate risk First Street
- Flood 1/10 Low FEMA zone X (unshaded) · 0% chance over 30 yrs
- Wildfire 3/10 Moderate
- Heat 4/10 Moderate 7 d/yr ≥107°F today · 19 d/yr by 30 yrs out
- Wind 2/10 Low
- Air quality 2/10 Low 1 unhealthy d/yr today · 1 by 30 yrs out
Nearby sold comps map
Loading sold comps map…
Walkable amenities ~0.75 mi
Loading nearby amenities…
Taxation est. · year 1
- Rental income
- $15,212
- − Mortgage interest
- −$9,797
- − Property taxes
- −$2,624
- − Insurance
- −$874
- − Repairs & maintenance
- −$1,217
- − Management
- −$1,217
- − Depreciation
- −$5,088
- Taxable loss
- −$5,605
- Est. tax savings @ 24.0%
- +$1,345
- After-tax cash flow
- $-1,142/yr
For passive investors: Depreciation is non-cash, so a rental often shows a tax loss while cash-flowing — sheltering income. Rental losses are passive: they offset passive income freely, and up to $25,000/yr can offset ordinary (W-2) income if you actively participate and your MAGI is under $100k (phasing out to $0 by $150k); unused losses carry forward. On sale, claimed depreciation is recaptured at up to 25%, and gains may owe capital-gains tax (a 1031 exchange can defer both). Figures are a year-1 estimate at your 24.0% rate — not tax advice; consult a CPA.
Condition & rehab AI · 25 photos
This move-in ready home offers stylish updates and practical improvements, making it an attractive option for both resale and rental markets.
Value-add opportunities
- Both landscaping — improves curb appeal and enhances property value
- Both upgraded lighting — enhances safety and aesthetics
- Both smart home integration — increases property value and convenience
Renovation cost estimate screening
Value-add ROI direction
- Both landscaping — improves curb appeal and enhances property value ↑
- Both upgraded lighting — enhances safety and aesthetics ↑
- Both smart home integration — increases property value and convenience ↑
ⓘ Cost ranges are severity-bucket heuristics (US national rule-of-thumb). Get contractor quotes + a written scope before underwriting a rehab budget.
Schools (NCES district)
- District
- Camdenton R-III
- NCES district ID
- 2906990
- Math proficiency
- 46% ▲ 10.00%
- Reading proficiency
- 48% ▲ 1.00%
- Median HH income
- $46,496
- Composite
- 39.96/100
- National rank
- #3838
- State rank
- #68 of 324 in MO
Livability — Sunrise Beach
- Score
- 65/100
- State rank
- #280
- US rank
- #13077
Category grades
Schools grade is shown separately in the Schools card above.
Census & demographics
- County
- Camden County · 21,945 people
- Metro
- nan
- Population (ZIP)
- 14,748
- Household income
- $62,392
- Rent vs Own
- Severe rent burden
- 166.0
Population outlook (Camden County) Hauer SSP2
- Today (2025)
- 44,585 people
- By 2030
- 44,476 · -0.2%
- By 2040
- 43,513 · -2.4%
- By 2050
- 41,705 · -6.5%
- By 2075
- 36,903 · -17.2%
- By 2100
- 30,164 · -32.3%
Race, ethnicity, and origin ACS 2023
- Neighborhood character
- Predominantly White (90%)
- Race & ethnicity
- White 90% Hispanic / Latino 5% Two or more races 4%
- Hispanic origin (detail)
- Mexican 3%
- Common ancestry
- Lithuanian 4% Slovak 2% Romanian 2%
- Foreign-born
- 2% · Canada
- Languages at home
- 95% English-only · Spanish 2% German/W. Germanic 1% Russian/Polish/Slavic 1%
Political lean MEDSL · Camden
- 2024 margin
- Solid R (+54.3) · D 22.4% · R 76.7%
- 2008→2024 swing
- -25.8pp toward R · 2008: -28.5pp · 2024: -54.3pp
- All cycles
- 2024: R+54.3 2020: R+53.2 2016: R+54.2 2012: R+39.3 2008: R+28.5
Not yet ingested
- Civics
- —
Market trends
- HPI YoY
- ▼ -90.71%
- Current HPI
- 185.4254
- Rent YoY
- —
- Metro
- nan
- State GDP YoY
- ▲ 1.84%
- F500 in state
- 20
Industry mix (Fortune 500 HQ in MO)
| Industry | F500 HQs | Revenue |
|---|---|---|
| Healthcare | 1 | $163B |
|
||
| Insurance | 1 | $21B |
|
||
| Industrial Technology | 1 | $17B |
|
||
| Retail | 1 | $16B |
|
||
| Industrial Distribution | 1 | $10B |
|
||
| Utilities | 1 | $9B |
|
||
Price history
3 events — show timeline
- 2026-06-08 Relisted — LOBR
- 2026-06-02 Contingent — LOBR
- 2026-05-05 Listed $174,900 LOBR
Cash-flow waterfall
monthlySold comps — $/sqft
last 12 mo · ≤1 miLoading sold comps…