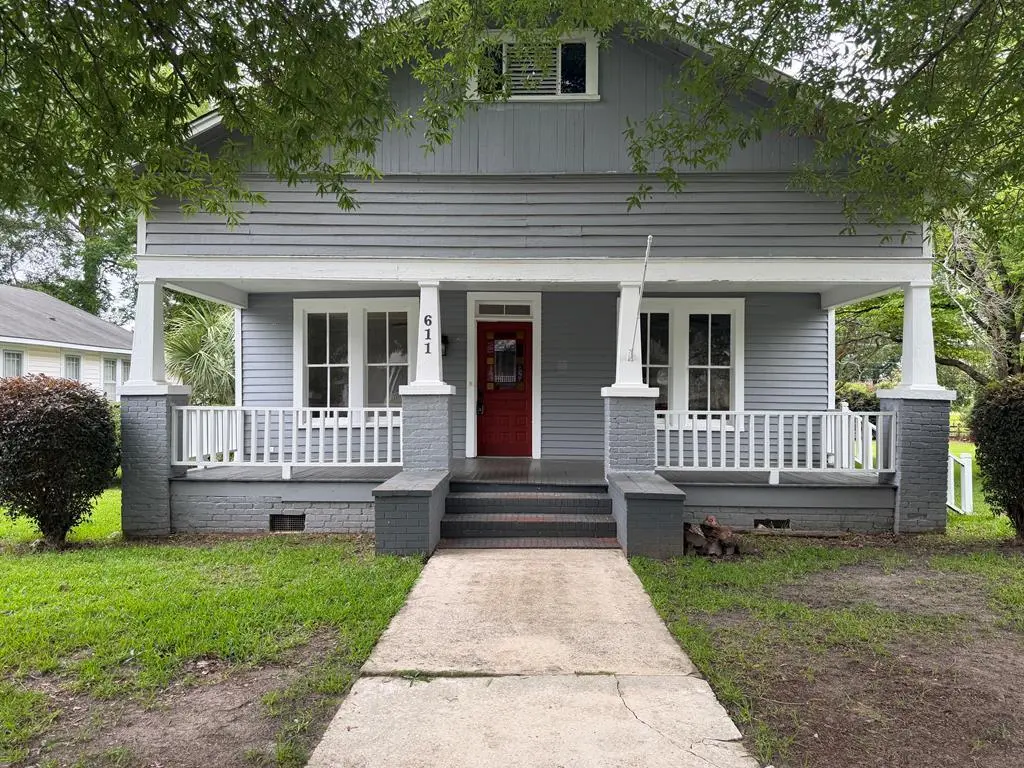
611 Park Ave Ave N · Tifton, GA
Flood risk 1/10 · Minimal
- FEMA flood zone
- X (unshaded)
- Chance of flooding over 30 yrs
- 0.0%
- Est. flood insurance / yr
- $507 – $1,088
Fire risk 3/10 · Minor
- Est. fire insurance / yr
- $963 – $1,789
Heat risk 8/10 · Major
- Hot days now (above 108°F)
- 7 days/yr
- Hot days in 30 yrs
- 19 days/yr
Wind risk 8/10 · Major
- Chance of severe wind over 30 yrs
- 98.0%
Air-quality risk 3/10 · Minor
- Unhealthy air days now
- 3 days/yr
- Unhealthy air days in 30 yrs
- 3 days/yr
Risk factors via First Street. Map © Google.
Why this score? — see what drove the D+ grade
The composite is a weighted blend of 9 inputs, each scored 0–100. Each bar is that input's sub-score; the figure is the points it added to the 100-point composite (weight × sub-score).
- Cash flow +16.9/30.0
- ARV discount +9.5/15.0
- DSCR +5.3/10.0
- 1% rule +3.8/10.0
- Livability +3.6/5.0
- Rent growth +2.5/5.0
- Schools +2.5/10.0
- Condition / age +2.5/5.0
- Appreciation +0.0/10.0
$219,900
🖨 Deal sheet (PDF) 📄 Offer letter ✓ Due diligence
Listing remarks
Step into the charm of a bygone era with this beautifully maintained historic bungalow in the heart of Tifton. Featuring 3 spacious bedrooms and 3 full bathrooms, this character-filled home blends timeless appeal with modern convenience. Gorgeous hardwood floors flow throughout, while the large updated kitchen offers plenty of space for cooking, gathering, and entertaining. The versatile floor plan makes this property an excellent choice for both owner-occupants and investors alike. With three full baths and a functional layout, it's especially well-suited for students seeking an attractive off-campus housing option. Situated on a pretty in-town lot, you'll enjoy the convenience of being ju
Key facts
- Historic bungalow
- Pretty in-town lot
- Hardwood floors
Tags
Property features AI
Finance
- Other: Lot approximately 0.23 acres
- Financial info: Not specified
- HOA & community: Not specified
Exterior
- Parking: Not specified
- Security: Not specified
- Utilities: Public water; Public sewer
- Home design: Single-family residence (residential property)
- Construction: Frame construction with wood siding; Shingle roof
- Exterior features: Front porch; Shed(s)
Interior
- Kitchen: Dishwasher; Electric range; Microwave; Refrigerator
- Bedrooms: Not specified
- Flooring: Hardwood; Wood
- Bathrooms: 3 full bathrooms
- Heating & cooling: Central heating (electric); Central air; Ceiling fans
- Interior features: Window coverings; Hardwood/wood flooring; 7 total rooms
- Laundry & utility: Gas water heater
Neighborhood map
What this means for you Summary
Snapshot
- This is a 3-bed/3.0-bath single-family listed at $220k.
Deal economics
- At list price, monthly cash flow is $147 ($2k/yr) — positive.
- The deal already cash-flows at list — no discount required.
- To meet the 1% rule (rent ≥ 1% of price), the offer needs to be $194k (11.8% below list).
- Recommended offer: $194k (11.8% below list) — sets the bar for 1% rule.
- Cap rate 7.1% vs local median 3.3% in Tifton — top-decile yield for the area; either an underpriced asset or a hidden risk that comps aren't pricing in. Stress-test before assuming the spread holds.
Location & tenants
- Location reads 72/100 on livability (#69 in GA) — a middle-class / working-renter tenant base. Strengths: cost of living A+, health & safety A+; Watch: crime D, commute F, employment D-.
- Tift County (town): math 30% / reading 31% proficiency, ranked #96 of 174 in GA (top 55%) — families likely to look elsewhere, expect single-tenant / working-renter base with shorter leases; 62% free/reduced lunch — lower-income household profile, screen leases tightly.
- Zoned schools: Len Lastinger Elementary School (math 52% / reading 42%, grade D-, #301 of 1,228 statewide, top 25%, 466 students, 100% FRL); Eighth Street Middle School (math 19% / reading 26%, grade F, #327 of 470 statewide, top 70%, 958 students, 100% FRL); Tift County High School (math 14% / reading 26%, grade F, #232 of 424 statewide, top 56%, 2,273 students, 100% FRL) — zoned schools average 100% FRL vs 62% district-wide (38 pts higher); higher-poverty schools than district average — tighter screening recommended.
- Market conditions: 139 active listings in the ZIP; 2 comparable units currently listed for rent nearby; 176 units permitted in Tift County in 2024 (60 in 5+ unit buildings).
- At $1,940/mo this rent would consume 51% of the median local household income ($46k/yr) (locally 759% of renters already pay >50% of income on rent) — very limited rent-growth headroom before tenants either downsize or default.
Forward outlook
- Local home prices are declining (-3.0%/yr); year-one equity from $2k of loan paydown is wiped out by about $7k of value loss. Plan a longer hold.
- Tift County population projected to shrink 3% by 2050 — rents likely to lag national; underwrite the cash flow, not the appreciation.
Negotiation context
- It's been on market 20 days — a 2% lower offer ($217k) is reasonable based on typical stale-listing flexibility.
- Current owner paid $90k; list at $220k implies a 144% gain — meaningful room to come down on a strong offer.
Risks & watch-outs
- Watch-outs: built in 1925 — expect roof / HVAC / electrical / plumbing capex.
- Climate carrying-cost: severe wind risk, 98% chance of damaging wind over 30y; extreme-heat days projected 7→19/yr by 2055 (HVAC capex compounding) — expect insurance premiums to compound above CPI over the hold.
Questions for the listing agent
- Built in 1925 — when were the roof, HVAC, electrical panel, plumbing, and water heater last replaced?
- Is there a deadline driving the sale (1031 exchange, divorce, estate, relocation)? That informs how much negotiation room exists.
- Schools are D-rated, which usually means shorter tenancies and higher turnover. Who's the typical renter profile here, and what's been the actual vacancy rate?
- Crime grade is D in this area — have there been break-ins, vandalism, or insurance claims at this property in the last 3 years? What carrier currently insures it and at what premium?
- The area grade is low — what's the realistic commute time and amenity access for the typical tenant pool here? Any planned neighborhood developments (good or bad) we should know about?
- What's the average days-on-market for RENTAL listings here right now (not sales)? A rising rental-DOM trend means longer vacancies and softer asking-rent achievability than the comps imply.
- What's the recent tenant-quality profile in this submarket — average credit score on applications, eviction rate, late-payment / NSF rate, and stable-employment percentage? A property-management company in the area should have these aggregated.
- How much new for-sale + rental construction is in the pipeline within 1–3 miles? Heavy new supply typically softens prices + rents 12–24 months out; constrained supply supports both.
Investment metrics
- 1% rule
- 0.88% ✗
- Cap rate
- 7.09%
- Cash-on-cash
- 2.86%
- DSCR
- 1.13
- GRM
- 9.4
CMA / ARV
- ARV (on-the-fly)
- $230,272
- Comps found
- 12
Show comp detail 12 sales within ~0.75 mi
| Address | Dist | Beds/Ba | Sqft | Sold | Price | $/sf | Match |
|---|---|---|---|---|---|---|---|
| 821 Murray Ave | 0.41mi | 3/2.0 | 1,775 (-1%) | 6mo | $155,000 | $87 | 70 |
| 810 Davis Ave | 0.54mi | 3/2.0 | 1,800 (+0%) | 2mo | $145,000 | $81 | 69 |
| 618 Tift Ave Ave N | 0.25mi | 4/2.0 (+1) | 1,899 (+6%) | 4mo | $242,500 | $128 | 66 |
| 601 W 8th St | 0.42mi | 3/2.0 | 1,708 (-5%) | 7mo | $152,000 | $89 | 62 |
| 378 Ellen's Walk | 0.47mi | 4/3.0 (+1) | 1,971 (+10%) | 1mo | $400,000 | $203 | 56 |
| 403 N Ridge Ave | 0.18mi | 4/1.5 (+1) | 1,924 (+7%) | 16mo | $151,500 | $79 | 56 |
| 809 Penn Pl | 0.61mi | 3/2.0 | 1,790 (-0%) | 16mo | $185,000 | $103 | 54 |
| 803 Forrest Ave | 0.46mi | 3/2.0 | 2,020 (+12%) | 4mo | $264,500 | $131 | 50 |
| 420 Prince Ave | 0.45mi | 3/1.5 | 1,608 (-11%) | 10mo | $48,000 | $30 | 47 |
| 1209 Central Ave Ave N | 0.40mi | 2/2.0 (-1) | 1,536 (-15%) | 2mo | $215,000 | $140 | 46 |
| 1009 Forrest Ave | 0.61mi | 3/2.0 | 1,656 (-8%) | 14mo | $299,000 | $181 | 43 |
| 371 Ellen's Walk | 0.47mi | 4/3.0 (+1) | 2,030 (+13%) | 12mo | $394,700 | $194 | 42 |
Match score weights: distance 35% · size 25% · config 20% · recency 20%. Top-matched comps best support the ARV.
Projected returns pro-forma
-3.0% appreciation · 3.0% rent growth · sell at horizon
- IRR
- -11.8%
- Equity multiple
- 0.57×
- Total profit
- $-26,331
- Equity at exit
- $32,788
- IRR
- -2.7%
- Equity multiple
- 0.82×
- Total profit
- $-11,099
- Equity at exit
- $19,013
Cash invested: $61,572 (down + closing). Projections, not guarantees.
Landlord ↔ Tenant lean methodology
- Overall (STATE)
- 90 Strongly Landlord-Friendly
- State Georgia
- 90 Strongly Landlord-Friendly · R+3
- County
- — inherits STATE
- City
- — inherits STATE
ZIP-level market 31794
- Home prices YoY
- -32.1%
- Active inventory
- 139
- Price-to-rent
- 9.4×
Monthly cashflow live
- Estimated rent
- $1,940 medium interval (Pro) →
- Mortgage (P&I)
- −$1,153
- Tax from tax record
- −$141 /mo · $1,688/yr
- Insurance
- −$92
- HOA
- −$0
- Vacancy / Maint / Mgmt
- −$407
- Net cashflow
- $147
Break-even live
Sensitivity live
| Price | -10% $271 | -5% $209 | +0% $147 | +5% $85 | +10% $22 |
|---|---|---|---|---|---|
| Rent | -10% $-6 | -5% $70 | +0% $147 | +5% $224 | +10% $300 |
| Rate | -1.0pp $258 | -0.5pp $203 | base $147 | +0.5pp $90 | +1.0pp $32 |
UW: 25.0% down · 7.5% · 30yr · 1.5% tax · 5.0% vac · 8.0% maint · 8.0% mgmt
Financing live
Cash to close
- Down payment
- $54,975
- Closing costs
- $6,597
- Reserves months
- —
- Total cash needed
- —
Loan-product check · same deal, 3 products live
Conventional
25% down · 7.5% · 30yr
- Down + closing
- —
- Monthly P&I
- —
- Monthly cashflow
- —
- DSCR
- —
- Eligible?
- —
Personal DTI + credit; lowest rate.
DSCR
20% down · 8.5% · 30yr
- Down + closing
- —
- Monthly P&I
- —
- Monthly cashflow
- —
- DSCR
- —
- Eligible?
- —
No personal income docs; deal must DSCR.
Hard money
10% down · 12.0% · 12mo
- Down + closing
- —
- Monthly P&I
- —
- Monthly cashflow
- —
- DSCR
- —
- Eligible?
- —
Short-term bridge; refi at stabilization.
Rent comps 2 comps
| Address | Beds | Baths | Sqft | Rent | $/sqft | DOM | Units | Dist |
|---|---|---|---|---|---|---|---|---|
| 1610 Ridge Ave N Tifton, GA | 3.0 | 3.0 | 1590 | $1,905 | $1.20 | 45d | 1 | 0.61mi |
| 2013 Lee Ave Tifton, GA | 3.0 | 2.0 | 1337 | $3,295 | $2.46 | 45d | 1 | 1.40mi |
Listing history 15 events
-
2026-06-22days on market $219,900 Active 20 DOM
-
2026-06-21days on market $219,900 Active 19 DOM
-
2026-06-19days on market $219,900 Active 17 DOM
-
2026-06-18days on market $219,900 Active 16 DOM
-
2026-06-17days on market $219,900 Active 15 DOM
-
2026-06-16days on market $219,900 Active 14 DOM
-
2026-06-15days on market $219,900 Active 13 DOM
-
2026-06-14days on market $219,900 Active 11 DOM
-
2026-06-12days on market $219,900 Active 10 DOM
-
2026-06-09days on market $219,900 Active 7 DOM
-
2026-06-08days on market $219,900 Active 6 DOM
-
2026-06-07days on market $219,900 Active 5 DOM
-
2026-06-07days on market $219,900 Active 4 DOM
-
2026-06-03remarks 699-char remark
-
2026-06-03$219,900 Active 1 DOM
ⓘ Source: listings_history table (triggers on properties + properties_extension) + one-shot
backfill from property_details.listing_events for pre-trigger history.
Tax reassessment forecast GA · Resets to sale price
- Current annual tax
- $1,688 · $141/mo
- Projected year-2 tax
- $2,023 · $169/mo
- Expected delta
- +$335/yr (+$28/mo · 19.9%)
ⓘ Screening estimate from a state-policy table — verify with the county assessor before closing.
Climate risk First Street
- Flood 1/10 Low FEMA zone X (unshaded) · 0% chance over 30 yrs
- Wildfire 3/10 Moderate
- Heat 8/10 Severe 7 d/yr ≥108°F today · 19 d/yr by 30 yrs out
- Wind 8/10 Severe 98% chance of damaging wind over 30 yrs
- Air quality 3/10 Moderate 3 unhealthy d/yr today · 3 by 30 yrs out
Nearby sold comps map
Loading sold comps map…
Walkable amenities ~0.75 mi
Loading nearby amenities…
Taxation est. · year 1
- Rental income
- $23,276
- − Mortgage interest
- −$12,318
- − Property taxes
- −$1,688
- − Insurance
- −$1,100
- − Repairs & maintenance
- −$1,862
- − Management
- −$1,862
- − Depreciation
- −$6,397
- Taxable loss
- −$1,950
- Est. tax savings @ 24.0%
- +$468
- After-tax cash flow
- $2,231/yr
For passive investors: Depreciation is non-cash, so a rental often shows a tax loss while cash-flowing — sheltering income. Rental losses are passive: they offset passive income freely, and up to $25,000/yr can offset ordinary (W-2) income if you actively participate and your MAGI is under $100k (phasing out to $0 by $150k); unused losses carry forward. On sale, claimed depreciation is recaptured at up to 25%, and gains may owe capital-gains tax (a 1031 exchange can defer both). Figures are a year-1 estimate at your 24.0% rate — not tax advice; consult a CPA.
Schools (NCES district)
- District
- Tift County
- NCES district ID
- 1304980
- Math proficiency
- 30% ▼ -5.00%
- Reading proficiency
- 31% ▼ -5.00%
- Median HH income
- $37,497
- Composite
- 25.42/100
- National rank
- #7454
- State rank
- #96 of 174 in GA
Livability — Tifton
- Score
- 72/100
- State rank
- #69
- US rank
- #6288
Category grades
Schools grade is shown separately in the Schools card above.
Census & demographics
- Census place
- Tifton, GA
- County
- Tift County · 26,178 people
- City population
- 26,178
- Metro
- Tifton, GA
- Population (ZIP)
- 26,178
- Household income
- $46,056
- Rent vs Own
- Severe rent burden
- 759.0
Population outlook (Tift County) Hauer SSP2
- Today (2025)
- 41,250 people
- By 2030
- 41,146 · -0.3%
- By 2040
- 40,677 · -1.4%
- By 2050
- 39,930 · -3.2%
- By 2075
- 37,078 · -10.1%
- By 2100
- 32,742 · -20.6%
Race, ethnicity, and origin ACS 2023
- Neighborhood character
- Diverse neighborhood (Simpson 0.64)
- Race & ethnicity
- White 46% Black 37% Hispanic / Latino 12% Two or more races 9% Asian 1%
- Hispanic origin (detail)
- Mexican 9%
- Common ancestry
- Slovak 1% Serbian 1% Hispanic 1%
- Foreign-born
- 4% · Canada
- Languages at home
- 89% English-only · Spanish 10% Other Asian/Pacific 0%
Political lean MEDSL · Tift
- 2024 margin
- Solid R (+35.7) · D 32.0% · R 67.7%
- 2008→2024 swing
- -2.8pp toward R · 2008: -32.8pp · 2024: -35.7pp
- All cycles
- 2024: R+35.7 2020: R+33.6 2016: R+37.4 2012: R+32.6 2008: R+32.8
Not yet ingested
- Civics
- —
Market trends
- HPI YoY
- ▼ -82.93%
- Current HPI
- 175.5649
- Rent YoY
- —
- Metro
- Tifton, GA
- State GDP YoY
- ▲ 2.66%
- F500 in state
- 28
Industry mix (Fortune 500 HQ in GA)
| Industry | F500 HQs | Revenue |
|---|---|---|
| Paper / Packaging | 2 | $29B |
|
||
| Retail | 1 | $160B |
|
||
| Transportation / Logistics | 1 | $91B |
|
||
| Airlines | 1 | $62B |
|
||
| Consumer Goods | 1 | $47B |
|
||
| Utilities | 1 | $25B |
|
||
Price history
+144.3% since first listed2 events — show timeline
- 2026-06-03 Listed $219,900 TBOR
- 2018-05-15 Sold (Public Records) $90,000 Public Records
Property tax history
+5.1%/yrLatest (2025): $1,688 · -5.9% YoY. Source: county tax records.
Cash-flow waterfall
monthlySold comps — $/sqft
last 12 mo · ≤1 miLoading sold comps…