 🏗️ New Construction
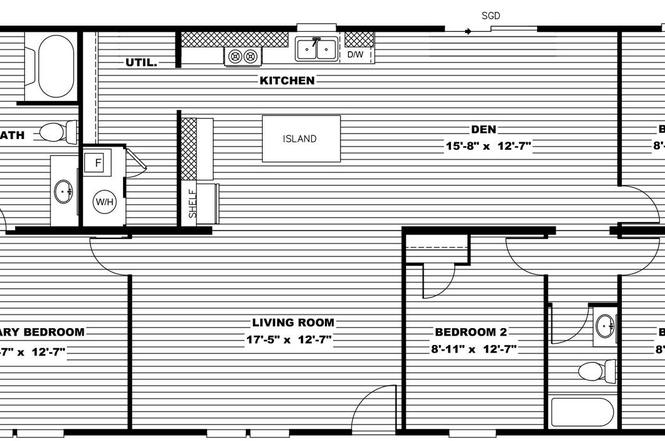
The Seafoam Plan · North Merritt Island, FL
Flood risk 9/10 · Severe
- FEMA flood zone
- X (shaded)
- Chance of flooding over 30 yrs
- 0.99%
- Est. flood insurance / yr
- $507 – $1,088
Fire risk 3/10 · Minor
- Est. fire insurance / yr
- $947 – $1,759
Heat risk 10/10 · Severe
- Hot days now (above 105°F)
- 7 days/yr
- Hot days in 30 yrs
- 23 days/yr
Wind risk 10/10 · Severe
- Chance of severe wind over 30 yrs
- 99.0%
Air-quality risk 2/10 · Minimal
- Unhealthy air days now
- 1 days/yr
- Unhealthy air days in 30 yrs
- 1 days/yr
Risk factors via First Street. Map © Google.
Why this score? — see what drove the B grade
The composite is a weighted blend of 9 inputs, each scored 0–100. Each bar is that input's sub-score; the figure is the points it added to the 100-point composite (weight × sub-score).
- Cash flow +30.0/30.0
- 1% rule +10.0/10.0
- DSCR +10.0/10.0
- ARV discount +7.5/15.0
- Schools +4.7/10.0
- Rent growth +4.1/5.0
- Livability +2.5/5.0
- Condition / age +2.5/5.0
- Appreciation +0.0/10.0
$114,900
🖨 Deal sheet 📄 Offer letter ✓ Due diligence
Listing remarks
Nestled near Florida's stunning coastline, Colony in Merritt Island offers the perfect blend of friendly community living and thrilling outdoor adventures. This all-age, pet-friendly neighborhood is a haven for those seeking a welcoming atmosphere with the convenience of coastal living. At Colony Park, you're just minutes away from pristine beaches, lush nature preserves, and the shimmering waters of the Indian and Banana Rivers. Whether you're into kayaking, paddleboarding, fishing, or simply soaking up the sun, outdoor enthusiasts will feel right at home. Our community fosters connections through shared spaces, local events, and a welcoming spirit that makes everyone feel like family. Whe
Key facts
- Pristine beaches
- Listed 316 days
Tags
Property features AI
Finance
- Financial info: List price $114,900
Exterior
- Home design: Single-family plan home; Located in Merritt Island, FL
Interior
- Bedrooms: 4 bedrooms
- Bathrooms: 2 bathrooms (full)
- Interior features: Plan home (The Seafoam)
Neighborhood map
What this means for you Summary
Snapshot
- This is a 4-bed/2.0-bath single-family listed at $115k.
Deal economics
- At list price, monthly cash flow is $1k ($18k/yr) — positive.
- The deal already cash-flows at list — no discount required.
- Meets the 1% rule at list price ($3k rent vs $115k).
- Recommended offer: $101k (12.0% below list) — sets the bar for market timing.
Location & tenants
- Location reads: area grade B — affects rentability + tenant quality, not the cash-flow math above.
- Brevard (suburban): math 53% / reading 57% proficiency, ranked #19 of 73 in FL (top 26%) — acceptable for families but not a draw, mixed tenant base, ~2y average lease.
- Market conditions: Rents rising fast (+6.5%/yr); 227 active listings in the ZIP; 2 comparable units currently listed for rent nearby; solid renter incomes; 4,602 units permitted in Brevard County in 2024 (702 in 5+ unit buildings).
- This rent runs 34% of the median local income ($103k/yr) — at the standard rent-burdened threshold; future hikes will face affordability resistance.
Forward outlook
- Local home prices are declining (-3.0%/yr); year-one equity from $794 of loan paydown is wiped out by about $3k of value loss. Plan a longer hold.
- Brevard County population projected at +15% by 2050 — modest demand growth; plan on rents tracking national, not racing it.
- At projected returns (-3.0% appreciation + 6.5% rent growth), your $32k cash investment doubles in ~3 years — after that, you're playing with house money.
Negotiation context
- It's been on market 316 days — a 12% lower offer ($101k) is reasonable based on typical stale-listing flexibility.
Risks & watch-outs
- Watch-outs: flood insurance adds $66/mo.
- Climate carrying-cost: severe flood risk; severe wind risk, 99% chance of damaging wind over 30y; extreme-heat days projected 7→23/yr by 2055 (HVAC capex compounding) — expect insurance premiums to compound above CPI over the hold.
Questions for the listing agent
- It's been on market 316 days. Have you received any prior offers? Is the seller open to a 12% concession, seller financing, or rate buy-down credit?
- What's the actual annual flood-insurance premium (NFIP or private), and is the property in a SFHA with mandatory coverage?
- Why hasn't it sold? Are there any deal-killer items the seller is aware of (foundation, flood, title, zoning, code violations)?
- Is there a deadline driving the sale (1031 exchange, divorce, estate, relocation)? That informs how much negotiation room exists.
- What's the average days-on-market for RENTAL listings here right now (not sales)? A rising rental-DOM trend means longer vacancies and softer asking-rent achievability than the comps imply.
- What's the recent tenant-quality profile in this submarket — average credit score on applications, eviction rate, late-payment / NSF rate, and stable-employment percentage? A property-management company in the area should have these aggregated.
- How much new for-sale + rental construction is in the pipeline within 1–3 miles? Heavy new supply typically softens prices + rents 12–24 months out; constrained supply supports both.
Investment metrics
- 1% rule
- 2.56% ✓
- Cap rate
- 22.25%
- Cash-on-cash
- 56.98%
- DSCR
- 3.54
- GRM
- 3.3
CMA / ARV
No comps found within radius.
Projected returns pro-forma
-3.0% appreciation · 6.53% rent growth · sell at horizon
- IRR
- 56.8%
- Equity multiple
- 3.65×
- Total profit
- $85,332
- Equity at exit
- $17,132
- IRR
- 63.1%
- Equity multiple
- 8.53×
- Total profit
- $242,170
- Equity at exit
- $9,934
Cash invested: $32,172 (down + closing). Projections, not guarantees.
Landlord ↔ Tenant lean methodology
- Overall (STATE)
- 87 Strongly Landlord-Friendly
- State Florida
- 87 Strongly Landlord-Friendly · R+3
- County
- — inherits STATE
- City
- — inherits STATE
ZIP-level market 32952
- Rents YoY
- 6.5%
- Active inventory
- 227
- Price-to-rent
- 3.3×
Monthly cashflow live
- Estimated rent
- $2,939 medium interval (Pro) →
- Mortgage (P&I)
- −$603
- Tax est. 1.5%
- −$144 /mo · $1,724/yr
- Insurance
- −$48
- Flood insurance flood zone
- −$66 /mo · $798/yr
- HOA
- −$0
- Vacancy / Maint / Mgmt
- −$617
- Net cashflow
- $1,461
Break-even live
UW: 25.0% down · 7.5% · 30yr · 1.5% tax · 5.0% vac · 8.0% maint · 8.0% mgmt
Financing live
Cash to close
- Down payment
- $28,725
- Closing costs
- $3,447
- Reserves months
- —
- Total cash needed
- —
Loan-product check · same deal, 3 products live
Conventional
25% down · 7.5% · 30yr
- Down + closing
- —
- Monthly P&I
- —
- Monthly cashflow
- —
- DSCR
- —
- Eligible?
- —
Personal DTI + credit; lowest rate.
DSCR
20% down · 8.5% · 30yr
- Down + closing
- —
- Monthly P&I
- —
- Monthly cashflow
- —
- DSCR
- —
- Eligible?
- —
No personal income docs; deal must DSCR.
Hard money
10% down · 12.0% · 12mo
- Down + closing
- —
- Monthly P&I
- —
- Monthly cashflow
- —
- DSCR
- —
- Eligible?
- —
Short-term bridge; refi at stabilization.
Rent comps 2 comps
| Address | Beds | Baths | Sqft | Rent | $/sqft | DOM | Units | Dist |
|---|---|---|---|---|---|---|---|---|
| 1045 Pine Island Rd Merritt Island, FL | 3.0 | 2.0 | 1725 | $2,450 | $1.42 | 23d | 1 | 0.87mi |
| 5870 N Courtenay Pkwy Unit 1 Merritt Island, FL | 3.0 | 2.0 | 2000 | $2,900 | $1.45 | 23d | 1 | 1.20mi |
Listing history 13 events
-
2026-06-18days on market $114,900 Active 316 DOM
-
2026-06-17days on market $114,900 Active 315 DOM
-
2026-06-16days on market $114,900 Active 314 DOM
-
2026-06-15days on market $114,900 Active 313 DOM
-
2026-06-14days on market $114,900 Active 311 DOM
-
2026-06-10days on market $114,900 Active 308 DOM
-
2026-06-08days on market $114,900 Active 306 DOM
-
2026-06-07days on market $114,900 Active 305 DOM
-
2026-06-05days on market $114,900 Active 302 DOM
-
2026-06-03days on market $114,900 Active 301 DOM
-
2026-06-02days on market $114,900 Active 300 DOM
-
2026-06-01days on market $114,900 Active 299 DOM
-
2026-05-31days on market $114,900 Active 298 DOM
ⓘ Source: listings_history table (triggers on properties + properties_extension) + one-shot
backfill from property_details.listing_events for pre-trigger history.
Climate risk First Street
- Flood 9/10 Extreme FEMA zone X (shaded) · 99% chance over 30 yrs
- Wildfire 3/10 Moderate
- Heat 10/10 Extreme 7 d/yr ≥105°F today · 23 d/yr by 30 yrs out
- Wind 10/10 Extreme 99% chance of damaging wind over 30 yrs
- Air quality 2/10 Low 1 unhealthy d/yr today · 1 by 30 yrs out
Nearby sold comps map
Loading sold comps map…
Walkable amenities ~0.75 mi
Loading nearby amenities…
Taxation est. · year 1
- Rental income
- $35,265
- − Mortgage interest
- −$6,436
- − Property taxes
- −$1,724
- − Insurance
- −$1,372
- − Repairs & maintenance
- −$2,821
- − Management
- −$2,821
- − Depreciation
- −$3,343
- Taxable income
- $16,748
- Est. tax owed @ 24.0%
- −$4,020
- After-tax cash flow
- $13,514/yr
For passive investors: Depreciation is non-cash, so a rental often shows a tax loss while cash-flowing — sheltering income. Rental losses are passive: they offset passive income freely, and up to $25,000/yr can offset ordinary (W-2) income if you actively participate and your MAGI is under $100k (phasing out to $0 by $150k); unused losses carry forward. On sale, claimed depreciation is recaptured at up to 25%, and gains may owe capital-gains tax (a 1031 exchange can defer both). Figures are a year-1 estimate at your 24.0% rate — not tax advice; consult a CPA.
Schools (NCES district)
- District
- Brevard
- NCES district ID
- 1200150
- Math proficiency
- 53% ▼ -9.00%
- Reading proficiency
- 57% ▼ -4.00%
- Median HH income
- $49,426
- Composite
- 46.86/100
- National rank
- #2370
- State rank
- #19 of 73 in FL
Livability — North Merritt Island
No livability data for this city. (Only ~50 U.S. cities are tracked.)
Census & demographics
- Census place
- North Merritt Island, FL
- County
- Brevard County · 602,871 people
- City population
- 24,834
- Metro
- Palm Bay-Melbourne-Titusville, FL
- Population (ZIP)
- 21,613
- Household income
- $102,726
- Rent vs Own
- Severe rent burden
- 199.0
Population outlook (Brevard County) Hauer SSP2
- Today (2025)
- 623,254 people
- By 2030
- 648,420 · +4.0%
- By 2040
- 690,009 · +10.7%
- By 2050
- 715,669 · +14.8%
- By 2075
- 775,744 · +24.5%
- By 2100
- 776,687 · +24.6%
Race, ethnicity, and origin ACS 2023
- Neighborhood character
- Predominantly White (85%)
- Race & ethnicity
- White 85% Hispanic / Latino 6% Two or more races 6% Asian 2% Black 2%
- Hispanic origin (detail)
- Puerto Rican 4% Cuban 1%
- Common ancestry
- Romanian 3% Slovak 2% Lithuanian 1%
- Foreign-born
- 5% · Canada, China
- Languages at home
- 92% English-only · Spanish 4% Other Indo-European 1%
Political lean MEDSL · Brevard
- 2024 margin
- Strong R (+20.8) · D 39.1% · R 59.9% · Other 1.0%
- 2008→2024 swing
- -10.4pp toward R · 2008: -10.4pp · 2024: -20.8pp
- All cycles
- 2024: R+20.8 2020: R+16.4 2016: R+19.8 2012: R+12.7 2008: R+10.4
Not yet ingested
- Civics
- —
Market trends
- HPI YoY
- ▼ -177.56%
- Current HPI
- 323.6021
- Rent YoY
- ▲ 6.53%
- Metro
- Palm Bay-Melbourne-Titusville, FL
- State GDP YoY
- ▲ 3.28%
- F500 in state
- 36
Industry mix (Fortune 500 HQ in FL)
| Industry | F500 HQs | Revenue |
|---|---|---|
| Industrial Technology | 2 | $29B |
|
||
| Insurance | 2 | $17B |
|
||
| Retail | 1 | $60B |
|
||
| Technology Distribution | 1 | $58B |
|
||
| Homebuilding | 1 | $35B |
|
||
| Technology Manufacturing | 1 | $35B |
|
||
Cash-flow waterfall
monthlySold comps — $/sqft
last 12 mo · ≤1 miLoading sold comps…