5855 Norte Rd SE · La Hacienda, NM
Flood risk 3/10 · Minor
- FEMA flood zone
- X (unshaded)
- Chance of flooding over 30 yrs
- 0.14%
- Est. flood insurance / yr
- $507 – $1,088
Fire risk 4/10 · Minor
- Est. fire insurance / yr
- $706 – $1,312
Heat risk 6/10 · Moderate
- Hot days now (above 100°F)
- 7 days/yr
- Hot days in 30 yrs
- 23 days/yr
Wind risk 1/10 · Minimal
- Chance of severe wind over 30 yrs
- —
Air-quality risk 1/10 · Minimal
- Unhealthy air days now
- 0 days/yr
- Unhealthy air days in 30 yrs
- 0 days/yr
Risk factors via First Street. Map © Google.
Why this score? — see what drove the B- grade
The composite is a weighted blend of 9 inputs, each scored 0–100. Each bar is that input's sub-score; the figure is the points it added to the 100-point composite (weight × sub-score).
- Cash flow +30.0/30.0
- 1% rule +10.0/10.0
- DSCR +10.0/10.0
- ARV discount +7.5/15.0
- Rent growth +2.5/5.0
- Condition / age +2.5/5.0
- Livability +2.2/5.0
- Schools +2.1/10.0
- Appreciation +0.0/10.0
$59,000
🖨 Deal sheet (PDF) 📄 Offer letter ✓ Due diligence
Listing remarks MLS
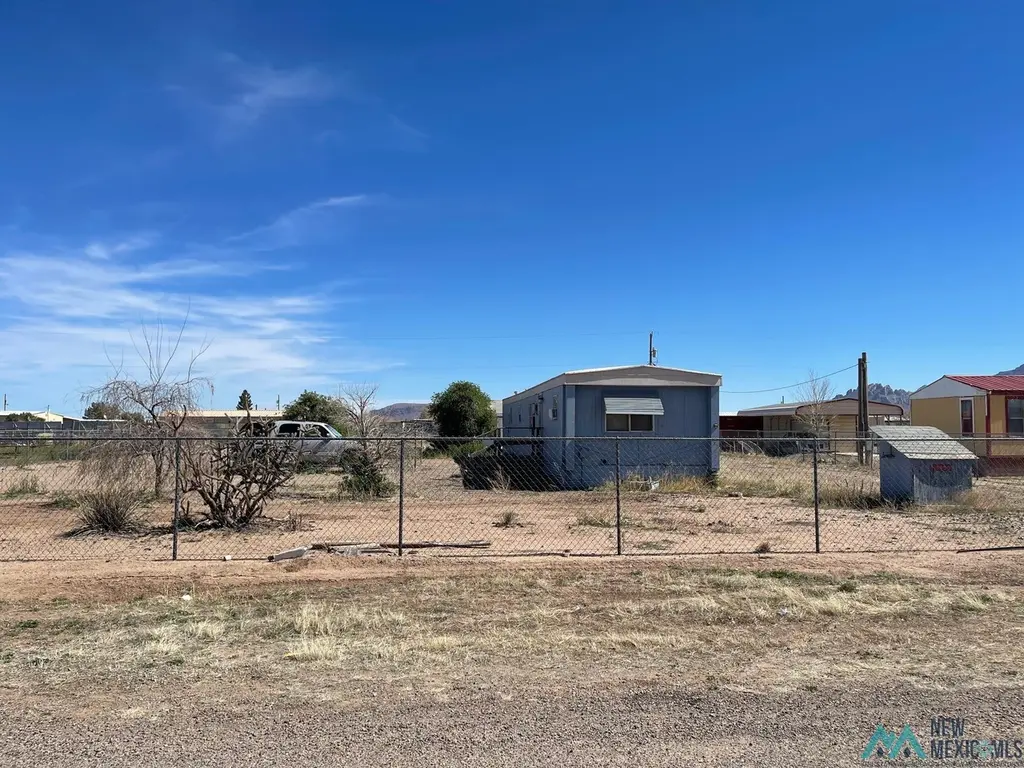
2 Bedroom 2 Bath 1983 Skyline Single Wide Mobile Home. Needs repairs, selling AS IS, has a well, septic and electrical. Open kitchen with appliances, detached 2 car garage, large fenced yard. Tenant occupied, please do not disturb the tenant. Shown by appointment to pre-qualified buyers only. Call us for more info!
Key facts
- 0.5 acre lot
- Built 1983
- Listed 72 days
Neighborhood map
What this means for you Summary
Snapshot
- This is a 2-bed/2.0-bath manufactured listed at $59k.
Deal economics
- At list price, monthly cash flow is $377 ($5k/yr) — positive.
- The deal already cash-flows at list — no discount required.
- Meets the 1% rule at list price ($993 rent vs $59k).
- Recommended offer: $55k (6.0% below list) — sets the bar for market timing.
Location & tenants
- Location reads 44/100 on livability (#355 in NM) — a working-class tenant base; expect higher turnover. Strengths: cost of living A+, crime A; Watch: health & safety C-, schools F, amenities F.
- Deming Public Schools (town): math 18% / reading 27% proficiency, ranked #63 of 95 in NM (top 66%) — low school quality limits family demand, transient renter base, plan for 1-2y turnover; 97% free/reduced lunch — lower-income household profile, screen leases tightly.
- Market conditions: 375 active listings in the ZIP; 7 units permitted in Luna County in 2024 (0 in 5+ unit buildings).
Forward outlook
- Local home prices are declining (-3.0%/yr); year-one equity from $408 of loan paydown is wiped out by about $2k of value loss. Plan a longer hold.
- Luna County population projected at -15% by 2050 — secular population decline; favor cash flow + early exit over multi-decade hold.
- At projected returns (-3.0% appreciation + 3.0% rent growth), your $17k cash investment doubles in ~5 years — after that, you're playing with house money.
Negotiation context
- It's been on market 72 days — a 6% lower offer ($55k) is reasonable based on typical stale-listing flexibility.
- 2 sale attempts with the ask held roughly flat each time — persistent listings suggest the price (not the market) is what's stuck; bring a comps-based counter.
Risks & watch-outs
- Climate carrying-cost: extreme-heat days projected 7→23/yr by 2055 (HVAC capex compounding) — expect insurance premiums to compound above CPI over the hold.
Questions for the listing agent
- It's been on market 72 days. Have you received any prior offers? Is the seller open to a 6% concession, seller financing, or rate buy-down credit?
- Why hasn't it sold? Are there any deal-killer items the seller is aware of (foundation, flood, title, zoning, code violations)?
- Is there a deadline driving the sale (1031 exchange, divorce, estate, relocation)? That informs how much negotiation room exists.
- Schools are F-rated, which usually means shorter tenancies and higher turnover. Who's the typical renter profile here, and what's been the actual vacancy rate?
- What's the average days-on-market for RENTAL listings here right now (not sales)? A rising rental-DOM trend means longer vacancies and softer asking-rent achievability than the comps imply.
- What's the recent tenant-quality profile in this submarket — average credit score on applications, eviction rate, late-payment / NSF rate, and stable-employment percentage? A property-management company in the area should have these aggregated.
- How much new for-sale + rental construction is in the pipeline within 1–3 miles? Heavy new supply typically softens prices + rents 12–24 months out; constrained supply supports both.
Investment metrics
- 1% rule
- 1.68% ✓
- Cap rate
- 13.95%
- Cash-on-cash
- 27.36%
- DSCR
- 2.22
- GRM
- 5.0
CMA / ARV
No comps found within radius.
Projected returns pro-forma
-3.0% appreciation · 3.0% rent growth · sell at horizon
- IRR
- 21.4%
- Equity multiple
- 1.87×
- Total profit
- $14,446
- Equity at exit
- $8,797
- IRR
- 29.5%
- Equity multiple
- 3.64×
- Total profit
- $43,534
- Equity at exit
- $5,101
Cash invested: $16,520 (down + closing). Projections, not guarantees.
Landlord ↔ Tenant lean methodology
- Overall (STATE)
- 55 Moderately Landlord-Leaning
- State New Mexico
- 55 Moderately Landlord-Leaning · D+3
- County
- — inherits STATE
- City
- — inherits STATE
ZIP-level market 88030
- Home prices YoY
- -32.9%
- Active inventory
- 375
- Price-to-rent
- 5.0×
Monthly cashflow live
- Estimated rent
- $993 medium interval (Pro) →
- Mortgage (P&I)
- −$309
- Tax est. 1.5%
- −$74 /mo · $885/yr
- Insurance
- −$25
- HOA
- −$0
- Vacancy / Maint / Mgmt
- −$209
- Net cashflow
- $377
Break-even live
Sensitivity live
| Price | -10% $417 | -5% $397 | +0% $377 | +5% $356 | +10% $336 |
|---|---|---|---|---|---|
| Rent | -10% $298 | -5% $337 | +0% $377 | +5% $416 | +10% $455 |
| Rate | -1.0pp $406 | -0.5pp $392 | base $377 | +0.5pp $361 | +1.0pp $346 |
UW: 25.0% down · 7.5% · 30yr · 1.5% tax · 5.0% vac · 8.0% maint · 8.0% mgmt
Financing live
Cash to close
- Down payment
- $14,750
- Closing costs
- $1,770
- Reserves months
- —
- Total cash needed
- —
Loan-product check · same deal, 3 products live
Conventional
25% down · 7.5% · 30yr
- Down + closing
- —
- Monthly P&I
- —
- Monthly cashflow
- —
- DSCR
- —
- Eligible?
- —
Personal DTI + credit; lowest rate.
DSCR
20% down · 8.5% · 30yr
- Down + closing
- —
- Monthly P&I
- —
- Monthly cashflow
- —
- DSCR
- —
- Eligible?
- —
No personal income docs; deal must DSCR.
Hard money
10% down · 12.0% · 12mo
- Down + closing
- —
- Monthly P&I
- —
- Monthly cashflow
- —
- DSCR
- —
- Eligible?
- —
Short-term bridge; refi at stabilization.
Listing history 3 events
-
2026-04-02status Active 317-char remark
Show marketing remark (317 chars)
2 Bedroom 2 Bath 1983 Skyline Single Wide Mobile Home. Needs repairs, selling AS IS, has a well, septic and electrical. Open kitchen with appliances, detached 2 car garage, large fenced yard. Tenant occupied, please do not disturb the tenant. Shown by appointment to pre-qualified buyers only. Call us for more info!
-
2026-03-21status Pending 317-char remark
Show marketing remark (317 chars)
2 Bedroom 2 Bath 1983 Skyline Single Wide Mobile Home. Needs repairs, selling AS IS, has a well, septic and electrical. Open kitchen with appliances, detached 2 car garage, large fenced yard. Tenant occupied, please do not disturb the tenant. Shown by appointment to pre-qualified buyers only. Call us for more info!
-
2026-03-04$59,000 Active 317-char remark
Show marketing remark (317 chars)
2 Bedroom 2 Bath 1983 Skyline Single Wide Mobile Home. Needs repairs, selling AS IS, has a well, septic and electrical. Open kitchen with appliances, detached 2 car garage, large fenced yard. Tenant occupied, please do not disturb the tenant. Shown by appointment to pre-qualified buyers only. Call us for more info!
ⓘ Source: listings_history table (triggers on properties + properties_extension) + one-shot
backfill from property_details.listing_events for pre-trigger history.
Climate risk First Street
- Flood 3/10 Moderate FEMA zone X (unshaded) · 14% chance over 30 yrs
- Wildfire 4/10 Moderate
- Heat 6/10 Major 7 d/yr ≥100°F today · 23 d/yr by 30 yrs out
- Wind 1/10 Low
- Air quality 1/10 Low 0 unhealthy d/yr today · 0 by 30 yrs out
Nearby sold comps map
Loading sold comps map…
Walkable amenities ~0.75 mi
Loading nearby amenities…
Taxation est. · year 1
- Rental income
- $11,915
- − Mortgage interest
- −$3,305
- − Property taxes
- −$885
- − Insurance
- −$295
- − Repairs & maintenance
- −$953
- − Management
- −$953
- − Depreciation
- −$1,716
- Taxable income
- $3,808
- Est. tax owed @ 24.0%
- −$914
- After-tax cash flow
- $3,606/yr
For passive investors: Depreciation is non-cash, so a rental often shows a tax loss while cash-flowing — sheltering income. Rental losses are passive: they offset passive income freely, and up to $25,000/yr can offset ordinary (W-2) income if you actively participate and your MAGI is under $100k (phasing out to $0 by $150k); unused losses carry forward. On sale, claimed depreciation is recaptured at up to 25%, and gains may owe capital-gains tax (a 1031 exchange can defer both). Figures are a year-1 estimate at your 24.0% rate — not tax advice; consult a CPA.
Schools (NCES district)
- District
- Deming Public Schools
- NCES district ID
- 3500690
- Math proficiency
- 18% —
- Reading proficiency
- 27% —
- Median HH income
- $28,092
- Composite
- 21.02/100
- National rank
- #13708
- State rank
- #63 of 95 in NM
Livability — La Hacienda
- Score
- 44/100
- State rank
- #355
- US rank
- #26748
Category grades
Schools grade is shown separately in the Schools card above.
Census & demographics
- Census place
- La Hacienda, NM
- Population (ZIP)
- 24,270
Population outlook (Luna County) Hauer SSP2
- Today (2025)
- 22,859 people
- By 2030
- 22,105 · -3.3%
- By 2040
- 20,738 · -9.3%
- By 2050
- 19,336 · -15.4%
- By 2075
- 15,439 · -32.5%
- By 2100
- 9,313 · -59.3%
Race, ethnicity, and origin ACS 2023
- Neighborhood character
- Predominantly Hispanic (66%)
- Race & ethnicity
- Hispanic / Latino 66% Two or more races 32% White 30% Black 2% Native American 1%
- Hispanic origin (detail)
- Mexican 63%
- Common ancestry
- Slovak 1% Lithuanian 1% Italian 1%
- Foreign-born
- 16% · Canada
- Languages at home
- 49% English-only · Spanish 50%
Political lean MEDSL · Luna
- 2024 margin
- R (+18.9) · D 39.4% · R 58.3% · Other 2.3%
- 2008→2024 swing
- -24.2pp toward R · 2008: 5.3pp · 2024: -18.9pp
- All cycles
- 2024: R+18.9 2020: R+10.4 2016: R+3.9 2012: R+1.1 2008: D+5.3
Not yet ingested
- Civics
- —
Market trends
- HPI YoY
- ▼ -56.37%
- Current HPI
- 114.8626
- Rent YoY
- —
- Metro
- —
- State GDP YoY
- —
- F500 in state
- 0
Price history
3 events — show timeline
- 2026-04-02 Relisted — NMMLS
- 2026-03-21 Pending — NMMLS
- 2026-03-04 Listed $59,000 NMMLS
Cash-flow waterfall
monthlySold comps — $/sqft
last 12 mo · ≤1 miLoading sold comps…