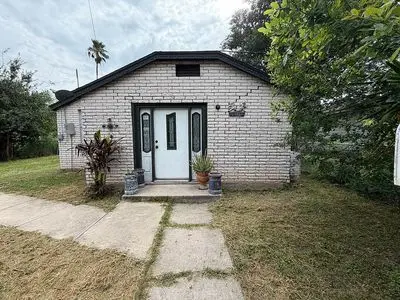
404 N Cedro St · Weslaco, TX
Flood risk 4/10 · Minor
- FEMA flood zone
- X
- Chance of flooding over 30 yrs
- 0.22%
- Est. flood insurance / yr
- $507 – $1,088
Fire risk 1/10 · Minimal
- Est. fire insurance / yr
- $1,222 – $2,270
Heat risk 9/10 · Severe
- Hot days now (above 111°F)
- 7 days/yr
- Hot days in 30 yrs
- 23 days/yr
Wind risk 8/10 · Major
- Chance of severe wind over 30 yrs
- 99.0%
Air-quality risk 1/10 · Minimal
- Unhealthy air days now
- 0 days/yr
- Unhealthy air days in 30 yrs
- 0 days/yr
Risk factors via First Street. Map © Google.
Why this score? — see what drove the C grade
The composite is a weighted blend of 9 inputs, each scored 0–100. Each bar is that input's sub-score; the figure is the points it added to the 100-point composite (weight × sub-score).
- Cash flow +16.4/30.0
- ARV discount +15.0/15.0
- 1% rule +5.2/10.0
- DSCR +5.1/10.0
- Appreciation +4.7/10.0
- Livability +3.6/5.0
- Rent growth +2.5/5.0
- Condition / age +2.5/5.0
- Schools +2.2/10.0
$110,000
🖨 Deal sheet 📄 Offer letter ✓ Due diligence
Listing remarks
Affordable Starter Home This 2 bed / 1 bath, 1,144 sq ft home is the perfect fit for first-time buyers or small families. Highlights: & Acirc; & nbsp; & Acirc; & nbsp; & Acirc; & nbsp; & Acirc; & nbsp; & acirc; & euro; & cent; & Acirc; & nbsp; & Acirc; & nbsp; & Acirc; & nbsp; & Acirc; & nbsp; Great location near Sam Houston Elementary & amp; Central Middle School, Weslaco High School & Acirc; & nbsp; & Acirc; & nbsp; & Acirc; & nbsp; & Acirc; & nbsp; & acirc; & euro; & cent; & Acirc; & nbsp; & Acirc; & nbsp; & Acirc; & nbsp; & Acirc; &a
Key facts
- Walkable to schools
- Built 1987
- Listed 7 days
Tags
Neighborhood map
What this means for you Summary
Snapshot
- This is a 2-bed/1.0-bath single-family listed at $110k.
Deal economics
- At list price, monthly cash flow is $63 ($757/yr) — positive.
- The deal already cash-flows at list — no discount required.
- Meets the 1% rule at list price ($1k rent vs $110k).
- Cap rate 7.0% vs local median 4.1% in Weslaco — top-decile yield for the area; either an underpriced asset or a hidden risk that comps aren't pricing in. Stress-test before assuming the spread holds.
Location & tenants
- Location reads 72/100 on livability (#277 in TX) — a middle-class / working-renter tenant base. Strengths: cost of living A+, housing A+, health & safety A+; Watch: employment D+, crime F, amenities F.
- Weslaco ISD (suburban): math 23% / reading 31% proficiency, ranked #705 of 826 in TX (top 85%) — low school quality limits family demand, transient renter base, plan for 1-2y turnover.
- Market conditions: 708 active listings in the ZIP; 35 comparable units currently listed for rent nearby; rentals lingering (median 44d on market — plan ~5-8 weeks vacancy on turnover, expect pricing pressure); 86% of comp listings sitting > 30 days — soft ceiling on asking rent; 7,378 units permitted in Hidalgo County in 2024 (641 in 5+ unit buildings).
Forward outlook
- In year one you build about $118 of equity ($761 loan paydown + $-643 appreciation (-0.6% local appreciation)).
- Hidalgo County population projected at +28% by 2050 — long-run rental-demand tailwind backs the buy-and-hold thesis.
Negotiation context
- Only 8 days on market — expect competitive offers; lowballing is unlikely to land.
Risks & watch-outs
- Climate carrying-cost: severe wind risk, 99% chance of damaging wind over 30y; extreme-heat days projected 7→23/yr by 2055 (HVAC capex compounding) — expect insurance premiums to compound above CPI over the hold.
Questions for the listing agent
- Is there a deadline driving the sale (1031 exchange, divorce, estate, relocation)? That informs how much negotiation room exists.
- Crime grade is F in this area — have there been break-ins, vandalism, or insurance claims at this property in the last 3 years? What carrier currently insures it and at what premium?
- What's the average days-on-market for RENTAL listings here right now (not sales)? A rising rental-DOM trend means longer vacancies and softer asking-rent achievability than the comps imply.
- What's the recent tenant-quality profile in this submarket — average credit score on applications, eviction rate, late-payment / NSF rate, and stable-employment percentage? A property-management company in the area should have these aggregated.
- How much new for-sale + rental construction is in the pipeline within 1–3 miles? Heavy new supply typically softens prices + rents 12–24 months out; constrained supply supports both.
Investment metrics
- 1% rule
- 1.02% ✓
- Cap rate
- 6.98%
- Cash-on-cash
- 2.46%
- DSCR
- 1.11
- GRM
- 8.2
CMA / ARV
- ARV (on-the-fly)
- $151,008
- Comps found
- 12
Show comp detail 12 sales within ~0.75 mi
| Address | Dist | Beds/Ba | Sqft | Sold | Price | $/sf | Match |
|---|---|---|---|---|---|---|---|
| 418 W Huisache Ave | 0.11mi | 3/2.0 (+1) | 1,177 (+3%) | 6mo | $175,000 | $149 | 76 |
| 611 San Benito St | 0.46mi | 3/1.0 (+1) | 1,148 (+0%) | 3mo | $84,900 | $74 | 70 |
| 513 San Benito St | 0.43mi | 3/2.0 (+1) | 1,250 (+9%) | 1mo | $165,000 | $132 | 55 |
| 504 N Cantu St | 0.47mi | 2/1.0 | 987 (-14%) | 2mo | $49,000 | $50 | 54 |
| 103 Grace Ave | 0.66mi | 2/1.0 | 1,068 (-7%) | 8mo | $60,000 | $56 | 52 |
| 805 W 6th St W | 0.75mi | 2/2.0 | 1,084 (-5%) | 1mo | $134,900 | $124 | 51 |
| 603 Witmer St | 0.61mi | 3/1.0 (+1) | 1,094 (-4%) | 10mo | $109,000 | $100 | 51 |
| 725 E Los Torritos St | 0.64mi | 3/1.0 (+1) | 1,080 (-6%) | 6mo | $166,000 | $154 | 51 |
| 1012 W 3rd St | 0.67mi | 3/1.0 (+1) | 1,250 (+9%) | 1mo | $159,000 | $127 | 48 |
| 511 E Huisache St | 0.45mi | 3/2.0 (+1) | 1,000 (-13%) | 2mo | $155,000 | $155 | 47 |
| 814 N Martinez Ave | 0.62mi | 3/2.0 (+1) | 1,074 (-6%) | 8mo | $159,900 | $149 | 46 |
| 835 N Martinez Ave | 0.63mi | 3/2.0 (+1) | 1,074 (-6%) | 10mo | $160,000 | $149 | 43 |
Match score weights: distance 35% · size 25% · config 20% · recency 20%. Top-matched comps best support the ARV.
Projected returns pro-forma
-0.58% appreciation · 3.0% rent growth · sell at horizon
- IRR
- -1.5%
- Equity multiple
- 0.93×
- Total profit
- $-2,133
- Equity at exit
- $28,765
- IRR
- 4.7%
- Equity multiple
- 1.48×
- Total profit
- $14,679
- Equity at exit
- $32,134
Cash invested: $30,800 (down + closing). Projections, not guarantees.
Landlord ↔ Tenant lean methodology
- Overall (STATE)
- 87 Strongly Landlord-Friendly
- State Texas
- 87 Strongly Landlord-Friendly · R+5
- County
- — inherits STATE
- City
- — inherits STATE
ZIP-level market 78596
- Home prices YoY
- -0.2%
- Active inventory
- 708
- Price-to-rent
- 8.2×
Monthly cashflow live
- Estimated rent
- $1,119 high interval (Pro) →
- Mortgage (P&I)
- −$577
- Tax from tax record
- −$198 /mo · $2,381/yr
- Insurance
- −$46
- HOA
- −$0
- Vacancy / Maint / Mgmt
- −$235
- Net cashflow
- $63
Break-even live
UW: 25.0% down · 7.5% · 30yr · 1.5% tax · 5.0% vac · 8.0% maint · 8.0% mgmt
Financing live
Cash to close
- Down payment
- $27,500
- Closing costs
- $3,300
- Reserves months
- —
- Total cash needed
- —
Loan-product check · same deal, 3 products live
Conventional
25% down · 7.5% · 30yr
- Down + closing
- —
- Monthly P&I
- —
- Monthly cashflow
- —
- DSCR
- —
- Eligible?
- —
Personal DTI + credit; lowest rate.
DSCR
20% down · 8.5% · 30yr
- Down + closing
- —
- Monthly P&I
- —
- Monthly cashflow
- —
- DSCR
- —
- Eligible?
- —
No personal income docs; deal must DSCR.
Hard money
10% down · 12.0% · 12mo
- Down + closing
- —
- Monthly P&I
- —
- Monthly cashflow
- —
- DSCR
- —
- Eligible?
- —
Short-term bridge; refi at stabilization.
Rent comps 35 comps
| Address | Beds | Baths | Sqft | Rent | $/sqft | DOM | Units | Dist |
|---|---|---|---|---|---|---|---|---|
| 309 E Mesquite St Weslaco, TX | 3.0 | 2.0 | 1100 | $1,400 | $1.27 | 44d | 1 | 0.32mi |
| 3814 Bella Costa Dr Unit 3 Weslaco, TX | 2.0 | 2.0 | 987 | $1,025 | $1.04 | 44d | 1 | 0.46mi |
| 3707 Las Vistas Ln Apt 1 Weslaco, TX | 2.0 | 2.0 | 987 | $1,025 | $1.04 | 44d | 1 | 0.46mi |
| 622 E Llano Grande St Weslaco, TX | 3.0 | 2.0 | 1100 | $1,500 | $1.36 | 44d | 1 | 0.53mi |
| 301 E 4th St Unit 5 Weslaco, TX | 1.0 | 1.0 | 700 | $670 | $0.96 | 44d | 1 | 0.60mi |
| 705 E 6th St Apt 4 Weslaco, TX | 1.0 | 1.0 | 700 | $695 | $0.99 | 44d | 1 | 0.88mi |
| 705 E 6th St Unit 21 Weslaco, TX | 1.0 | 1.0 | 700 | $595 | $0.85 | 44d | 1 | 0.88mi |
| 1006 Lilia Dr Weslaco, TX | 1.0 | 1.0 | 720 | $650 | $0.90 | 44d | 1 | 0.93mi |
| 222 S Westgate Dr Weslaco, TX | 1.0 | 1.0 | 700 | $680 | $0.97 | 44d | 1 | 0.99mi |
| 222 S Westgate Dr Apt 6 Weslaco, TX | 1.0 | 1.0 | 700 | $680 | $0.97 | 44d | 1 | 0.99mi |
| 1601 S Airport Dr Unit 261 Weslaco, TX | 2.0 | 2.0 | 912 | $1,500 | $1.64 | 44d | 1 | 1.16mi |
| 1601 S Airport Dr Unit 283 Weslaco, TX | 3.0 | 2.0 | 1033 | $1,600 | $1.55 | 44d | 1 | 1.16mi |
| 1721 Harrison St Weslaco, TX | 2.0 | 2.0 | 1005 | $1,025 | $1.02 | 44d | 1 | 1.27mi |
| 1723 Davenport St Unit 2 Weslaco, TX | 3.0 | 2.0 | 1140 | $1,175 | $1.03 | 44d | 1 | 1.27mi |
| 1804 Davenport St Unit 4 Weslaco, TX | 2.0 | 2.0 | 938 | $1,125 | $1.20 | 44d | 1 | 1.29mi |
| 1805 Stauffers St Unit 3 Weslaco, TX | 3.0 | 2.0 | 1116 | $1,150 | $1.03 | 44d | 1 | 1.30mi |
| 1804 Stauffers St #3 Weslaco, TX | 2.0 | 2.0 | 840 | $1,000 | $1.19 | 44d | 1 | 1.31mi |
| 607 E Washington St Weslaco, TX | 3.0 | 2.0 | 1000 | $900 | $0.90 | 44d | 1 | 1.31mi |
| 617 E Washington St Unit 4 Weslaco, TX | 3.0 | 2.0 | 1000 | $900 | $0.90 | 44d | 1 | 1.32mi |
| 1722 E Davenport St Unit 4 Weslaco, TX | 2.0 | 2.0 | 938 | $1,100 | $1.17 | 44d | 1 | 1.32mi |
| 2013 Canyon Dr Unit 4 Weslaco, TX | 3.0 | 2.0 | 1111 | $1,200 | $1.08 | 23d | 1 | 1.33mi |
| 1817 Stauffer St Weslaco, TX | 3.0 | 2.0 | 1116 | $1,200 | $1.08 | 44d | 1 | 1.34mi |
| 1909 Davenport St Unit 3 Weslaco, TX | 3.0 | 2.0 | 1140 | $1,175 | $1.03 | 44d | 1 | 1.35mi |
| 1812 Redbud Ln Unit 1 Weslaco, TX | 2.0 | 2.0 | 874 | $1,025 | $1.17 | 44d | 1 | 1.36mi |
| 1917 Davenport St Unit 1 Weslaco, TX | 2.0 | 2.0 | 938 | $1,100 | $1.17 | 44d | 1 | 1.38mi |
| 700 Oriole Rd #2 Weslaco, TX | 2.0 | 2.0 | 1020 | $1,250 | $1.23 | 44d | 1 | 1.39mi |
| 815 E Sugarcane Dr Unit E4 Weslaco, TX | 2.0 | 1.5 | 1124 | $1,200 | $1.07 | 44d | 1 | 1.42mi |
| 2108 Redbud Ln Unit 4 Weslaco, TX | 2.0 | 2.0 | 920 | $1,050 | $1.14 | 44d | 1 | 1.46mi |
| 2103 Taft St Unit 4 Weslaco, TX | 3.0 | 2.0 | 1111 | $1,095 | $0.99 | 44d | 1 | 1.47mi |
| 2605 Woodpecker Rd Unit 4 Weslaco, TX | 3.0 | 2.0 | 1183 | $1,300 | $1.10 | 23d | 1 | 1.47mi |
| 2608 Mockingbird Rd Unit 4 Weslaco, TX | 3.0 | 2.0 | 1183 | $1,380 | $1.17 | 21d | 1 | 1.48mi |
| 2604 Woodpecker Rd Unit 2 Weslaco, TX | 2.0 | 2.0 | 1068 | $1,200 | $1.12 | 14d | 1 | 1.48mi |
| 2609 Woodpecker Rd Unit 1 Weslaco, TX | 2.0 | 2.0 | 1020 | $1,250 | $1.23 | 23d | 1 | 1.49mi |
| 1430 Mile 6 1/2 W Unit 6 1/2 Weslaco, TX | 2.0 | 2.0 | 850 | $877 | $1.03 | 44d | 1 | 1.49mi |
| 2613 Mockingbird Rd Unit D Weslaco, TX | 2.0 | 2.0 | 973 | $1,200 | $1.23 | 44d | 1 | 1.49mi |
Listing history 8 events
-
2026-06-18days on market $110,000 Active 8 DOM
-
2026-06-17days on market $110,000 Active 7 DOM
-
2026-06-16days on market $110,000 Active 6 DOM
-
2026-06-15days on market $110,000 Active 5 DOM
-
2026-06-15days on market $110,000 Active 4 DOM
-
2026-06-13days on market $110,000 Active 3 DOM
-
2026-06-12remarks 547-char remark
-
2026-06-12$110,000 Active 2 DOM
ⓘ Source: listings_history table (triggers on properties + properties_extension) + one-shot
backfill from property_details.listing_events for pre-trigger history.
Tax reassessment forecast TX · Resets to sale price
- Current annual tax
- $2,381 · $198/mo
- Projected year-2 tax
- $2,381 · $198/mo
- Expected delta
- $0/yr ($0/mo · 0.0%)
ⓘ Screening estimate from a state-policy table — verify with the county assessor before closing.
Climate risk First Street
- Flood 4/10 Moderate FEMA zone X · 22% chance over 30 yrs
- Wildfire 1/10 Low
- Heat 9/10 Extreme 7 d/yr ≥111°F today · 23 d/yr by 30 yrs out
- Wind 8/10 Severe 99% chance of damaging wind over 30 yrs
- Air quality 1/10 Low 0 unhealthy d/yr today · 0 by 30 yrs out
Nearby sold comps map
Loading sold comps map…
Walkable amenities ~0.75 mi
Loading nearby amenities…
Taxation est. · year 1
- Rental income
- $13,430
- − Mortgage interest
- −$6,162
- − Property taxes
- −$2,381
- − Insurance
- −$550
- − Repairs & maintenance
- −$1,074
- − Management
- −$1,074
- − Depreciation
- −$3,200
- Taxable loss
- −$1,011
- Est. tax savings @ 24.0%
- +$243
- After-tax cash flow
- $999/yr
For passive investors: Depreciation is non-cash, so a rental often shows a tax loss while cash-flowing — sheltering income. Rental losses are passive: they offset passive income freely, and up to $25,000/yr can offset ordinary (W-2) income if you actively participate and your MAGI is under $100k (phasing out to $0 by $150k); unused losses carry forward. On sale, claimed depreciation is recaptured at up to 25%, and gains may owe capital-gains tax (a 1031 exchange can defer both). Figures are a year-1 estimate at your 24.0% rate — not tax advice; consult a CPA.
Schools (NCES district)
- District
- Weslaco ISD
- NCES district ID
- 4844960
- Math proficiency
- 23% ▼ -29.00%
- Reading proficiency
- 31% ▼ -9.00%
- Median HH income
- $32,867
- Composite
- 22.05/100
- National rank
- #8196
- State rank
- #705 of 826 in TX
Livability — Weslaco
- Score
- 72/100
- State rank
- #277
- US rank
- #6469
Category grades
Schools grade is shown separately in the Schools card above.
Census & demographics
- Census place
- Weslaco, TX
- Population (ZIP)
- 38,942
Population outlook (Hidalgo County) Hauer SSP2
- Today (2025)
- 955,232 people
- By 2030
- 1,009,774 · +5.7%
- By 2040
- 1,120,332 · +17.3%
- By 2050
- 1,225,036 · +28.2%
- By 2075
- 1,439,189 · +50.7%
- By 2100
- 1,533,429 · +60.5%
Race, ethnicity, and origin ACS 2023
- Neighborhood character
- Predominantly Hispanic (86%)
- Race & ethnicity
- Hispanic / Latino 86% Two or more races 38% White 13%
- Hispanic origin (detail)
- Mexican 82%
- Common ancestry
- Slovak 1%
- Foreign-born
- 17% · Canada
- Languages at home
- 27% English-only · Spanish 72%
Political lean MEDSL · Hidalgo
- 2024 margin
- Toss-up / Even · D 48.1% · R 51.0%
- 2008→2024 swing
- -41.6pp toward R · 2008: 38.7pp · 2024: -2.9pp
- All cycles
- 2024: R+2.9 2020: D+17.1 2016: D+40.5 2012: D+41.8 2008: D+38.7
Not yet ingested
- Civics
- —
Market trends
- HPI YoY
- ▼ -0.58%
- Current HPI
- 261.5117
- Rent YoY
- —
- Metro
- —
- State GDP YoY
- ▲ 3.95%
- F500 in state
- 110
Industry mix (Fortune 500 HQ in TX)
| Industry | F500 HQs | Revenue |
|---|---|---|
| Energy | 16 | $1,198B |
|
||
| Technology | 5 | $198B |
|
||
| Engineering / Construction | 4 | $72B |
|
||
| Energy Services | 3 | $60B |
|
||
| Utilities | 3 | $41B |
|
||
| Healthcare | 2 | $330B |
|
||
Price history
+124.5% since first listed2 events — show timeline
- 2026-06-11 Listed $110,000 FSBO.com
- 2017-07-19 Price Changed $49,000 MCALLENMLS
Property tax history
+13.0%/yrLatest (2025): $2,381 · +9.8% YoY. Source: county tax records.
Cash-flow waterfall
monthlySold comps — $/sqft
last 12 mo · ≤1 miLoading sold comps…