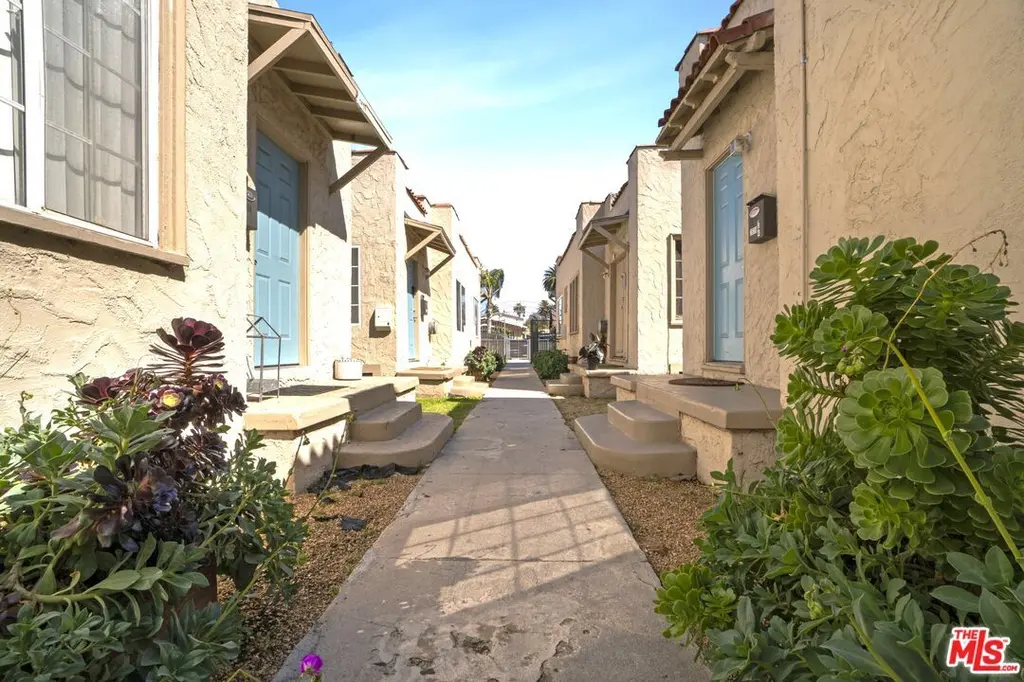
 8-Plex
2637 S Redondo Blvd · Los Angeles, CA
Flood risk 5/10 · Moderate
- FEMA flood zone
- X (unshaded)
- Chance of flooding over 30 yrs
- 0.4%
- Est. flood insurance / yr
- $507 – $1,088
Fire risk 1/10 · Minimal
- Est. fire insurance / yr
- $659 – $1,223
Heat risk 6/10 · Moderate
- Hot days now (above 88°F)
- 7 days/yr
- Hot days in 30 yrs
- 21 days/yr
Wind risk 1/10 · Minimal
- Chance of severe wind over 30 yrs
- —
Air-quality risk 4/10 · Minor
- Unhealthy air days now
- 6 days/yr
- Unhealthy air days in 30 yrs
- 7 days/yr
Risk factors via First Street. Map © Google.
Why this score? — see what drove the C- grade
The composite is a weighted blend of 9 inputs, each scored 0–100. Each bar is that input's sub-score; the figure is the points it added to the 100-point composite (weight × sub-score).
- Cash flow +25.0/30.0
- DSCR +8.2/10.0
- 1% rule +6.0/10.0
- Schools +3.6/10.0
- Livability +3.4/5.0
- Rent growth +2.8/5.0
- Condition / age +2.5/5.0
- ARV discount +0.0/15.0
- Appreciation +0.0/10.0
$1,695,000
🖨 Deal sheet 📄 Offer letter ✓ Due diligence
Multi-family units
County records classify this as Multi-Family (5+ Unit). Listing-text estimate: 8 units. confirmed
5+ unit building — per-unit beds/baths from public records are typically unavailable; the breakdown below (if shown) is an estimate from the listing text.
Listing remarks MLS
2637 S Redondo Blvd is a well maintained 8-unit garden-style apartment building located in the West Adams neighborhood of Los Angeles. The property's unit mix consists of eight open concept 1+1's, seven of which have been extensively remodeled to include new paint, laminate flooring, windows, kitchens, and bathrooms. The exterior of the building has also been painted and re-landscaped. Each unit has its own water heater and is individually metered for gas and electricity. Located just minutes away from Culver City, Mid City, and the University of Southern California, 2637 S Redondo Blvd provides residents with a central starting point for commuting. The property boasts a fantastic 84 walk score and is located just 0.7 miles away from the Expo/La Brea Metro station and 0.5 miles from the nearest I-10 freeway on-ramp. Tenants can enjoy a variety of new area amenities featured in the ever-evolving West Adams neighborhood. Tenants with children have numerous nearby parks and schools to choose from, including Rancho Cienega Recreation Center and Cienega Elementary School. With 2637 S Redondo Blvd, investors can hedge against inflation, leverage tax advantages, and add more value.
Key facts
- 84 walk score
- Laminate flooring
- Individually metered
Tags
Neighborhood map
What this means for you Summary
Snapshot
- This is a 8 × 1-bed/1-bath units multifamily listed at $1.70M.
Deal economics
- At list price, monthly cash flow is $4k ($44k/yr) — positive. Per door: $461/mo.
- The deal already cash-flows at list — no discount required.
- Meets the 1% rule at list price ($19k rent vs $1.70M).
- Recommended offer: $1.54M (9.0% below list) — sets the bar for market timing.
- Cap rate 8.9% vs local median 2.1% in Los Angeles — top-decile yield for the area; either an underpriced asset or a hidden risk that comps aren't pricing in. Stress-test before assuming the spread holds.
Location & tenants
- Location reads 68/100 on livability (#273 in CA) — a middle-class / working-renter tenant base. Strengths: amenities A+, commute A+, employment B; Watch: health & safety C-, schools D+, crime F.
- Los Angeles Unified (urban): math 29% / reading 54% proficiency, ranked #223 of 517 in CA (top 43%) — families likely to look elsewhere, expect single-tenant / working-renter base with shorter leases; 67% free/reduced lunch — lower-income household profile, screen leases tightly.
- Market conditions: Rents rising (+1.1%/yr); 149 active listings in the ZIP; 40 comparable units currently listed for rent nearby; rentals at typical pace (median 25d on market — plan ~3-4 weeks tenant-placement turnaround); 19,697 units permitted in Los Angeles County in 2024 (9,426 in 5+ unit buildings).
- At $18,600/mo this rent would consume 304% of the median local household income ($74k/yr) (locally 3450% of renters already pay >50% of income on rent) — very limited rent-growth headroom before tenants either downsize or default.
Forward outlook
- Local home prices are declining (-3.0%/yr); year-one equity from $12k of loan paydown is wiped out by about $51k of value loss. Plan a longer hold.
- Los Angeles County population projected at +9% by 2050 — modest demand growth; plan on rents tracking national, not racing it.
Negotiation context
- It's been on market 119 days — a 9% lower offer ($1.54M) is reasonable based on typical stale-listing flexibility.
- 6 sale attempts since 10y ago with the ask held roughly flat each time — persistent listings suggest the price (not the market) is what's stuck; bring a comps-based counter.
- Current owner paid $1.15M; 47% above their basis — modest negotiation headroom, anchor on the comps not their cost.
Risks & watch-outs
- Watch-outs: built in 1923 — expect roof / HVAC / electrical / plumbing capex.
- Climate carrying-cost: moderate flood risk; extreme-heat days projected 7→21/yr by 2055 (HVAC capex compounding) — expect insurance premiums to compound above CPI over the hold.
Questions for the listing agent
- It's been on market 119 days. Have you received any prior offers? Is the seller open to a 9% concession, seller financing, or rate buy-down credit?
- Can we see the unit-by-unit rent roll, current vacancy, and any below-market leases? What's the average tenancy length?
- What capital expenditures (roof, boiler, parking lot, exteriors) have been made in the last 5 years, and what's planned in the next 2?
- Built in 1923 — when were the roof, HVAC, electrical panel, plumbing, and water heater last replaced?
- Why hasn't it sold? Are there any deal-killer items the seller is aware of (foundation, flood, title, zoning, code violations)?
- Is there a deadline driving the sale (1031 exchange, divorce, estate, relocation)? That informs how much negotiation room exists.
- Schools are D-rated, which usually means shorter tenancies and higher turnover. Who's the typical renter profile here, and what's been the actual vacancy rate?
- Crime grade is F in this area — have there been break-ins, vandalism, or insurance claims at this property in the last 3 years? What carrier currently insures it and at what premium?
- What's the average days-on-market for RENTAL listings here right now (not sales)? A rising rental-DOM trend means longer vacancies and softer asking-rent achievability than the comps imply.
- What's the recent tenant-quality profile in this submarket — average credit score on applications, eviction rate, late-payment / NSF rate, and stable-employment percentage? A property-management company in the area should have these aggregated.
- How much new apartment / multifamily construction is in the pipeline within 1–3 miles? Heavy new supply (>2% of stock underway) typically softens rents 12–24 months out; light construction supports rent growth.
Investment metrics
- 1% rule
- 1.10% ✓
- Cap rate
- 8.91%
- Cash-on-cash
- 9.33%
- DSCR
- 1.42
- GRM
- 7.6
CMA / ARV
- ARV (median comp)
- $1,228,617
- List price
- $1,695,000
- Delta
- 37.96%
- Verdict
- OVERPRICED
- Comps
- 20 within 1.0 mi
Projected returns pro-forma
-3.0% appreciation · 1.12% rent growth · sell at horizon
- IRR
- -4.3%
- Equity multiple
- 0.84×
- Total profit
- $-74,288
- Equity at exit
- $252,730
- IRR
- 3.2%
- Equity multiple
- 1.21×
- Total profit
- $100,896
- Equity at exit
- $146,553
Cash invested: $474,600 (down + closing). Projections, not guarantees.
Landlord ↔ Tenant lean methodology
- Overall (CITY)
- 0 Strongly Tenant-Friendly
- State California
- 18 Strongly Tenant-Friendly · D+13
- County
- — inherits STATE
- City Los Angeles
- 0 Strongly Tenant-Friendly · D+22
ZIP-level market 90016
- Rents YoY
- 1.1%
- Active inventory
- 149
- Price-to-rent
- 60.8×
Monthly cashflow live
- Estimated rent
- $18,600 high interval (Pro) →
- Mortgage (P&I)
- −$8,889
- Tax from tax record
- −$1,408 /mo · $16,898/yr
- Insurance
- −$706
- HOA
- −$0
- Vacancy / Maint / Mgmt
- −$3,906
- Net cashflow
- $3,691
Break-even live
8-unit breakdown (identical units grouped — click to expand)
| Units | Beds | Baths | Est. rent |
|---|---|---|---|
| 8× units | 1 | 1 | $18,600 |
| #1 | 1 | 1 | $2,325 |
| #2 | 1 | 1 | $2,325 |
| #3 | 1 | 1 | $2,325 |
| #4 | 1 | 1 | $2,325 |
| #5 | 1 | 1 | $2,325 |
| #6 | 1 | 1 | $2,325 |
| #7 | 1 | 1 | $2,325 |
| #8 | 1 | 1 | $2,325 |
| Total (8 units) | $18,600 | ||
UW: 25.0% down · 7.5% · 30yr · 1.5% tax · 5.0% vac · 8.0% maint · 8.0% mgmt
Financing live
Cash to close
- Down payment
- $423,750
- Closing costs
- $50,850
- Reserves months
- —
- Total cash needed
- —
Loan-product check · same deal, 3 products live
Conventional
25% down · 7.5% · 30yr
- Down + closing
- —
- Monthly P&I
- —
- Monthly cashflow
- —
- DSCR
- —
- Eligible?
- —
Personal DTI + credit; lowest rate.
DSCR
20% down · 8.5% · 30yr
- Down + closing
- —
- Monthly P&I
- —
- Monthly cashflow
- —
- DSCR
- —
- Eligible?
- —
No personal income docs; deal must DSCR.
Hard money
10% down · 12.0% · 12mo
- Down + closing
- —
- Monthly P&I
- —
- Monthly cashflow
- —
- DSCR
- —
- Eligible?
- —
Short-term bridge; refi at stabilization.
Rent comps 40 comps
| Address | Beds | Baths | Sqft | Rent | $/sqft | DOM | Units | Dist |
|---|---|---|---|---|---|---|---|---|
| 5218 1/2 Westhaven St Unit 27005 Los Angeles, CA | 2.0 | 1.0 | 1000 | $2,300 | $2.30 | 44d | 1 | 0.08mi |
| 5217 W Adams Blvd Los Angeles, CA | 1.0–2.0 | 1.0–2.0 | 807 | $3,550 | $4.40 | 8d | 20 | 0.14mi |
| 2826 Alsace Ave Los Angeles, CA | 2.0 | 1.5 | 950 | $3,200 | $3.37 | 44d | 1 | 0.14mi |
| 2831 S Sycamore Ave Los Angeles, CA | 2.0 | 1.0 | 800 | $2,400 | $3.00 | 44d | 1 | 0.16mi |
| 5181 W Adams Blvd Los Angeles, CA | 1.0 | 1.0 | 665 | $2,895 | $4.35 | 8d | 3 | 0.18mi |
| 2841 S Sycamore Ave Unit 3 Los Angeles, CA | 2.0 | 1.0 | 900 | $2,495 | $2.77 | 2d | 1 | 0.18mi |
| 2841 S Sycamore Ave Unit 3 Los Angeles, CA | 2.0 | 1.0 | 900 | $2,500 | $2.78 | 44d | 1 | 0.18mi |
| 2815 S Redondo Blvd Los Angeles, CA | 2.0 | 1.0 | 700 | $3,249 | $4.64 | 17d | 1 | 0.23mi |
| 2841 S Redondo Blvd Unit 2841 Los Angeles, CA | 2.0 | 2.0 | 1100 | $2,895 | $2.63 | 44d | 1 | 0.27mi |
| 5246 Blackwelder St Unit 8 Los Angeles, CA | 2.0 | 1.0 | 850 | $2,595 | $3.05 | 44d | 1 | 0.29mi |
| 5347 Blackwelder St Apt 3 Los Angeles, CA | 2.0 | 1.0 | 700 | $2,695 | $3.85 | 17d | 1 | 0.33mi |
| 5459 Carlin St Unit 3 Los Angeles, CA | 2.0 | 1.0 | 850 | $2,295 | $2.70 | 3d | 1 | 0.33mi |
| 5459 Carlin St Unit 3 Los Angeles, CA | 2.0 | 1.0 | 630 | $2,395 | $3.80 | 25d | 1 | 0.33mi |
| 2431 S Ridgeley Dr Los Angeles, CA | 2.0 | 1.0 | 549 | $2,172 | $3.96 | 2d | 3 | 0.34mi |
| 2419 S Ridgeley Dr Los Angeles, CA | 2.0 | 1.0 | 540 | $2,195 | $4.06 | 17d | 1 | 0.34mi |
| 2419 S Ridgeley Dr Los Angeles, CA | 2.0 | 1.0 | 540 | $2,195 | $4.06 | 25d | 1 | 0.34mi |
| 2401 S Sycamore Ave Unit 6 Los Angeles, CA | 2.0 | 1.0 | 1000 | $2,595 | $2.60 | 8d | 1 | 0.36mi |
| 2529 Hauser Blvd Unit 2529 1/2 Los Angeles, CA | 1.0 | 1.0 | 650 | $2,450 | $3.77 | 25d | 1 | 0.37mi |
| 2529 Hauser Blvd Los Angeles, CA | 1.0 | 1.0 | 650 | $2,450 | $3.77 | 22d | 1 | 0.37mi |
| 2325 1/2 S Sycamore Ave Los Angeles, CA | 2.0 | 1.0 | 672 | $2,650 | $3.94 | 15d | 1 | 0.37mi |
| 2635 Hauser Blvd Rm 5 Los Angeles, CA | 1.0 | 1.0 | 1000 | $950 | $0.95 | 25d | 1 | 0.38mi |
| 2246 Ridgeley Dr Unit 3 Los Angeles, CA | 3.0 | 2.0 | 1013 | $3,000 | $2.96 | 25d | 1 | 0.39mi |
| 5413 Homeside Ave Los Angeles, CA | 2.0 | 1.5 | 800 | $3,495 | $4.37 | 44d | 1 | 0.39mi |
| 5458 Smiley Dr Unit 2 Los Angeles, CA | 2.0 | 1.0 | 700 | $2,600 | $3.71 | 18d | 1 | 0.40mi |
| 2233 S Ridgeley Dr Los Angeles, CA | 2.0 | 1.5 | 950 | $2,550 | $2.68 | 25d | 1 | 0.43mi |
| 2233 S Ridgeley Dr Los Angeles, CA | 2.0 | 1.5 | 950 | $2,395 | $2.52 | 44d | 1 | 0.43mi |
| 2233 S Ridgeley Dr Los Angeles, CA | 2.0 | 2.0 | 1000 | $2,895 | $2.90 | 13d | 1 | 0.43mi |
| 2922 Hauser Blvd Los Angeles, CA | 3.0 | 2.0 | 925 | $2,895 | $3.13 | 44d | 1 | 0.50mi |
| 2210 S Sycamore Ave Unit 3 Los Angeles, CA | 2.0 | 1.0 | 900 | $2,395 | $2.66 | 44d | 1 | 0.51mi |
| 2501 S West View St Los Angeles, CA | 1.0 | 1.0 | 625 | $2,345 | $3.75 | 19d | 2 | 0.53mi |
| 2010 Hauser Blvd Los Angeles, CA | 3.0 | 1.0 | 950 | $2,595 | $2.73 | 2d | 1 | 0.56mi |
| 2500 Clyde Ave Los Angeles, CA | 2.0 | 1.5 | 930 | $2,450 | $2.63 | 44d | 1 | 0.57mi |
| 2741 S Palm Grove Ave Los Angeles, CA | 3.0 | 2.0 | 1122 | $4,400 | $3.92 | 25d | 1 | 0.59mi |
| 1933 Carmona Ave Unit 1937 Los Angeles, CA | 2.0 | 1.0 | 750 | $2,295 | $3.06 | 44d | 1 | 0.62mi |
| 2542 Thurman Ave Los Angeles, CA | 2.0 | 1.0 | 800 | $1,999 | $2.50 | 10d | 1 | 0.62mi |
| 5225 20th St Unit 1/2 Los Angeles, CA | 1.0 | 1.0 | 580 | $2,350 | $4.05 | 8d | 1 | 0.67mi |
| 1835 Carmona Ave Los Angeles, CA | 3.0 | 2.0 | 1000 | $2,750 | $2.75 | 44d | 1 | 0.70mi |
| 3561 Cochran Ave Unit 1/2 Los Angeles, CA | 1.0 | 1.0 | 553 | $2,800 | $5.06 | 44d | 1 | 0.70mi |
| 2653 Vineyard Ave Los Angeles, CA | 2.0 | 2.5 | 745 | $2,995 | $4.02 | 8d | 1 | 0.71mi |
| 4861 W 23rd St Los Angeles, CA | 1.0 | 1.0 | 700 | $2,000 | $2.86 | 44d | 1 | 0.72mi |
Listing history 25 events
-
2026-06-18days on market $1,695,000 Active 119 DOM
-
2026-06-17days on market $1,695,000 Active 118 DOM
-
2026-06-16days on market $1,695,000 Active 117 DOM
-
2026-06-15days on market $1,695,000 Active 116 DOM
-
2026-06-13days on market $1,695,000 Active 114 DOM
-
2026-06-09days on market $1,695,000 Active 110 DOM
-
2026-06-08days on market $1,695,000 Active 109 DOM
-
2026-06-07days on market $1,695,000 Active 108 DOM
-
2026-06-04days on market $1,695,000 Active 105 DOM
-
2026-06-03days on market $1,695,000 Active 104 DOM
-
2026-06-02days on market $1,695,000 Active 103 DOM
-
2026-06-01days on market $1,695,000 Active 102 DOM
-
2026-05-31days on market $1,695,000 Active 101 DOM
-
2026-02-19$1,695,000 Active 1193-char remark
Show marketing remark (1193 chars)
2637 S Redondo Blvd is a well maintained 8-unit garden-style apartment building located in the West Adams neighborhood of Los Angeles. The property's unit mix consists of eight open concept 1+1's, seven of which have been extensively remodeled to include new paint, laminate flooring, windows, kitchens, and bathrooms. The exterior of the building has also been painted and re-landscaped. Each unit has its own water heater and is individually metered for gas and electricity. Located just minutes away from Culver City, Mid City, and the University of Southern California, 2637 S Redondo Blvd provides residents with a central starting point for commuting. The property boasts a fantastic 84 walk score and is located just 0.7 miles away from the Expo/La Brea Metro station and 0.5 miles from the nearest I-10 freeway on-ramp. Tenants can enjoy a variety of new area amenities featured in the ever-evolving West Adams neighborhood. Tenants with children have numerous nearby parks and schools to choose from, including Rancho Cienega Recreation Center and Cienega Elementary School. With 2637 S Redondo Blvd, investors can hedge against inflation, leverage tax advantages, and add more value.
-
2024-04-10Active
-
2020-11-16price
-
2020-11-04Active
-
2020-03-06Active
-
2016-09-25soldstatus $1,150,000 Closed
-
2016-09-25soldstatus $1,150,000
-
2016-09-01soldstatus $1,150,000
-
2016-06-07status Pending
-
2016-05-20$1,100,000 Active
-
2016-05-19$1,100,000
-
1976-07-26soldstatus $38,000
ⓘ Source: listings_history table (triggers on properties + properties_extension) + one-shot
backfill from property_details.listing_events for pre-trigger history.
Tax reassessment forecast CA · Resets to sale price
- Current annual tax
- $16,898 · $1,408/mo
- Projected year-2 tax
- $16,898 · $1,408/mo
- Expected delta
- $0/yr ($0/mo · 0.0%)
ⓘ Screening estimate from a state-policy table — verify with the county assessor before closing.
Climate risk First Street
- Flood 5/10 Major FEMA zone X (unshaded) · 40% chance over 30 yrs
- Wildfire 1/10 Low
- Heat 6/10 Major 7 d/yr ≥88°F today · 21 d/yr by 30 yrs out
- Wind 1/10 Low
- Air quality 4/10 Moderate 6 unhealthy d/yr today · 7 by 30 yrs out
Nearby sold comps map
Loading sold comps map…
Walkable amenities ~0.75 mi
Loading nearby amenities…
Taxation est. · year 1
- Rental income
- $223,200
- − Mortgage interest
- −$94,946
- − Property taxes
- −$16,898
- − Insurance
- −$8,475
- − Repairs & maintenance
- −$17,856
- − Management
- −$17,856
- − Depreciation
- −$49,309
- Taxable income
- $17,859
- Est. tax owed @ 24.0%
- −$4,286
- After-tax cash flow
- $40,003/yr
For passive investors: Depreciation is non-cash, so a rental often shows a tax loss while cash-flowing — sheltering income. Rental losses are passive: they offset passive income freely, and up to $25,000/yr can offset ordinary (W-2) income if you actively participate and your MAGI is under $100k (phasing out to $0 by $150k); unused losses carry forward. On sale, claimed depreciation is recaptured at up to 25%, and gains may owe capital-gains tax (a 1031 exchange can defer both). Figures are a year-1 estimate at your 24.0% rate — not tax advice; consult a CPA.
Schools (NCES district)
- District
- Los Angeles Unified
- NCES district ID
- 0622710
- Math proficiency
- 29% ▼ -4.00%
- Reading proficiency
- 54% ▲ 10.00%
- Median HH income
- $50,403
- Composite
- 35.67/100
- National rank
- #4875
- State rank
- #223 of 517 in CA
Livability — Los Angeles
- Score
- 68/100
- State rank
- #273
- US rank
- #9237
Category grades
Schools grade is shown separately in the Schools card above.
Census & demographics
- Census place
- Los Angeles, CA
- County
- Los Angeles County · 9,444,647 people
- City population
- 3,838,149
- Metro
- Los Angeles-Long Beach-Anaheim, CA
- Population (ZIP)
- 46,457
- Household income
- $73,516
- Rent vs Own
- Severe rent burden
- 3450.0
Population outlook (Los Angeles County) Hauer SSP2
- Today (2025)
- 10,940,515 people
- By 2030
- 11,256,481 · +2.9%
- By 2040
- 11,729,929 · +7.2%
- By 2050
- 11,948,407 · +9.2%
- By 2075
- 11,818,114 · +8.0%
- By 2100
- 10,842,928 · -0.9%
Race, ethnicity, and origin ACS 2023
- Neighborhood character
- Diverse neighborhood (Simpson 0.64)
- Race & ethnicity
- Hispanic / Latino 52% Black 27% Two or more races 18% White 12% Asian 4%
- Hispanic origin (detail)
- Mexican 34%
- Common ancestry
- British 1% Scotch-Irish 1% Romanian 1%
- Foreign-born
- 30% · Canada, South Korea, China
- Languages at home
- 47% English-only · Spanish 47% French/Haitian/Cajun 1% Chinese 1%
Political lean MEDSL · Los Angeles
- 2024 margin
- Solid D (+32.9) · D 64.8% · R 31.9% · Other 3.3%
- 2008→2024 swing
- -7.4pp toward R · 2008: 40.4pp · 2024: 32.9pp
- All cycles
- 2024: D+32.9 2020: D+44.2 2016: D+48.0 2012: D+40.0 2008: D+40.4
Not yet ingested
- Civics
- —
Market trends
- HPI YoY
- ▼ -991.94%
- Current HPI
- 584.0673
- Rent YoY
- ▲ 1.12%
- Metro
- Los Angeles-Long Beach-Anaheim, CA
- State GDP YoY
- ▲ 3.21%
- F500 in state
- 116
Industry mix (Fortune 500 HQ in CA)
| Industry | F500 HQs | Revenue |
|---|---|---|
| Technology | 27 | $1,492B |
|
||
| Financial Services | 3 | $174B |
|
||
| Retail | 3 | $44B |
|
||
| Insurance | 3 | $26B |
|
||
| Media / Entertainment | 2 | $115B |
|
||
| Pharmaceuticals / Biotech | 2 | $62B |
|
||
Price history
+4360.5% since first listed12 events — show timeline
- 2026-02-19 Listed $1,695,000 TheMLS
- 2024-04-10 Listed — TheMLS
- 2020-11-16 Price Changed — TheMLS
- 2020-11-04 Listed — TheMLS
- 2020-03-06 Listed — TheMLS
- 2016-09-25 Sold (MLS) $1,150,000 SDMLS
- 2016-09-25 Sold (MLS) $1,150,000 TheMLS
- 2016-09-01 Sold (Public Records) $1,150,000 Public Records
- 2016-06-07 Pending — TheMLS
- 2016-05-20 Listed $1,100,000 TheMLS
- 2016-05-19 Listed $1,100,000 SDMLS
- 1976-07-26 Sold (Public Records) $38,000 Public Records
Property tax history
+15.1%/yrLatest (2025): $16,898 · +1.2% YoY. Source: county tax records.
Cash-flow waterfall
monthlySold comps — $/sqft
last 12 mo · ≤1 miLoading sold comps…