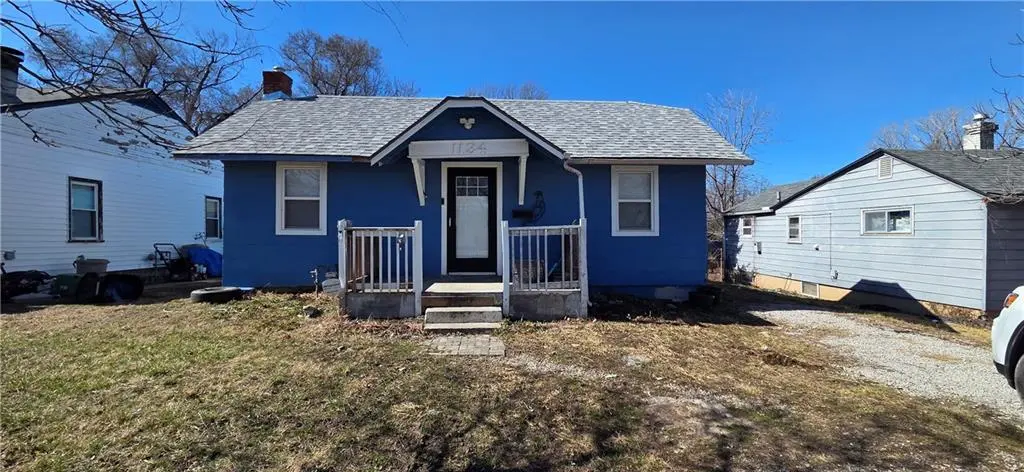
1134 S Haden St · Independence, MO
Flood risk 1/10 · Minimal
- FEMA flood zone
- X (unshaded)
- Chance of flooding over 30 yrs
- 0.0%
- Est. flood insurance / yr
- $473 – $860
Fire risk 1/10 · Minimal
- Est. fire insurance / yr
- $1,054 – $1,958
Heat risk 4/10 · Minor
- Hot days now (above 106°F)
- 7 days/yr
- Hot days in 30 yrs
- 17 days/yr
Wind risk 2/10 · Minimal
- Chance of severe wind over 30 yrs
- —
Air-quality risk 3/10 · Minor
- Unhealthy air days now
- 3 days/yr
- Unhealthy air days in 30 yrs
- 3 days/yr
Risk factors via First Street. Map © Google.
Why this score? — see what drove the C grade
The composite is a weighted blend of 9 inputs, each scored 0–100. Each bar is that input's sub-score; the figure is the points it added to the 100-point composite (weight × sub-score).
- Cash flow +23.4/30.0
- DSCR +7.5/10.0
- ARV discount +7.0/15.0
- 1% rule +5.5/10.0
- Livability +4.1/5.0
- Rent growth +3.4/5.0
- Schools +2.7/10.0
- Condition / age +2.5/5.0
- Appreciation +0.0/10.0
$134,000
🖨 Deal sheet 📄 Offer letter ✓ Due diligence
Key facts
- 5,227 sq ft lot
- Built 1925
- Listed 40 days
Property features AI
Finance
- Financial info: Tax annual amount reported (not displayed per instructions)
- HOA & community: No association fees
Exterior
- Parking: Off-street parking
- Utilities: Public water; Public sewer
- Home design: Single-family residence; Residential property; Ranch style
- Construction: Frame construction; Composition roof; Approximately 101+ years old; Above-grade finished living area reported
- Exterior features: Lot approximately 0.12 acres; Inside city limits
Interior
- Kitchen: Kitchen
- Bedrooms: 3 bedrooms (carpeted)
- Flooring: Carpet in bedrooms
- Bathrooms: 1 full bathroom
- Heating & cooling: Forced air heating; Electric cooling (has cooling)
- Interior features: Ranch floor plan; Basement with inside entrance; 4 total rooms
Neighborhood map
What this means for you Summary
Snapshot
- This is a 3-bed/1.0-bath single-family listed at $134k.
Deal economics
- At list price, monthly cash flow is $247 ($3k/yr) — positive.
- The deal already cash-flows at list — no discount required.
- Meets the 1% rule at list price ($1k rent vs $134k).
- Recommended offer: $130k (3.0% below list) — sets the bar for market timing.
- Cap rate 8.5% vs local median 5.0% in Independence — top-decile yield for the area; either an underpriced asset or a hidden risk that comps aren't pricing in. Stress-test before assuming the spread holds.
Location & tenants
- Location reads 82/100 on livability (#10 in MO, #1,296 nationally) — a professional / high-income tenant draw. Strengths: amenities A+, commute A+, cost of living A+; Watch: schools C-, employment D+, crime F.
- Independence 30 (suburban): math 26% / reading 38% proficiency, ranked #252 of 324 in MO (top 78%) — families likely to look elsewhere, expect single-tenant / working-renter base with shorter leases.
- Market conditions: Rents rising (+3.8%/yr); 125 active listings in the ZIP; 22 comparable units currently listed for rent nearby; rentals at typical pace (median 24d on market — plan ~3-4 weeks tenant-placement turnaround); 4,002 units permitted in Jackson County in 2024 (2,271 in 5+ unit buildings).
- This rent runs 34% of the median local income ($49k/yr) — at the standard rent-burdened threshold; future hikes will face affordability resistance.
Forward outlook
- Local home prices are declining (-3.0%/yr); year-one equity from $926 of loan paydown is wiped out by about $4k of value loss. Plan a longer hold.
- Jackson County population projected at +4% by 2050 — modest demand growth; plan on rents tracking national, not racing it.
Negotiation context
- It's been on market 41 days — a 3% lower offer ($130k) is reasonable based on typical stale-listing flexibility.
- 9 sale attempts since 22y ago with the ask held roughly flat each time — persistent listings suggest the price (not the market) is what's stuck; bring a comps-based counter.
- Current owner paid $35k; list at $134k implies a 283% gain — meaningful room to come down on a strong offer.
Risks & watch-outs
- Watch-outs: built in 1925 — expect roof / HVAC / electrical / plumbing capex.
Questions for the listing agent
- It's been on market 41 days. Have you received any prior offers? Is the seller open to a 3% concession, seller financing, or rate buy-down credit?
- Built in 1925 — when were the roof, HVAC, electrical panel, plumbing, and water heater last replaced?
- Is there a deadline driving the sale (1031 exchange, divorce, estate, relocation)? That informs how much negotiation room exists.
- Crime grade is F in this area — have there been break-ins, vandalism, or insurance claims at this property in the last 3 years? What carrier currently insures it and at what premium?
- What's the average days-on-market for RENTAL listings here right now (not sales)? A rising rental-DOM trend means longer vacancies and softer asking-rent achievability than the comps imply.
- What's the recent tenant-quality profile in this submarket — average credit score on applications, eviction rate, late-payment / NSF rate, and stable-employment percentage? A property-management company in the area should have these aggregated.
- How much new for-sale + rental construction is in the pipeline within 1–3 miles? Heavy new supply typically softens prices + rents 12–24 months out; constrained supply supports both.
Investment metrics
- 1% rule
- 1.05% ✓
- Cap rate
- 8.51%
- Cash-on-cash
- 7.91%
- DSCR
- 1.35
- GRM
- 8.0
CMA / ARV
- ARV (median comp)
- $132,481
- List price
- $134,000
- Delta
- 1.15%
- Verdict
- FAIR
- Comps
- 20 within 1.0 mi
Show comp detail 12 sales within ~0.75 mi
| Address | Dist | Beds/Ba | Sqft | Sold | Price | $/sf | Match |
|---|---|---|---|---|---|---|---|
| 2119 S Lees Summit Rd S | 0.40mi | 3/1.0 | 1,146 (+0%) | 1mo | $185,000 | $161 | 80 |
| 1040 Stone St | 0.16mi | 2/2.0 (-1) | 1,176 (+3%) | 1mo | $209,900 | $178 | 78 |
| 1124 S Haden St | 0.05mi | 2/1.0 (-1) | 1,032 (-10%) | 2mo | $135,000 | $131 | 75 |
| 1340 S Emery Ave | 0.65mi | 3/1.0 | 1,160 (+2%) | 2mo | $95,000 | $82 | 65 |
| 217 S Hunter St | 0.73mi | 3/1.0 | 1,120 (-2%) | 0mo | $170,000 | $152 | 63 |
| 1319 S Crane St | 0.41mi | 2/1.0 (-1) | 1,028 (-10%) | 4mo | $155,000 | $151 | 57 |
| 1410 S Logan St | 0.49mi | 3/2.0 | 1,026 (-10%) | 5mo | $209,900 | $205 | 52 |
| 16208 E Sea Ave | 0.71mi | 3/2.0 | 1,211 (+6%) | 2mo | $190,000 | $157 | 51 |
| 930 S Leslie St | 0.54mi | 3/2.5 | 1,276 (+12%) | 2mo | $200,000 | $157 | 47 |
| 325 S Crane St | 0.65mi | 3/1.0 | 996 (-13%) | 4mo | $124,000 | $124 | 46 |
| 2705 S Haden Ct | 0.62mi | 3/2.0 | 1,280 (+12%) | 2mo | $350,000 | $273 | 45 |
| 1339 S Hocker Ave | 0.68mi | 4/2.0 (+1) | 1,236 (+8%) | 2mo | $250,000 | $202 | 43 |
Match score weights: distance 35% · size 25% · config 20% · recency 20%. Top-matched comps best support the ARV.
Projected returns pro-forma
-3.0% appreciation · 3.79% rent growth · sell at horizon
- IRR
- -3.4%
- Equity multiple
- 0.87×
- Total profit
- $-4,856
- Equity at exit
- $19,980
- IRR
- 7.1%
- Equity multiple
- 1.55×
- Total profit
- $20,670
- Equity at exit
- $11,586
Cash invested: $37,520 (down + closing). Projections, not guarantees.
Landlord ↔ Tenant lean methodology
- Overall (STATE)
- 81 Strongly Landlord-Friendly
- State Missouri
- 81 Strongly Landlord-Friendly · R+10
- County
- — inherits STATE
- City
- — inherits STATE
ZIP-level market 64050
- Home prices YoY
- -15.5%
- Rents YoY
- 3.8%
- Active inventory
- 125
- Price-to-rent
- 8.0×
Monthly cashflow live
- Estimated rent
- $1,404 high interval (Pro) →
- Mortgage (P&I)
- −$703
- Tax from tax record
- −$103 /mo · $1,239/yr
- Insurance
- −$56
- HOA
- −$0
- Vacancy / Maint / Mgmt
- −$295
- Net cashflow
- $247
Break-even live
UW: 25.0% down · 7.5% · 30yr · 1.5% tax · 5.0% vac · 8.0% maint · 8.0% mgmt
Financing live
Cash to close
- Down payment
- $33,500
- Closing costs
- $4,020
- Reserves months
- —
- Total cash needed
- —
Loan-product check · same deal, 3 products live
Conventional
25% down · 7.5% · 30yr
- Down + closing
- —
- Monthly P&I
- —
- Monthly cashflow
- —
- DSCR
- —
- Eligible?
- —
Personal DTI + credit; lowest rate.
DSCR
20% down · 8.5% · 30yr
- Down + closing
- —
- Monthly P&I
- —
- Monthly cashflow
- —
- DSCR
- —
- Eligible?
- —
No personal income docs; deal must DSCR.
Hard money
10% down · 12.0% · 12mo
- Down + closing
- —
- Monthly P&I
- —
- Monthly cashflow
- —
- DSCR
- —
- Eligible?
- —
Short-term bridge; refi at stabilization.
Rent comps 22 comps
| Address | Beds | Baths | Sqft | Rent | $/sqft | DOM | Units | Dist |
|---|---|---|---|---|---|---|---|---|
| 1118 S Pope Ave Independence, MO | 2.0 | 1.0 | 988 | $1,195 | $1.21 | 16d | 1 | 0.48mi |
| 315 S Crane St Unit A Independence, MO | 3.0 | 1.0 | 1150 | $1,250 | $1.09 | 24d | 1 | 0.69mi |
| 315 S Crane St Unit A Independence, MO | 3.0 | 1.0 | 1150 | $1,250 | $1.09 | 44d | 1 | 0.69mi |
| 8061/2 E Devon St Independence, MO | 2.0 | 1.0 | 824 | $1,195 | $1.45 | 8d | 1 | 0.72mi |
| 414 Hillside Dr Independence, MO | 2.0 | 1.0–2.0 | 627 | $1,199 | $1.91 | 44d | 3 | 0.96mi |
| 2905 S Lee's Summit Rd Independence, MO | 1.0–3.0 | 1.0–2.0 | 853 | $1,746 | $2.05 | 2d | 48 | 1.09mi |
| 16428 E 29th Street Ct S Unit B Independence, MO | 2.0 | 1.5 | 826 | $1,277 | $1.55 | 24d | 1 | 1.10mi |
| 16801 E Larkspur Ln Independence, MO | 1.0–3.0 | 1.0–2.0 | 1042 | $1,549 | $1.49 | 44d | 26 | 1.14mi |
| 16801 E Larkspur Ln Independence, MO | 1.0–3.0 | 1.0–2.0 | 1125 | $1,650 | $1.47 | 2d | 7 | 1.14mi |
| 16301 E 29 St S Independence, MO | 1.0–2.0 | 1.0 | 718 | $1,400 | $1.95 | 16d | 16 | 1.17mi |
| 16421 E 29th Ter S Independence, MO | 3.0 | 2.0 | 1225 | $1,606 | $1.31 | 44d | 1 | 1.17mi |
| 321 W South Ave Unit 8 Independence, MO | 2.0 | 1.5 | 980 | $1,895 | $1.93 | 2d | 1 | 1.23mi |
| 321 W South Ave Unit 11 Independence, MO | 3.0 | 2.0 | 1000 | $1,275 | $1.27 | 21d | 1 | 1.23mi |
| 321 W South Ave Unit 9 Independence, MO | 2.0 | 1.5 | 980 | $1,295 | $1.32 | 44d | 1 | 1.23mi |
| 1404 S Osage St Independence, MO | 4.0 | 2.0 | 1300 | $1,750 | $1.35 | 15d | 1 | 1.27mi |
| 630 N Hocker Ave Independence, MO | 3.0 | 1.0 | 864 | $1,325 | $1.53 | 24d | 1 | 1.36mi |
| 1314 E Frederick St Independence, MO | 2.0 | 1.0 | 800 | $999 | $1.25 | 44d | 1 | 1.37mi |
| 902 E Frederick St Independence, MO | 2.0 | 1.0 | 850 | $995 | $1.17 | 21d | 1 | 1.41mi |
| 1502 S Pleasant St Independence, MO | 3.0 | 2.0 | 1200 | $1,399 | $1.17 | 44d | 1 | 1.41mi |
| 16012 E T C Lea Rd Unit C Independence, MO | 2.0 | 1.0 | 800 | $795 | $0.99 | 24d | 1 | 1.42mi |
| 1900 S Brookstone Village Dr Independence, MO | 1.0–3.0 | 1.0–2.0 | 951 | $1,797 | $1.89 | 2d | 8 | 1.43mi |
| 1021 N Kiger Rd Independence, MO | 3.0 | 2.0 | 1200 | $1,500 | $1.25 | 17d | 1 | 1.46mi |
Listing history 35 events
-
2026-06-03days on market $134,000 Active 41 DOM
-
2026-06-02days on market $134,000 Active 40 DOM
-
2026-06-01days on market $134,000 Active 39 DOM
-
2026-05-31days on market $134,000 Active 38 DOM
-
2026-05-10historical $1,195
-
2026-04-23$134,000 Active
-
2026-04-02price $1,195
-
2026-03-11price $1,250
-
2026-03-06$1,000
-
2025-08-31historical
-
2025-06-12price $130,000
-
2025-04-13$134,900 Active
-
2024-08-31historical
-
2024-06-15price $134,950
-
2024-05-29status Active
-
2024-05-12status Pending
-
2024-03-28price $139,950
-
2024-02-25price $144,950
-
2024-02-02$149,950 Active
-
2020-08-14soldstatus $35,000
-
2020-08-13soldstatus Closed
-
2020-08-04status Pending
-
2020-06-26price $44,900
-
2020-05-26price $49,900
-
2020-04-15price $54,900
-
2020-04-10soldstatus Closed
-
2020-02-21$64,900 Active
-
2020-01-03status Pending
-
2019-12-17$5,250 Active
-
2019-12-05historical
-
2019-06-17$55,250 Active
-
2004-10-22soldstatus
-
2004-10-15soldstatus
-
2004-02-21$49,900
-
1980-01-29soldstatus
ⓘ Source: listings_history table (triggers on properties + properties_extension) + one-shot
backfill from property_details.listing_events for pre-trigger history.
Tax reassessment forecast MO · Resets to sale price
- Current annual tax
- $1,239 · $103/mo
- Projected year-2 tax
- $1,300 · $108/mo
- Expected delta
- +$61/yr (+$5/mo · 4.9%)
ⓘ Screening estimate from a state-policy table — verify with the county assessor before closing.
Climate risk First Street
- Flood 1/10 Low FEMA zone X (unshaded) · 0% chance over 30 yrs
- Wildfire 1/10 Low
- Heat 4/10 Moderate 7 d/yr ≥106°F today · 17 d/yr by 30 yrs out
- Wind 2/10 Low
- Air quality 3/10 Moderate 3 unhealthy d/yr today · 3 by 30 yrs out
Nearby sold comps map
Loading sold comps map…
Walkable amenities ~0.75 mi
Loading nearby amenities…
Taxation est. · year 1
- Rental income
- $16,847
- − Mortgage interest
- −$7,506
- − Property taxes
- −$1,239
- − Insurance
- −$670
- − Repairs & maintenance
- −$1,348
- − Management
- −$1,348
- − Depreciation
- −$3,898
- Taxable income
- $838
- Est. tax owed @ 24.0%
- −$201
- After-tax cash flow
- $2,767/yr
For passive investors: Depreciation is non-cash, so a rental often shows a tax loss while cash-flowing — sheltering income. Rental losses are passive: they offset passive income freely, and up to $25,000/yr can offset ordinary (W-2) income if you actively participate and your MAGI is under $100k (phasing out to $0 by $150k); unused losses carry forward. On sale, claimed depreciation is recaptured at up to 25%, and gains may owe capital-gains tax (a 1031 exchange can defer both). Figures are a year-1 estimate at your 24.0% rate — not tax advice; consult a CPA.
Schools (NCES district)
- District
- Independence 30
- NCES district ID
- 2915480
- Math proficiency
- 26% ▼ -8.00%
- Reading proficiency
- 38% ▼ -5.00%
- Median HH income
- $41,843
- Composite
- 27.04/100
- National rank
- #7054
- State rank
- #252 of 324 in MO
Livability — Independence
- Score
- 82/100
- State rank
- #10
- US rank
- #1296
Category grades
Schools grade is shown separately in the Schools card above.
Census & demographics
- Census place
- Independence, MO
- County
- Jackson County · 687,798 people
- City population
- 117,675
- Metro
- Kansas City, MO-KS
- Population (ZIP)
- 21,079
- Household income
- $48,834
- Rent vs Own
- Severe rent burden
- 972.0
Population outlook (Jackson County) Hauer SSP2
- Today (2025)
- 719,589 people
- By 2030
- 731,456 · +1.6%
- By 2040
- 746,689 · +3.8%
- By 2050
- 749,289 · +4.1%
- By 2075
- 736,227 · +2.3%
- By 2100
- 668,210 · -7.1%
Race, ethnicity, and origin ACS 2023
- Neighborhood character
- Predominantly White (72%)
- Race & ethnicity
- White 72% Hispanic / Latino 11% Two or more races 9% Black 7% Pacific Islander 1%
- Hispanic origin (detail)
- Mexican 8%
- Common ancestry
- Italian 4% Serbian 2% Lithuanian 1%
- Foreign-born
- 5% · Canada
- Languages at home
- 91% English-only · Spanish 7% Other Asian/Pacific 1%
Political lean MEDSL · Jackson
- 2024 margin
- D (+19.3) · D 58.9% · R 39.5% · Other 1.6%
- 2008→2024 swing
- -6.1pp toward R · 2008: 25.4pp · 2024: 19.3pp
- All cycles
- 2024: D+19.3 2020: D+22.0 2016: D+16.6 2012: D+19.0 2008: D+25.4
Not yet ingested
- Civics
- —
Market trends
- HPI YoY
- ▼ -56.24%
- Current HPI
- 305.796
- Rent YoY
- ▲ 3.79%
- Metro
- Kansas City, MO-KS
- State GDP YoY
- ▲ 1.84%
- F500 in state
- 20
Industry mix (Fortune 500 HQ in MO)
| Industry | F500 HQs | Revenue |
|---|---|---|
| Healthcare | 1 | $163B |
|
||
| Insurance | 1 | $21B |
|
||
| Industrial Technology | 1 | $17B |
|
||
| Retail | 1 | $16B |
|
||
| Industrial Distribution | 1 | $10B |
|
||
| Utilities | 1 | $9B |
|
||
Price history
-97.6% since first listed32 events — show timeline
- 2026-06-03 Listing Removed — Heartland MLS as Distributed by MLS Grid
- 2026-05-10 Rental Removed $1,195 BUILDIUM
- 2026-04-23 Listed $134,000 Heartland MLS as Distributed by MLS Grid
- 2026-04-02 Price Changed $1,195 BUILDIUM
- 2026-03-11 Price Changed $1,250 BUILDIUM
- 2026-03-06 Listed for Rent $1,000 BUILDIUM
- 2025-08-31 Listing Removed — Heartland MLS as Distributed by MLS Grid
- 2025-06-12 Price Changed $130,000 Heartland MLS as Distributed by MLS Grid
- 2025-04-13 Listed $134,900 Heartland MLS as Distributed by MLS Grid
- 2024-08-31 Listing Removed — Heartland MLS as Distributed by MLS Grid
- 2024-06-15 Price Changed $134,950 Heartland MLS as Distributed by MLS Grid
- 2024-05-29 Relisted — Heartland MLS as Distributed by MLS Grid
- 2024-05-12 Pending — Heartland MLS as Distributed by MLS Grid
- 2024-03-28 Price Changed $139,950 Heartland MLS as Distributed by MLS Grid
- 2024-02-25 Price Changed $144,950 Heartland MLS as Distributed by MLS Grid
- 2024-02-02 Listed $149,950 Heartland MLS as Distributed by MLS Grid
- 2020-08-14 Sold (Public Records) $35,000 Public Records
- 2020-08-13 Sold (MLS) — Heartland MLS as Distributed by MLS Grid
- 2020-08-04 Pending — Heartland MLS as Distributed by MLS Grid
- 2020-06-26 Price Changed $44,900 Heartland MLS as Distributed by MLS Grid
- 2020-05-26 Price Changed $49,900 Heartland MLS as Distributed by MLS Grid
- 2020-04-15 Price Changed $54,900 Heartland MLS as Distributed by MLS Grid
- 2020-04-10 Sold (MLS) — MARIS as Distributed by MLS Grid
- 2020-02-21 Listed $64,900 Heartland MLS as Distributed by MLS Grid
- 2020-01-03 Pending — MARIS as Distributed by MLS Grid
- 2019-12-17 Listed $5,250 MARIS as Distributed by MLS Grid
- 2019-12-05 Listing Removed — Heartland MLS as Distributed by MLS Grid
- 2019-06-17 Listed $55,250 Heartland MLS as Distributed by MLS Grid
- 2004-10-22 Sold (Public Records) — Public Records
- 2004-10-15 Sold (MLS) — Heartland MLS as Distributed by MLS Grid
- 2004-02-21 Listed $49,900 Heartland MLS as Distributed by MLS Grid
- 1980-01-29 Sold (Public Records) — Public Records
Property tax history
+4.1%/yrLatest (2025): $1,239 · -15.6% YoY. Source: county tax records.
Cash-flow waterfall
monthlySold comps — $/sqft
last 12 mo · ≤1 miLoading sold comps…