 🏗️ New Construction
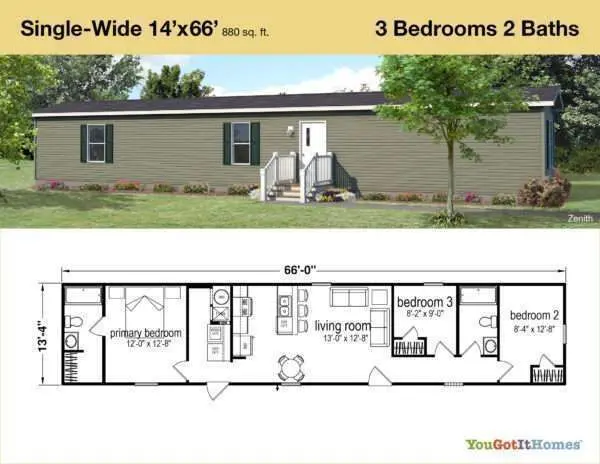
Zenith (Pin Oak) Plan · O'Fallon, MO
Flood risk No data
- FEMA flood zone
- —
- Chance of flooding over 30 yrs
- —
- Est. flood insurance / yr
- —
Fire risk No data
- Est. fire insurance / yr
- —
Heat risk No data
- Hot days now (above threshold)
- —
- Hot days in 30 yrs
- —
Wind risk No data
- Chance of severe wind over 30 yrs
- —
Air-quality risk No data
- Unhealthy air days now
- —
- Unhealthy air days in 30 yrs
- —
Risk factors via First Street. Map © Google.
Why this score? — see what drove the B grade
The composite is a weighted blend of 9 inputs, each scored 0–100. Each bar is that input's sub-score; the figure is the points it added to the 100-point composite (weight × sub-score).
- Cash flow +30.0/30.0
- 1% rule +10.0/10.0
- DSCR +10.0/10.0
- ARV discount +7.5/15.0
- Schools +4.3/10.0
- Condition / age +4.0/5.0
- Rent growth +2.9/5.0
- Livability +2.5/5.0
- Appreciation +0.0/10.0
$64,995
🖨 Deal sheet 📄 Offer letter ✓ Due diligence
Listing remarks MLS
Premier Community * * * Pickleball courts; corn hole; basketball courts; dog park; walking trail; second municipal grade playground! Located along Interstates 64 and 70, and just 40 minutes west of St. Louis in Charles County, Pin Oak Pointe is a lovely, relaxed community with easy convenience to the City of St. Charles, shopping, schools, and major employers like Mastercard, Citi, SAK Construction and a host of other companies. O'Fallon is a great place to live with its close proximity to enriching culture and exciting nightlife, including restaurants, dinner theater and strolling along the Missouri River. It is also a 30-minute drive to Missouri Weinstrasse, Missouri's wine country road, and explore charming towns, award winning wineries and vineyard tours. Community Amenities Basketball Court, Clubhouse, Dog Park, Pavillion, Picnic Area, Pickleball, Playground, Shuffleboard, and Walking/Nature Trails. Stop by today and visit our available homesites!
Key facts
- Dog park
- Corn hole
- Pickleball courts
Tags
Neighborhood map
What this means for you Summary
Snapshot
- This is a 3-bed/2.0-bath single-family listed at $65k. Condition is rated good.
Deal economics
- At list price, monthly cash flow is $292 ($4k/yr) — positive.
- The deal already cash-flows at list — no discount required.
- Meets the 1% rule at list price ($2k rent vs $65k).
- Recommended offer: $57k (12.0% below list) — sets the bar for market timing.
- Cap rate 11.7% vs local median 3.2% in O'Fallon — top-decile yield for the area; either an underpriced asset or a hidden risk that comps aren't pricing in. Stress-test before assuming the spread holds.
Location & tenants
- Location reads: area grade B — affects rentability + tenant quality, not the cash-flow math above.
- Wentzville R-IV (suburban): math 44% / reading 52% proficiency, ranked #32 of 324 in MO (top 10%) — families likely to look elsewhere, expect single-tenant / working-renter base with shorter leases; only 18% free/reduced lunch — higher-income household profile.
- Market conditions: Rents rising (+1.6%/yr); 374 active listings in the ZIP; 13 comparable units currently listed for rent nearby; rentals at typical pace (median 18d on market — plan ~3-4 weeks tenant-placement turnaround); high-income renter base; 2,021 units permitted in St. Charles County in 2024 (568 in 5+ unit buildings).
- This rent is only 17% of the median local income ($124k/yr) — well below the 30% rent-burden line; pricing power to push rent on renewal without tenant pushback.
Forward outlook
- Local home prices are declining (-3.0%/yr); year-one equity from $449 of loan paydown is wiped out by about $2k of value loss. Plan a longer hold.
- St. Charles County population projected at +22% by 2050 — long-run rental-demand tailwind backs the buy-and-hold thesis.
- At projected returns (-3.0% appreciation + 1.6% rent growth), your $18k cash investment doubles in ~8 years — after that, you're playing with house money.
Negotiation context
- It's been on market 323 days — a 12% lower offer ($57k) is reasonable based on typical stale-listing flexibility.
Risks & watch-outs
- Watch-outs: HOA is 36% of rent.
Questions for the listing agent
- It's been on market 323 days. Have you received any prior offers? Is the seller open to a 12% concession, seller financing, or rate buy-down credit?
- What does the HOA fee cover, when was the last increase, and are there any pending special assessments or reserve-fund shortfalls?
- Why hasn't it sold? Are there any deal-killer items the seller is aware of (foundation, flood, title, zoning, code violations)?
- Is there a deadline driving the sale (1031 exchange, divorce, estate, relocation)? That informs how much negotiation room exists.
- What's the average days-on-market for RENTAL listings here right now (not sales)? A rising rental-DOM trend means longer vacancies and softer asking-rent achievability than the comps imply.
- What's the recent tenant-quality profile in this submarket — average credit score on applications, eviction rate, late-payment / NSF rate, and stable-employment percentage? A property-management company in the area should have these aggregated.
- How much new for-sale + rental construction is in the pipeline within 1–3 miles? Heavy new supply typically softens prices + rents 12–24 months out; constrained supply supports both.
Investment metrics
- 1% rule
- 2.67% ✓
- Cap rate
- 11.69%
- Cash-on-cash
- 19.26%
- DSCR
- 1.86
- GRM
- 3.1
CMA / ARV
No comps found within radius.
Projected returns pro-forma
-3.0% appreciation · 1.59% rent growth · sell at horizon
- IRR
- 8.7%
- Equity multiple
- 1.33×
- Total profit
- $6,054
- Equity at exit
- $9,691
- IRR
- 15.9%
- Equity multiple
- 2.17×
- Total profit
- $21,216
- Equity at exit
- $5,620
Cash invested: $18,199 (down + closing). Projections, not guarantees.
Landlord ↔ Tenant lean methodology
- Overall (STATE)
- 81 Strongly Landlord-Friendly
- State Missouri
- 81 Strongly Landlord-Friendly · R+10
- County
- — inherits STATE
- City
- — inherits STATE
ZIP-level market 63368
- Home prices YoY
- -20.7%
- Rents YoY
- 1.6%
- Active inventory
- 374
- Price-to-rent
- 3.1×
Monthly cashflow live
- Estimated rent
- $1,736 high interval (Pro) →
- Mortgage (P&I)
- −$341
- Tax est. 1.5%
- −$81 /mo · $975/yr
- Insurance
- −$27
- HOA
- −$630
- Vacancy / Maint / Mgmt
- −$365
- Net cashflow
- $292
Break-even live
UW: 25.0% down · 7.5% · 30yr · 1.5% tax · 5.0% vac · 8.0% maint · 8.0% mgmt
Financing live
Cash to close
- Down payment
- $16,249
- Closing costs
- $1,950
- Reserves months
- —
- Total cash needed
- —
Loan-product check · same deal, 3 products live
Conventional
25% down · 7.5% · 30yr
- Down + closing
- —
- Monthly P&I
- —
- Monthly cashflow
- —
- DSCR
- —
- Eligible?
- —
Personal DTI + credit; lowest rate.
DSCR
20% down · 8.5% · 30yr
- Down + closing
- —
- Monthly P&I
- —
- Monthly cashflow
- —
- DSCR
- —
- Eligible?
- —
No personal income docs; deal must DSCR.
Hard money
10% down · 12.0% · 12mo
- Down + closing
- —
- Monthly P&I
- —
- Monthly cashflow
- —
- DSCR
- —
- Eligible?
- —
Short-term bridge; refi at stabilization.
Rent comps 13 comps
| Address | Beds | Baths | Sqft | Rent | $/sqft | DOM | Units | Dist |
|---|---|---|---|---|---|---|---|---|
| 13300 Spring Creek Ln O Fallon, MO | 2.0 | 2.0 | 1018 | $1,450 | $1.42 | 7d | 1 | 0.31mi |
| 9201 Spring Creek Ln Unit 9201 O'Fallon, MO | 2.0 | 2.0 | 1014 | $1,600 | $1.58 | 4d | 1 | 0.37mi |
| 9200 Spring Creek Ln O Fallon, MO | 2.0 | 2.0 | 1014 | $1,450 | $1.43 | 43d | 1 | 0.37mi |
| 6303 Spring River Dr O Fallon, MO | 2.0 | 2.0 | 1014 | $1,697 | $1.67 | 43d | 1 | 0.57mi |
| 4103 Spring River Dr Unit 4103 O'Fallon, MO | 2.0 | 2.0 | 1054 | $1,600 | $1.52 | 16d | 1 | 0.59mi |
| 234 Harmony Meadows Ct O Fallon, MO | 2.0 | 2.0 | 1000 | $1,500 | $1.50 | 23d | 1 | 0.64mi |
| 214 Harmony Meadows Ct O Fallon, MO | 2.0 | 2.0 | 1000 | $1,600 | $1.60 | 17d | 1 | 0.64mi |
| 284 Stonewall Creek Dr O Fallon, MO | 2.0 | 2.0 | 1075 | $1,575 | $1.47 | 43d | 1 | 0.89mi |
| 101 Lemon Dr Lake St Louis, MO | 1.0–3.0 | 1.0–2.0 | 1002 | $2,228 | $2.22 | 1d | 16 | 0.90mi |
| 55 Timber Oaks Trl O'Fallon, MO | 2.0 | 2.0 | 985 | $1,600 | $1.62 | 43d | 1 | 0.93mi |
| 100 Big River Dr Lake St Louis, MO | 1.0–4.0 | 1.0–2.5 | 1349 | $2,717 | $2.01 | 43d | 1 | 1.39mi |
| 5114 Welsh Dr Lake St Louis, MO | 2.0 | 2.0 | 1114 | $1,450 | $1.30 | 14d | 1 | 1.46mi |
| 5114 Welsh Dr Lake Saint Louis, MO | 2.0 | 2.0 | 1114 | $1,450 | $1.30 | 10d | 1 | 1.46mi |
HOA detail
- Monthly dues
- $630 · $7,560/yr
Listing history 15 events
-
2026-06-18days on market $64,995 Active 323 DOM
-
2026-06-17days on market $64,995 Active 322 DOM
-
2026-06-16days on market $64,995 Active 321 DOM
-
2026-06-15days on market $64,995 Active 320 DOM
-
2026-06-13days on market $64,995 Active 318 DOM
-
2026-06-13days on market $64,995 Active 317 DOM
-
2026-06-09days on market $64,995 Active 314 DOM
-
2026-06-08days on market $64,995 Active 313 DOM
-
2026-06-08days on market $64,995 Active 312 DOM
-
2026-06-05days on market $64,995 Active 309 DOM
-
2026-06-03days on market $64,995 Active 308 DOM
-
2026-06-02days on market $64,995 Active 307 DOM
-
2026-06-01days on market $64,995 Active 306 DOM
-
2026-05-31days on market $64,995 Active 305 DOM
-
2025-07-31$64,995 Active 970-char remark
Show marketing remark (970 chars)
Premier Community * * * Pickleball courts; corn hole; basketball courts; dog park; walking trail; second municipal grade playground! Located along Interstates 64 and 70, and just 40 minutes west of St. Louis in Charles County, Pin Oak Pointe is a lovely, relaxed community with easy convenience to the City of St. Charles, shopping, schools, and major employers like Mastercard, Citi, SAK Construction and a host of other companies. O'Fallon is a great place to live with its close proximity to enriching culture and exciting nightlife, including restaurants, dinner theater and strolling along the Missouri River. It is also a 30-minute drive to Missouri Weinstrasse, Missouri's wine country road, and explore charming towns, award winning wineries and vineyard tours. Community Amenities Basketball Court, Clubhouse, Dog Park, Pavillion, Picnic Area, Pickleball, Playground, Shuffleboard, and Walking/Nature Trails. Stop by today and visit our available homesites!
ⓘ Source: listings_history table (triggers on properties + properties_extension) + one-shot
backfill from property_details.listing_events for pre-trigger history.
Nearby sold comps map
Loading sold comps map…
Walkable amenities ~0.75 mi
Loading nearby amenities…
Taxation est. · year 1
- Rental income
- $20,829
- − Mortgage interest
- −$3,641
- − Property taxes
- −$975
- − Insurance
- −$325
- − Repairs & maintenance
- −$1,666
- − Management
- −$1,666
- − HOA
- −$7,560
- − Depreciation
- −$1,891
- Taxable income
- $3,105
- Est. tax owed @ 24.0%
- −$745
- After-tax cash flow
- $2,760/yr
For passive investors: Depreciation is non-cash, so a rental often shows a tax loss while cash-flowing — sheltering income. Rental losses are passive: they offset passive income freely, and up to $25,000/yr can offset ordinary (W-2) income if you actively participate and your MAGI is under $100k (phasing out to $0 by $150k); unused losses carry forward. On sale, claimed depreciation is recaptured at up to 25%, and gains may owe capital-gains tax (a 1031 exchange can defer both). Figures are a year-1 estimate at your 24.0% rate — not tax advice; consult a CPA.
Condition & rehab AI · 12 photos
This single-wide mobile home is in good condition with a modern kitchen and bathrooms. It has a good curb appeal and is located in a community with amenities. Minor updates such as painting the exterior and installing smart home devices can further enhance its value.
Value-add opportunities
- Resale Paint exterior siding — Fresh paint can enhance curb appeal and property value.
- Both Replace window treatments — New window treatments can improve both the aesthetic and energy efficiency of the home.
- Both Install smart home devices — Smart home devices can increase convenience and add value to the home, especially for renters.
- Both Upgrade lighting fixtures — Modern lighting fixtures can enhance the home's ambiance and add value to the property.
Renovation cost estimate screening
Value-add ROI direction
- Resale Paint exterior siding — Fresh paint can enhance curb appeal and property value. ↑
- Both Replace window treatments — New window treatments can improve both the aesthetic and energy efficiency of the home. ↑
- Both Install smart home devices — Smart home devices can increase convenience and add value to the home, especially for renters. ↑
- Both Upgrade lighting fixtures — Modern lighting fixtures can enhance the home's ambiance and add value to the property. ↑
ⓘ Cost ranges are severity-bucket heuristics (US national rule-of-thumb). Get contractor quotes + a written scope before underwriting a rehab budget.
Schools (NCES district)
- District
- Wentzville R-IV
- NCES district ID
- 2931650
- Math proficiency
- 44% ▼ -9.00%
- Reading proficiency
- 52% ▼ -7.00%
- Median HH income
- $74,961
- Composite
- 43.49/100
- National rank
- #2994
- State rank
- #32 of 324 in MO
Livability — O'Fallon
No livability data for this city. (Only ~50 U.S. cities are tracked.)
Census & demographics
- Census place
- O'Fallon, MO
- County
- Saint Charles County · 399,703 people
- City population
- 45,862
- Metro
- St. Louis, MO-IL
- Population (ZIP)
- 46,966
- Household income
- $124,297
- Rent vs Own
- Severe rent burden
- 538.0
Population outlook (St. Charles County) Hauer SSP2
- Today (2025)
- 437,857 people
- By 2030
- 461,707 · +5.4%
- By 2040
- 503,222 · +14.9%
- By 2050
- 534,684 · +22.1%
- By 2075
- 597,047 · +36.4%
- By 2100
- 609,682 · +39.2%
Race, ethnicity, and origin ACS 2023
- Neighborhood character
- Predominantly White (84%)
- Race & ethnicity
- White 84% Asian 5% Two or more races 5% Black 4% Hispanic / Latino 3%
- Common ancestry
- Romanian 4% Lithuanian 3% Italian 2%
- Foreign-born
- 6% · Canada, China
- Languages at home
- 93% English-only · Other Asian/Pacific 2% Spanish 2% Other Indo-European 2%
Political lean MEDSL · St. Charles
- 2024 margin
- R (+17.0) · D 40.8% · R 57.8% · Other 1.4%
- 2008→2024 swing
- -7.2pp toward R · 2008: -9.7pp · 2024: -17.0pp
- All cycles
- 2024: R+17.0 2020: R+17.5 2016: R+26.4 2012: R+21.0 2008: R+9.7
Not yet ingested
- Civics
- —
Market trends
- HPI YoY
- ▼ -57.32%
- Current HPI
- 219.7731
- Rent YoY
- ▲ 1.59%
- Metro
- St. Louis, MO-IL
- State GDP YoY
- ▲ 1.84%
- F500 in state
- 20
Industry mix (Fortune 500 HQ in MO)
| Industry | F500 HQs | Revenue |
|---|---|---|
| Healthcare | 1 | $163B |
|
||
| Insurance | 1 | $21B |
|
||
| Industrial Technology | 1 | $17B |
|
||
| Retail | 1 | $16B |
|
||
| Industrial Distribution | 1 | $10B |
|
||
| Utilities | 1 | $9B |
|
||
Price history
1 event — show timeline
- 2025-07-31 Listed $64,995 Zillow
Cash-flow waterfall
monthlySold comps — $/sqft
last 12 mo · ≤1 miLoading sold comps…