205 S Gibbs St · Allenville, IL
Flood risk 1/10 · Minimal
- FEMA flood zone
- X (unshaded)
- Chance of flooding over 30 yrs
- 0.0%
- Est. flood insurance / yr
- $507 – $1,088
Fire risk 1/10 · Minimal
- Est. fire insurance / yr
- $804 – $1,492
Heat risk 4/10 · Minor
- Hot days now (above 104°F)
- 7 days/yr
- Hot days in 30 yrs
- 20 days/yr
Wind risk 2/10 · Minimal
- Chance of severe wind over 30 yrs
- 2.0%
Air-quality risk 2/10 · Minimal
- Unhealthy air days now
- 1 days/yr
- Unhealthy air days in 30 yrs
- 1 days/yr
Risk factors via First Street. Map © Google.
Why this score? — see what drove the B- grade
The composite is a weighted blend of 9 inputs, each scored 0–100. Each bar is that input's sub-score; the figure is the points it added to the 100-point composite (weight × sub-score).
- Cash flow +30.0/30.0
- 1% rule +10.0/10.0
- DSCR +10.0/10.0
- ARV discount +7.5/15.0
- Livability +3.0/5.0
- Rent growth +2.5/5.0
- Condition / age +2.5/5.0
- Schools +2.1/10.0
- Appreciation +0.0/10.0
$59,900
🖨 Deal sheet 📄 Offer letter ✓ Due diligence
Listing remarks
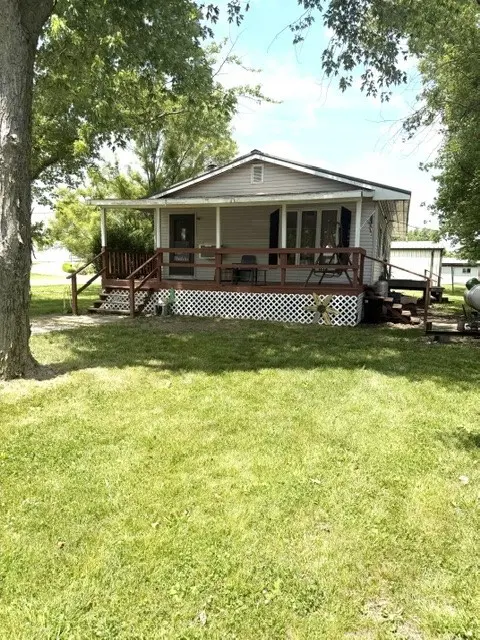
2-bedroom, 1-bath manufactured home situated on a corner lot. The lot provides room for gardening, entertaining, or simply relaxing outdoors. A detached 2-car garage offers storage and workshop space. Whether you're looking for a starter home, downsizing, or seeking an investment opportunity, this property combines affordability, convenience, and potential. Don't miss the chance to make this corner-lot your own! Sold "As-Is".
Key facts
- Corner lot
- Room for gardening
- Detached garage
Tags
Property features AI
Finance
- Other: Zoned residential
Exterior
- Parking: Detached 2-car garage
- Utilities: Public water; Public sewer
- Home design: Manufactured single-family home; One story
- Construction: Vinyl siding; Metal roof; Built as a single-level home
- Exterior features: Front porch; Gravel road access
Interior
- Kitchen: Oven; Range
- Bedrooms: Total of 5 rooms (bedroom count not specified)
- Bathrooms: 1 full bathroom
- Heating & cooling: Propane heating; Window air conditioning units
- Interior features: Wood-burning stove; Crawl space basement
- Laundry & utility: Washer; Dryer; Main-level laundry; Gas water heater
Neighborhood map
What this means for you Summary
Snapshot
- This is a 2-bed/1.0-bath single-family listed at $60k.
Deal economics
- At list price, monthly cash flow is $435 ($5k/yr) — positive.
- The deal already cash-flows at list — no discount required.
- Meets the 1% rule at list price ($1k rent vs $60k).
Location & tenants
- Location reads 59/100 on livability (#1,077 in IL) — a working-class tenant base; expect higher turnover. Strengths: cost of living A+, housing A+; Watch: schools F, crime D-, amenities F.
- Sullivan CUSD 300 (town): math 21% / reading 28% proficiency, ranked #338 of 620 in IL (top 54%) — low school quality limits family demand, transient renter base, plan for 1-2y turnover.
- Market conditions: 42 active listings in the ZIP; 42 units permitted in Moultrie County in 2024 (20 in 5+ unit buildings).
Forward outlook
- Local home prices are declining (-3.0%/yr); year-one equity from $414 of loan paydown is wiped out by about $2k of value loss. Plan a longer hold.
- Moultrie County population projected at -12% by 2050 — secular population decline; favor cash flow + early exit over multi-decade hold.
- At projected returns (-3.0% appreciation + 3.0% rent growth), your $17k cash investment doubles in ~4 years — after that, you're playing with house money.
Negotiation context
- Only 11 days on market — expect competitive offers; lowballing is unlikely to land.
Questions for the listing agent
- Is there a deadline driving the sale (1031 exchange, divorce, estate, relocation)? That informs how much negotiation room exists.
- Schools are F-rated, which usually means shorter tenancies and higher turnover. Who's the typical renter profile here, and what's been the actual vacancy rate?
- Crime grade is D in this area — have there been break-ins, vandalism, or insurance claims at this property in the last 3 years? What carrier currently insures it and at what premium?
- What's the average days-on-market for RENTAL listings here right now (not sales)? A rising rental-DOM trend means longer vacancies and softer asking-rent achievability than the comps imply.
- What's the recent tenant-quality profile in this submarket — average credit score on applications, eviction rate, late-payment / NSF rate, and stable-employment percentage? A property-management company in the area should have these aggregated.
- How much new for-sale + rental construction is in the pipeline within 1–3 miles? Heavy new supply typically softens prices + rents 12–24 months out; constrained supply supports both.
Investment metrics
- 1% rule
- 1.70% ✓
- Cap rate
- 15.01%
- Cash-on-cash
- 31.12%
- DSCR
- 2.38
- GRM
- 4.9
CMA / ARV
No comps found within radius.
Projected returns pro-forma
-3.0% appreciation · 3.0% rent growth · sell at horizon
- IRR
- 25.9%
- Equity multiple
- 2.07×
- Total profit
- $17,982
- Equity at exit
- $8,931
- IRR
- 33.6%
- Equity multiple
- 4.06×
- Total profit
- $51,277
- Equity at exit
- $5,179
Cash invested: $16,772 (down + closing). Projections, not guarantees.
Landlord ↔ Tenant lean methodology
- Overall (STATE)
- 43 Moderately Tenant-Leaning
- State Illinois
- 43 Moderately Tenant-Leaning · D+7
- County
- — inherits STATE
- City
- — inherits STATE
ZIP-level market 61951
- Home prices YoY
- -7.6%
- Active inventory
- 42
- Price-to-rent
- 4.9×
Monthly cashflow live
- Estimated rent
- $1,018 medium interval (Pro) →
- Mortgage (P&I)
- −$314
- Tax from tax record
- −$30 /mo · $361/yr
- Insurance
- −$25
- HOA
- −$0
- Vacancy / Maint / Mgmt
- −$214
- Net cashflow
- $435
Break-even live
UW: 25.0% down · 7.5% · 30yr · 1.5% tax · 5.0% vac · 8.0% maint · 8.0% mgmt
Financing live
Cash to close
- Down payment
- $14,975
- Closing costs
- $1,797
- Reserves months
- —
- Total cash needed
- —
Loan-product check · same deal, 3 products live
Conventional
25% down · 7.5% · 30yr
- Down + closing
- —
- Monthly P&I
- —
- Monthly cashflow
- —
- DSCR
- —
- Eligible?
- —
Personal DTI + credit; lowest rate.
DSCR
20% down · 8.5% · 30yr
- Down + closing
- —
- Monthly P&I
- —
- Monthly cashflow
- —
- DSCR
- —
- Eligible?
- —
No personal income docs; deal must DSCR.
Hard money
10% down · 12.0% · 12mo
- Down + closing
- —
- Monthly P&I
- —
- Monthly cashflow
- —
- DSCR
- —
- Eligible?
- —
Short-term bridge; refi at stabilization.
Listing history 10 events
-
2026-06-19days on market $59,900 Active 11 DOM
-
2026-06-18days on market $59,900 Active 10 DOM
-
2026-06-17days on market $59,900 Active 9 DOM
-
2026-06-16days on market $59,900 Active 8 DOM
-
2026-06-16price $59,900 Active 7 DOM
-
2026-06-15days on market $62,900 Active 7 DOM
-
2026-06-14days on market $62,900 Active 5 DOM
-
2026-06-12days on market $62,900 Active 4 DOM
-
2026-06-09remarks 430-char remark
-
2026-06-09$62,900 Active 1 DOM
ⓘ Source: listings_history table (triggers on properties + properties_extension) + one-shot
backfill from property_details.listing_events for pre-trigger history.
Tax reassessment forecast IL · Partial reset (capped growth)
- Current annual tax
- $361 · $30/mo
- Projected year-2 tax
- $860 · $72/mo
- Expected delta
- +$500/yr (+$42/mo · 138.5%)
ⓘ Screening estimate from a state-policy table — verify with the county assessor before closing.
Climate risk First Street
- Flood 1/10 Low FEMA zone X (unshaded) · 0% chance over 30 yrs
- Wildfire 1/10 Low
- Heat 4/10 Moderate 7 d/yr ≥104°F today · 20 d/yr by 30 yrs out
- Wind 2/10 Low 2% chance of damaging wind over 30 yrs
- Air quality 2/10 Low 1 unhealthy d/yr today · 1 by 30 yrs out
Nearby sold comps map
Loading sold comps map…
Walkable amenities ~0.75 mi
Loading nearby amenities…
Taxation est. · year 1
- Rental income
- $12,213
- − Mortgage interest
- −$3,355
- − Property taxes
- −$361
- − Insurance
- −$300
- − Repairs & maintenance
- −$977
- − Management
- −$977
- − Depreciation
- −$1,743
- Taxable income
- $4,501
- Est. tax owed @ 24.0%
- −$1,080
- After-tax cash flow
- $4,139/yr
For passive investors: Depreciation is non-cash, so a rental often shows a tax loss while cash-flowing — sheltering income. Rental losses are passive: they offset passive income freely, and up to $25,000/yr can offset ordinary (W-2) income if you actively participate and your MAGI is under $100k (phasing out to $0 by $150k); unused losses carry forward. On sale, claimed depreciation is recaptured at up to 25%, and gains may owe capital-gains tax (a 1031 exchange can defer both). Figures are a year-1 estimate at your 24.0% rate — not tax advice; consult a CPA.
Schools (NCES district)
- District
- Sullivan CUSD 300
- NCES district ID
- 1738130
- Math proficiency
- 21% ▬ 0.00%
- Reading proficiency
- 28% ▼ -10.00%
- Median HH income
- $47,763
- Composite
- 21.41/100
- National rank
- #8346
- State rank
- #338 of 620 in IL
Livability — Allenville
- Score
- 59/100
- State rank
- #1077
- US rank
- #20543
Category grades
Schools grade is shown separately in the Schools card above.
Census & demographics
- Census place
- Allenville, IL
- Population (ZIP)
- 7,654
Population outlook (Moultrie County) Hauer SSP2
- Today (2025)
- 14,766 people
- By 2030
- 14,490 · -1.9%
- By 2040
- 13,848 · -6.2%
- By 2050
- 13,063 · -11.5%
- By 2075
- 10,862 · -26.4%
- By 2100
- 7,963 · -46.1%
Race, ethnicity, and origin ACS 2023
- Neighborhood character
- Predominantly White (97%)
- Race & ethnicity
- White 97% Two or more races 2% Black 1%
- Common ancestry
- Lithuanian 1% Italian 1% Slovak 1%
- Foreign-born
- 1%
- Languages at home
- 90% English-only · German/W. Germanic 8% Other Indo-European 1% Spanish 1%
Political lean MEDSL · Moultrie
- 2024 margin
- Solid R (+49.1) · D 24.8% · R 73.8% · Other 1.4%
- 2008→2024 swing
- -36.2pp toward R · 2008: -12.8pp · 2024: -49.1pp
- All cycles
- 2024: R+49.1 2020: R+49.0 2016: R+48.0 2012: R+27.1 2008: R+12.8
Not yet ingested
- Civics
- —
Market trends
- HPI YoY
- ▼ -17.15%
- Current HPI
- 208.2808
- Rent YoY
- —
- Metro
- —
- State GDP YoY
- ▲ 1.59%
- F500 in state
- 60
Industry mix (Fortune 500 HQ in IL)
| Industry | F500 HQs | Revenue |
|---|---|---|
| Insurance | 4 | $201B |
|
||
| Consumer Goods | 4 | $87B |
|
||
| Industrial Machinery | 3 | $64B |
|
||
| Healthcare | 2 | $55B |
|
||
| Retail / Pharmacy | 1 | $148B |
|
||
| Agriculture / Food | 1 | $86B |
|
||
Price history
1 event — show timeline
- 2026-06-08 Listed $62,900 CIBR
Property tax history
+2.0%/yrLatest (2024): $361 · +0.2% YoY. Source: county tax records.
Cash-flow waterfall
monthlySold comps — $/sqft
last 12 mo · ≤1 miLoading sold comps…