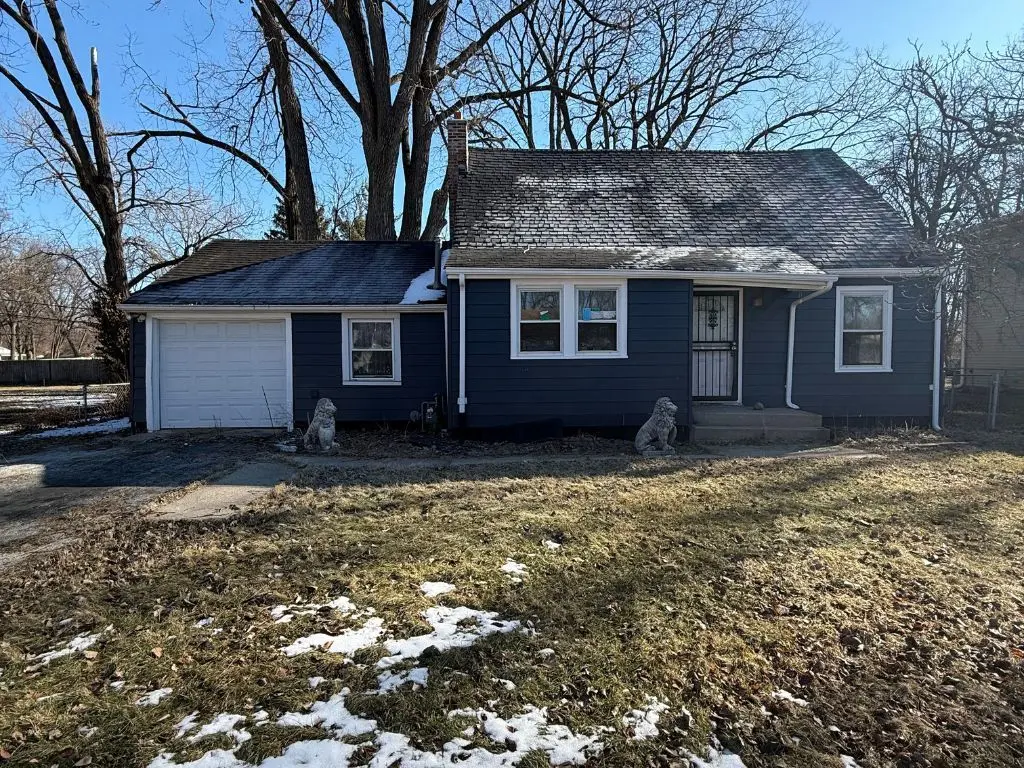
16215 Clifton Park Ave · Markham, IL
Flood risk 1/10 · Minimal
- FEMA flood zone
- X (unshaded)
- Chance of flooding over 30 yrs
- 0.0%
- Est. flood insurance / yr
- $507 – $1,088
Fire risk 1/10 · Minimal
- Est. fire insurance / yr
- $804 – $1,492
Heat risk 3/10 · Minor
- Hot days now (above 101°F)
- 7 days/yr
- Hot days in 30 yrs
- 15 days/yr
Wind risk 2/10 · Minimal
- Chance of severe wind over 30 yrs
- —
Air-quality risk 3/10 · Minor
- Unhealthy air days now
- 4 days/yr
- Unhealthy air days in 30 yrs
- 4 days/yr
Risk factors via First Street. Map © Google.
Why this score? — see what drove the A grade
The composite is a weighted blend of 9 inputs, each scored 0–100. Each bar is that input's sub-score; the figure is the points it added to the 100-point composite (weight × sub-score).
- Cash flow +30.0/30.0
- ARV discount +15.0/15.0
- 1% rule +10.0/10.0
- DSCR +10.0/10.0
- Appreciation +10.0/10.0
- Livability +3.8/5.0
- Rent growth +2.5/5.0
- Condition / age +2.5/5.0
- Schools +1.5/10.0
$119,900
🖨 Deal sheet 📄 Offer letter ✓ Due diligence
Listing remarks MLS
There are no remarks available.
Key facts
- Screened-in porch
- Attached garage
- Double lot
Tags
Property features AI
Finance
- Other: Parcel numbers on file; Directions: Kedzie to 163rd West to Clifton Park then north to address
- HOA & community: No master association fee required
Exterior
- Parking: 3 parking spaces; 3-car garage (attached/detached, owned); Asphalt driveway
- Utilities: Lake Michigan water; Public sewer
- Home design: Detached single-family home; 1.5-story layout; Fee simple ownership; Built before 1978
- Construction: Vinyl siding; Asphalt roof; Estimated age: 61–70 years
- Exterior features: Lot dimensions approximately 80 x 134; Less than 0.25 acre lot; Commuter bus and interstate access nearby
Interior
- Kitchen: Kitchen on lower level (10 x 10)
- Bedrooms: 3 bedrooms; Master bedroom on main level (12 x 12); Second-floor bedroom (12 x 20); Second-floor bedroom (12 x 13)
- Bathrooms: 1 full bathroom; 1 half bathroom
- Heating & cooling: Natural gas heating
- Interior features: 6 total rooms; Separate dining room; Enclosed porch; Crawl space basement
- Laundry & utility: Main-level laundry (7 x 14)
Neighborhood map
What this means for you Summary
Snapshot
- This is a 3-bed/1.0-bath single-family listed at $120k.
Deal economics
- At list price, monthly cash flow is $1k ($12k/yr) — positive.
- The deal already cash-flows at list — no discount required.
- Meets the 1% rule at list price ($2k rent vs $120k).
- Recommended offer: $109k (9.0% below list) — sets the bar for market timing.
- Cap rate 16.6% vs local median 10.2% in Markham — top-decile yield for the area; either an underpriced asset or a hidden risk that comps aren't pricing in. Stress-test before assuming the spread holds.
Location & tenants
- Location reads 76/100 on livability (#186 in IL, #3,539 nationally) — a middle-class / working-renter tenant base. Strengths: commute A+, cost of living A+, housing A+; Watch: crime D, amenities D, employment D.
- Bremen Chsd 228 (suburban): math 15% / reading 17% proficiency, ranked #468 of 620 in IL (top 76%) — low school quality limits family demand, transient renter base, plan for 1-2y turnover.
- Market conditions: 65 active listings in the ZIP; 4 comparable units currently listed for rent nearby; rentals leasing fast (median 8d on market — plan ~1-2 weeks tenant-placement turnaround); 6,272 units permitted in Cook County in 2024 (4,658 in 5+ unit buildings).
Forward outlook
- In year one you build about $13k of equity ($829 loan paydown + $12k appreciation (10.0% local appreciation)).
- At projected returns (10.0% appreciation + 3.0% rent growth), your $34k cash investment doubles in ~2 years — after that, you're playing with house money.
- By year 3, paydown + projected appreciation supports a ~$32k cash-out refi (75% LTV) — recoverable capital for the next deal without selling this one.
Negotiation context
- It's been on market 98 days — a 9% lower offer ($109k) is reasonable based on typical stale-listing flexibility.
- 10 sale attempts since 12y ago with the ask held roughly flat each time — persistent listings suggest the price (not the market) is what's stuck; bring a comps-based counter.
- Current owner paid $90k; 33% above their basis — modest negotiation headroom, anchor on the comps not their cost.
Questions for the listing agent
- It's been on market 98 days. Have you received any prior offers? Is the seller open to a 9% concession, seller financing, or rate buy-down credit?
- Built in 1963 — when were the roof, HVAC, electrical panel, plumbing, and water heater last replaced?
- Why hasn't it sold? Are there any deal-killer items the seller is aware of (foundation, flood, title, zoning, code violations)?
- Is there a deadline driving the sale (1031 exchange, divorce, estate, relocation)? That informs how much negotiation room exists.
- Schools are F-rated, which usually means shorter tenancies and higher turnover. Who's the typical renter profile here, and what's been the actual vacancy rate?
- Crime grade is D in this area — have there been break-ins, vandalism, or insurance claims at this property in the last 3 years? What carrier currently insures it and at what premium?
- What's the average days-on-market for RENTAL listings here right now (not sales)? A rising rental-DOM trend means longer vacancies and softer asking-rent achievability than the comps imply.
- What's the recent tenant-quality profile in this submarket — average credit score on applications, eviction rate, late-payment / NSF rate, and stable-employment percentage? A property-management company in the area should have these aggregated.
- How much new for-sale + rental construction is in the pipeline within 1–3 miles? Heavy new supply typically softens prices + rents 12–24 months out; constrained supply supports both.
Investment metrics
- 1% rule
- 2.02% ✓
- Cap rate
- 16.60%
- Cash-on-cash
- 36.82%
- DSCR
- 2.64
- GRM
- 4.1
CMA / ARV
- ARV (on-the-fly)
- $175,272
- Comps found
- 12
Show comp detail 12 sales within ~0.75 mi
| Address | Dist | Beds/Ba | Sqft | Sold | Price | $/sf | Match |
|---|---|---|---|---|---|---|---|
| 16302 Trumbull Ave | 0.15mi | 3/1.0 | 1,260 (-4%) | 2mo | $139,900 | $111 | 85 |
| 16030 Saint Louis Ave | 0.21mi | 3/1.5 | 1,228 (-6%) | 3mo | $200,000 | $163 | 76 |
| 3417 W 161st St | 0.19mi | 3/1.0 | 1,413 (+8%) | 8mo | $77,500 | $55 | 72 |
| 3737 Rose Manor Ter | 0.37mi | 2/1.0 (-1) | 1,210 (-8%) | 0mo | $165,000 | $136 | 65 |
| 16516 Turner Ave | 0.45mi | 3/1.0 | 1,200 (-8%) | 2mo | $70,000 | $58 | 64 |
| 3620 Arthur Ter | 0.16mi | 2/1.0 (-1) | 1,135 (-13%) | 8mo | $162,900 | $144 | 59 |
| 16426 Homan Ave | 0.33mi | 3/3.0 | 1,419 (+8%) | 6mo | $190,000 | $134 | 58 |
| 15823 S Saint Louis Ave | 0.49mi | 3/2.0 | 1,203 (-8%) | 4mo | $220,000 | $183 | 56 |
| 16224 Kedzie Ave | 0.41mi | 3/1.5 | 1,476 (+13%) | 3mo | $127,000 | $86 | 55 |
| 16431 Spaulding Ave | 0.43mi | 3/1.0 | 1,500 (+15%) | 2mo | $75,000 | $50 | 54 |
| 16641 Sawyer Ave | 0.67mi | 4/1.5 (+1) | 1,260 (-4%) | 3mo | $188,000 | $149 | 53 |
| 16524 Sawyer Ave | 0.53mi | 4/2.0 (+1) | 1,501 (+15%) | 0mo | $192,500 | $128 | 41 |
Match score weights: distance 35% · size 25% · config 20% · recency 20%. Top-matched comps best support the ARV.
Projected returns pro-forma
10.0% appreciation · 3.0% rent growth · sell at horizon
- IRR
- 52.6%
- Equity multiple
- 4.90×
- Total profit
- $130,981
- Equity at exit
- $108,015
- IRR
- 46.2%
- Equity multiple
- 10.96×
- Total profit
- $334,269
- Equity at exit
- $232,939
Cash invested: $33,572 (down + closing). Projections, not guarantees.
Landlord ↔ Tenant lean methodology
- Overall (STATE)
- 43 Moderately Tenant-Leaning
- State Illinois
- 43 Moderately Tenant-Leaning · D+7
- County
- — inherits STATE
- City
- — inherits STATE
ZIP-level market 60428
- Home prices YoY
- 8.5%
- Active inventory
- 65
- Price-to-rent
- 4.1×
Monthly cashflow live
- Estimated rent
- $2,428 medium interval (Pro) →
- Mortgage (P&I)
- −$629
- Tax from tax record
- −$209 /mo · $2,509/yr
- Insurance
- −$50
- HOA
- −$0
- Vacancy / Maint / Mgmt
- −$510
- Net cashflow
- $1,030
Break-even live
UW: 25.0% down · 7.5% · 30yr · 1.5% tax · 5.0% vac · 8.0% maint · 8.0% mgmt
Financing live
Cash to close
- Down payment
- $29,975
- Closing costs
- $3,597
- Reserves months
- —
- Total cash needed
- —
Loan-product check · same deal, 3 products live
Conventional
25% down · 7.5% · 30yr
- Down + closing
- —
- Monthly P&I
- —
- Monthly cashflow
- —
- DSCR
- —
- Eligible?
- —
Personal DTI + credit; lowest rate.
DSCR
20% down · 8.5% · 30yr
- Down + closing
- —
- Monthly P&I
- —
- Monthly cashflow
- —
- DSCR
- —
- Eligible?
- —
No personal income docs; deal must DSCR.
Hard money
10% down · 12.0% · 12mo
- Down + closing
- —
- Monthly P&I
- —
- Monthly cashflow
- —
- DSCR
- —
- Eligible?
- —
Short-term bridge; refi at stabilization.
Rent comps 4 comps
| Address | Beds | Baths | Sqft | Rent | $/sqft | DOM | Units | Dist |
|---|---|---|---|---|---|---|---|---|
| 3900 171st St Country Club Hills, IL | 3.0 | 1.0 | 1750 | $2,250 | $1.29 | 8d | 1 | 1.23mi |
| 16450 Roy St Oak Forest, IL | 3.0 | 1.5 | 1500 | $2,400 | $1.60 | 18d | 1 | 1.36mi |
| 3952 153rd St Midlothian, IL | 4.0 | 2.0 | 1677 | $2,396 | $1.43 | 2d | 1 | 1.40mi |
| 17306 Peach Grove Ln Hazel Crest, IL | 4.0 | 1.0 | 1034 | $2,700 | $2.61 | 1d | 1 | 1.50mi |
Listing history 42 events
-
2026-06-18days on market $119,900 Active 98 DOM
-
2026-06-17days on market $119,900 Active 97 DOM
-
2026-06-16days on market $119,900 Active 96 DOM
-
2026-06-15days on market $119,900 Active 95 DOM
-
2026-06-13days on market $119,900 Active 93 DOM
-
2026-06-09days on market $119,900 Active 89 DOM
-
2026-06-08days on market $119,900 Active 88 DOM
-
2026-06-07days on market $119,900 Active 87 DOM
-
2026-06-04days on market $119,900 Active 84 DOM
-
2026-06-03days on market $119,900 Active 83 DOM
-
2026-06-02days on market $119,900 Active 82 DOM
-
2026-06-01days on market $119,900 Active 81 DOM
-
2026-05-31days on market $119,900 Active 80 DOM
-
2026-03-11$119,900 Active
-
2024-08-19soldstatus $90,000 Closed 31-char remark
Show marketing remark (31 chars)
There are no remarks available.
-
2024-07-11status Active 31-char remark
Show marketing remark (31 chars)
There are no remarks available.
-
2024-06-29historical Contingent - Continue to Show 31-char remark
Show marketing remark (31 chars)
There are no remarks available.
-
2024-06-29status Active 31-char remark
Show marketing remark (31 chars)
There are no remarks available.
-
2024-05-08historical Contingent - Continue to Show 31-char remark
Show marketing remark (31 chars)
There are no remarks available.
-
2024-05-03historical 31-char remark
Show marketing remark (31 chars)
There are no remarks available.
-
2024-04-23price $90,000 31-char remark
Show marketing remark (31 chars)
There are no remarks available.
-
2024-04-19status Active 31-char remark
Show marketing remark (31 chars)
There are no remarks available.
-
2024-04-17historical Contingent - Continue to Show 31-char remark
Show marketing remark (31 chars)
There are no remarks available.
-
2024-04-11status Active 31-char remark
Show marketing remark (31 chars)
There are no remarks available.
-
2024-04-04historical Contingent - Continue to Show 31-char remark
Show marketing remark (31 chars)
There are no remarks available.
-
2024-03-28status Temporarily No Showings 31-char remark
Show marketing remark (31 chars)
There are no remarks available.
-
2024-03-01historical 31-char remark
Show marketing remark (31 chars)
There are no remarks available.
-
2024-02-26price $100,000 31-char remark
Show marketing remark (31 chars)
There are no remarks available.
-
2024-01-03price $140,000 31-char remark
Show marketing remark (31 chars)
There are no remarks available.
-
2023-12-14$155,000 Active 31-char remark
Show marketing remark (31 chars)
There are no remarks available.
-
2015-05-22soldstatus $26,000 Closed Sale 249-char remark
Show marketing remark (249 chars)
Cape Cod on cornet lot. 1 car attached garage. 2 car detached garage. First floor bedroom. Newer carpet. Screened in porch in back. Double lot mature trees. Roof replaced 5 years ago. New Hot water tank. Bathroom recently redone. New garage door.
-
2015-04-01historical Contingent 249-char remark
Show marketing remark (249 chars)
Cape Cod on cornet lot. 1 car attached garage. 2 car detached garage. First floor bedroom. Newer carpet. Screened in porch in back. Double lot mature trees. Roof replaced 5 years ago. New Hot water tank. Bathroom recently redone. New garage door.
-
2015-03-23status Reactivated 249-char remark
Show marketing remark (249 chars)
Cape Cod on cornet lot. 1 car attached garage. 2 car detached garage. First floor bedroom. Newer carpet. Screened in porch in back. Double lot mature trees. Roof replaced 5 years ago. New Hot water tank. Bathroom recently redone. New garage door.
-
2015-01-20historical Contingent 249-char remark
Show marketing remark (249 chars)
Cape Cod on cornet lot. 1 car attached garage. 2 car detached garage. First floor bedroom. Newer carpet. Screened in porch in back. Double lot mature trees. Roof replaced 5 years ago. New Hot water tank. Bathroom recently redone. New garage door.
-
2014-12-10price $25,000 249-char remark
Show marketing remark (249 chars)
Cape Cod on cornet lot. 1 car attached garage. 2 car detached garage. First floor bedroom. Newer carpet. Screened in porch in back. Double lot mature trees. Roof replaced 5 years ago. New Hot water tank. Bathroom recently redone. New garage door.
-
2014-12-10price $26,000 249-char remark
Show marketing remark (249 chars)
Cape Cod on cornet lot. 1 car attached garage. 2 car detached garage. First floor bedroom. Newer carpet. Screened in porch in back. Double lot mature trees. Roof replaced 5 years ago. New Hot water tank. Bathroom recently redone. New garage door.
-
2014-11-12$30,000 New 249-char remark
Show marketing remark (249 chars)
Cape Cod on cornet lot. 1 car attached garage. 2 car detached garage. First floor bedroom. Newer carpet. Screened in porch in back. Double lot mature trees. Roof replaced 5 years ago. New Hot water tank. Bathroom recently redone. New garage door.
-
2014-11-04historical
-
2014-08-01price Price Change
-
2014-05-05New
-
1999-09-14soldstatus $73,500
-
1989-12-14soldstatus $51,000
ⓘ Source: listings_history table (triggers on properties + properties_extension) + one-shot
backfill from property_details.listing_events for pre-trigger history.
Tax reassessment forecast IL · Partial reset (capped growth)
- Current annual tax
- $2,509 · $209/mo
- Projected year-2 tax
- $2,615 · $218/mo
- Expected delta
- +$106/yr (+$9/mo · 4.2%)
ⓘ Screening estimate from a state-policy table — verify with the county assessor before closing.
Climate risk First Street
- Flood 1/10 Low FEMA zone X (unshaded) · 0% chance over 30 yrs
- Wildfire 1/10 Low
- Heat 3/10 Moderate 7 d/yr ≥101°F today · 15 d/yr by 30 yrs out
- Wind 2/10 Low
- Air quality 3/10 Moderate 4 unhealthy d/yr today · 4 by 30 yrs out
Nearby sold comps map
Loading sold comps map…
Walkable amenities ~0.75 mi
Loading nearby amenities…
Taxation est. · year 1
- Rental income
- $29,133
- − Mortgage interest
- −$6,716
- − Property taxes
- −$2,509
- − Insurance
- −$600
- − Repairs & maintenance
- −$2,331
- − Management
- −$2,331
- − Depreciation
- −$3,488
- Taxable income
- $11,159
- Est. tax owed @ 24.0%
- −$2,678
- After-tax cash flow
- $9,683/yr
For passive investors: Depreciation is non-cash, so a rental often shows a tax loss while cash-flowing — sheltering income. Rental losses are passive: they offset passive income freely, and up to $25,000/yr can offset ordinary (W-2) income if you actively participate and your MAGI is under $100k (phasing out to $0 by $150k); unused losses carry forward. On sale, claimed depreciation is recaptured at up to 25%, and gains may owe capital-gains tax (a 1031 exchange can defer both). Figures are a year-1 estimate at your 24.0% rate — not tax advice; consult a CPA.
Schools (NCES district)
- District
- Bremen Chsd 228
- NCES district ID
- 1707050
- Math proficiency
- 15% ▼ -4.00%
- Reading proficiency
- 17% ▼ -5.00%
- Median HH income
- $57,625
- Composite
- 15.32/100
- National rank
- #9327
- State rank
- #468 of 620 in IL
Livability — Markham
- Score
- 76/100
- State rank
- #186
- US rank
- #3539
Category grades
Schools grade is shown separately in the Schools card above.
Census & demographics
- Census place
- Markham, IL
- City population
- 10,980
- Population (ZIP)
- 10,980
Population outlook (Cook County) Hauer SSP2
- Today (2025)
- 5,347,519 people
- By 2030
- 5,357,703 · +0.2%
- By 2040
- 5,324,924 · -0.4%
- By 2050
- 5,230,762 · -2.2%
- By 2075
- 4,785,735 · -10.5%
- By 2100
- 4,188,836 · -21.7%
Race, ethnicity, and origin ACS 2023
- Neighborhood character
- Predominantly Black (69%)
- Race & ethnicity
- Black 69% Hispanic / Latino 17% White 11% Two or more races 4%
- Hispanic origin (detail)
- Mexican 16%
- Common ancestry
- Romanian 1% Lithuanian 1% Iranian 1%
- Foreign-born
- 8% · Canada
- Languages at home
- 86% English-only · Spanish 14%
Political lean MEDSL · Cook
- 2024 margin
- Solid D (+42.0) · D 70.4% · R 28.4% · Other 1.2%
- 2008→2024 swing
- -11.4pp toward R · 2008: 53.4pp · 2024: 42.0pp
- All cycles
- 2024: D+42.0 2020: D+50.3 2016: D+53.0 2012: D+49.4 2008: D+53.4
Not yet ingested
- Civics
- —
Market trends
- HPI YoY
- ▲ 23.63%
- Current HPI
- 302.333
- Rent YoY
- —
- Metro
- —
- State GDP YoY
- ▲ 1.59%
- F500 in state
- 60
Industry mix (Fortune 500 HQ in IL)
| Industry | F500 HQs | Revenue |
|---|---|---|
| Insurance | 4 | $201B |
|
||
| Consumer Goods | 4 | $87B |
|
||
| Industrial Machinery | 3 | $64B |
|
||
| Healthcare | 2 | $55B |
|
||
| Retail / Pharmacy | 1 | $148B |
|
||
| Agriculture / Food | 1 | $86B |
|
||
Price history
+135.1% since first listed29 events — show timeline
- 2026-03-11 Listed $119,900 MRED as Distributed by MLS Grid
- 2024-08-19 Sold (MLS) $90,000 MRED as Distributed by MLS Grid
- 2024-07-11 Relisted — MRED as Distributed by MLS Grid
- 2024-06-29 Contingent — MRED as Distributed by MLS Grid
- 2024-06-29 Relisted — MRED as Distributed by MLS Grid
- 2024-05-08 Contingent — MRED as Distributed by MLS Grid
- 2024-05-03 Listing Removed — MRED as Distributed by MLS Grid
- 2024-04-23 Price Changed $90,000 MRED as Distributed by MLS Grid
- 2024-04-19 Relisted — MRED as Distributed by MLS Grid
- 2024-04-17 Contingent — MRED as Distributed by MLS Grid
- 2024-04-11 Relisted — MRED as Distributed by MLS Grid
- 2024-04-04 Contingent — MRED as Distributed by MLS Grid
- 2024-03-28 Relisted — MRED as Distributed by MLS Grid
- 2024-03-01 Listing Removed — MRED as Distributed by MLS Grid
- 2024-02-26 Price Changed $100,000 MRED as Distributed by MLS Grid
- 2024-01-03 Price Changed $140,000 MRED as Distributed by MLS Grid
- 2023-12-14 Listed $155,000 MRED as Distributed by MLS Grid
- 2015-05-22 Sold (MLS) $26,000 MRED as Distributed by MLS Grid
- 2015-04-01 Contingent — MRED as Distributed by MLS Grid
- 2015-03-23 Relisted — MRED as Distributed by MLS Grid
- 2015-01-20 Contingent — MRED as Distributed by MLS Grid
- 2014-12-10 Price Changed $26,000 MRED as Distributed by MLS Grid
- 2014-12-10 Price Changed $25,000 MRED as Distributed by MLS Grid
- 2014-11-12 Listed $30,000 MRED as Distributed by MLS Grid
- 2014-11-04 Listing Removed — MRED as Distributed by MLS Grid
- 2014-08-01 Price Changed — MRED as Distributed by MLS Grid
- 2014-05-05 Listed — MRED as Distributed by MLS Grid
- 1999-09-14 Sold (Public Records) $73,500 Public Records
- 1989-12-14 Sold (Public Records) $51,000 Public Records
Property tax history
+6.0%/yrLatest (2023): $2,509 · +134.5% YoY. Source: county tax records.
Cash-flow waterfall
monthlySold comps — $/sqft
last 12 mo · ≤1 miLoading sold comps…