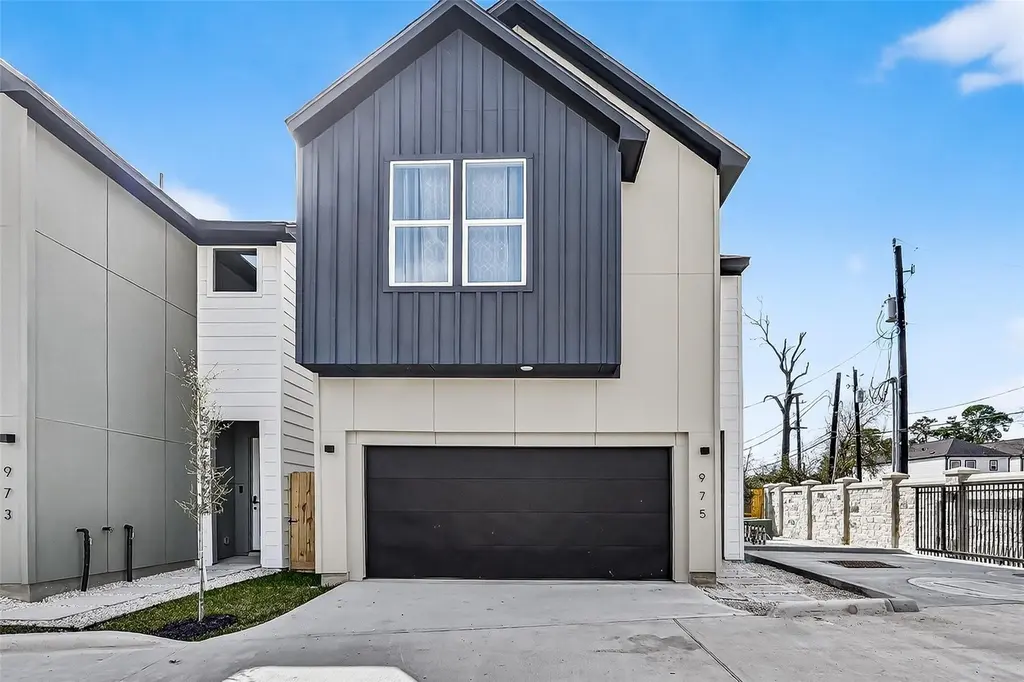
 🏗️ New Construction
957 Highland Light Ln · Houston, TX
Flood risk 7/10 · Major
- FEMA flood zone
- X (unshaded)
- Chance of flooding over 30 yrs
- 0.99%
- Est. flood insurance / yr
- $507 – $1,088
Fire risk 1/10 · Minimal
- Est. fire insurance / yr
- $1,222 – $2,270
Heat risk 9/10 · Severe
- Hot days now (above 109°F)
- 7 days/yr
- Hot days in 30 yrs
- 24 days/yr
Wind risk 9/10 · Severe
- Chance of severe wind over 30 yrs
- 99.0%
Air-quality risk 3/10 · Minor
- Unhealthy air days now
- 2 days/yr
- Unhealthy air days in 30 yrs
- 3 days/yr
Risk factors via First Street. Map © Google.
Why this score? — see what drove the F grade
The composite is a weighted blend of 9 inputs, each scored 0–100. Each bar is that input's sub-score; the figure is the points it added to the 100-point composite (weight × sub-score).
- ARV discount +7.5/15.0
- Livability +3.7/5.0
- Rent growth +3.0/5.0
- Schools +2.7/10.0
- Condition / age +2.5/5.0
- Cash flow +1.6/30.0
- 1% rule +0.0/10.0
- DSCR +0.0/10.0
- Appreciation +0.0/10.0
$355,000
🖨 Deal sheet 📄 Offer letter ✓ Due diligence
Listing remarks
* New Construction * Stunning two-story home with the living area and kitchen on the first floor, with a well appointed fenced backyard. Upgraded finishes throughout including smart-home features, quartz countertops, stainless-steel appliances, soft close drawers and cabinets, and LED lighting. Enjoy this 12-home gated community centrally located. With close proximity to The Heights, I-610, I-290, I-45 and downtown Houston.
Key facts
- Smart-home features
- Quartz countertops
- Soft close drawers
Tags
Property features AI
Finance
- Other: Builder: Iberica Construction
Exterior
- Parking: Attached oversized garage with 2 spaces
- Security: Controlled access; Smoke detector(s)
- Utilities: Public water; Public sewer
- Home design: Residential property; New construction (2026); Slab foundation; Composition roof
- Construction: Built in 2026; Brick, cement siding, synthetic stucco and wood siding construction; Slab foundation; Composition roof
- Exterior features: Back yard fence; Cleared lot in a subdivision; Controlled access; Smoke detectors
Interior
- Kitchen: Dishwasher; Electric oven; Gas range; Microwave; Garbage disposal
- Bedrooms: 3 total rooms
- Flooring: Plank flooring; Vinyl flooring
- Bathrooms: 2 full bathrooms; 1 half bathroom
- Heating & cooling: Central heating (gas); Central electric air conditioning; Thermostat (energy efficient)
- Interior features: Double vanity; High ceilings; Kitchen/family room combo; Quartz counters; Soaking tub; Separate shower; Ceiling fan(s); Programmable thermostat
- Laundry & utility: Washer hookup; Electric dryer hookup; Gas dryer hookup
Neighborhood map
What this means for you Summary
Snapshot
- This is a 3-bed/2.5-bath land listed at $355k.
Deal economics
- At list price, monthly cash flow is $-3k ($-36k/yr) — negative.
- The deal already cash-flows at list — no discount required.
- To meet the 1% rule (rent ≥ 1% of price), the offer needs to be $299k (15.9% below list).
- Recommended offer: $299k (15.9% below list) — sets the bar for 1% rule.
- Cap rate 1.7% vs local median 3.2% in Houston — below-typical yield; the buyer is paying a premium for something (appreciation thesis, condition, location) that the cap rate doesn't capture.
Location & tenants
- Location reads 74/100 on livability (#184 in TX, #4,771 nationally) — a middle-class / working-renter tenant base. Strengths: amenities A+, cost of living A+, housing A+; Watch: crime F.
- Houston ISD (urban): math 27% / reading 35% proficiency, ranked #593 of 826 in TX (top 72%) — families likely to look elsewhere, expect single-tenant / working-renter base with shorter leases; 71% free/reduced lunch — lower-income household profile, screen leases tightly.
- Zoned schools: Williams Middle (math 9% / reading 15%, grade F, #1,623 of 1,662 statewide, top 98%, 411 students, 98% FRL); Washington B T H S (math 27% / reading 25%, grade F, #1,234 of 1,632 statewide, top 76%, 878 students, 96% FRL) — zoned schools average 97% FRL vs 71% district-wide (26 pts higher); higher-poverty schools than district average — tighter screening recommended.
- Zoned-school proficiency averages 19% at this address vs 31% district-wide (-12 pts) — the specific schools serving this property underperform the Houston ISD average; the district grade overstates school quality for this exact location.
- Market conditions: Rents rising (+2.1%/yr); 675 active listings in the ZIP; 40 comparable units currently listed for rent nearby; rentals at typical pace (median 15d on market — plan ~3-4 weeks tenant-placement turnaround); 48% of comp listings sitting > 30 days — soft ceiling on asking rent; lower-income renter base — watch delinquency; 29,883 units permitted in Harris County in 2024 (8,621 in 5+ unit buildings).
- At $2,985/mo this rent would consume 101% of the median local household income ($35k/yr) (locally 3210% of renters already pay >50% of income on rent) — very limited rent-growth headroom before tenants either downsize or default.
Forward outlook
- Local home prices are declining (-3.0%/yr); year-one equity from $5k of loan paydown is wiped out by about $23k of value loss. Plan a longer hold.
- Harris County population projected at +47% by 2050 — long-run rental-demand tailwind backs the buy-and-hold thesis.
Negotiation context
- It's been on market 42 days — a 3% lower offer ($344k) is reasonable based on typical stale-listing flexibility.
- 2 sale attempts; this cycle's ask has dropped $19k (5%) from the opening price — seller is motivated, your offer sets the floor, not the list.
Risks & watch-outs
- Watch-outs: property tax is 3.3% of price; flood insurance adds $66/mo.
- Climate carrying-cost: major flood risk; severe wind risk, 99% chance of damaging wind over 30y; extreme-heat days projected 7→24/yr by 2055 (HVAC capex compounding) — expect insurance premiums to compound above CPI over the hold.
Questions for the listing agent
- What do current leases actually rent for vs. the listed asking? Can we see a recent rent roll and the last 12 months of T-12 income?
- It's been on market 42 days. Have you received any prior offers? Is the seller open to a 16% concession, seller financing, or rate buy-down credit?
- Property tax is high relative to price — has the assessment been appealed recently, and will the sale trigger a re-assessment?
- What's the actual annual flood-insurance premium (NFIP or private), and is the property in a SFHA with mandatory coverage?
- Is there a deadline driving the sale (1031 exchange, divorce, estate, relocation)? That informs how much negotiation room exists.
- Schools are D-rated, which usually means shorter tenancies and higher turnover. Who's the typical renter profile here, and what's been the actual vacancy rate?
- Crime grade is F in this area — have there been break-ins, vandalism, or insurance claims at this property in the last 3 years? What carrier currently insures it and at what premium?
- The area grade is low — what's the realistic commute time and amenity access for the typical tenant pool here? Any planned neighborhood developments (good or bad) we should know about?
- What's the average days-on-market for RENTAL listings here right now (not sales)? A rising rental-DOM trend means longer vacancies and softer asking-rent achievability than the comps imply.
- What's the recent tenant-quality profile in this submarket — average credit score on applications, eviction rate, late-payment / NSF rate, and stable-employment percentage? A property-management company in the area should have these aggregated.
- How much new for-sale + rental construction is in the pipeline within 1–3 miles? Heavy new supply typically softens prices + rents 12–24 months out; constrained supply supports both.
Investment metrics
- 1% rule
- 0.39% ✗
- Cap rate
- 1.68%
- Cash-on-cash
- -16.48%
- DSCR
- 0.27
- GRM
- 21.5
CMA / ARV
- ARV (median comp)
- $769,210
- List price
- $355,000
- Delta
- -53.85%
- Verdict
- UNDERPRICED
- Comps
- 20 within 1.0 mi
Projected returns pro-forma
-3.0% appreciation · 2.1% rent growth · sell at horizon
- IRR
- -50.4%
- Equity multiple
- -0.48×
- Total profit
- $-319,826
- Equity at exit
- $114,692
- IRR
- —
- Equity multiple
- -1.49×
- Total profit
- $-536,935
- Equity at exit
- $66,507
Cash invested: $215,379 (down + closing). Projections, not guarantees.
Landlord ↔ Tenant lean methodology
- Overall (STATE)
- 87 Strongly Landlord-Friendly
- State Texas
- 87 Strongly Landlord-Friendly · R+5
- County
- — inherits STATE
- City
- — inherits STATE
ZIP-level market 77091
- Home prices YoY
- -24.9%
- Rents YoY
- 2.1%
- Active inventory
- 675
- Price-to-rent
- 9.9×
Monthly cashflow live
- Estimated rent
- $2,985 high interval (Pro) →
- Mortgage (P&I)
- −$4,034
- Tax est. 1.5%
- −$962 /mo · $11,538/yr
- Insurance
- −$321
- Flood insurance flood zone
- −$66 /mo · $798/yr
- HOA
- −$0
- Vacancy / Maint / Mgmt
- −$627
- Net cashflow
- $-3,024
Break-even live
UW: 25.0% down · 7.5% · 30yr · 1.5% tax · 5.0% vac · 8.0% maint · 8.0% mgmt
Financing live
Cash to close
- Down payment
- $192,303
- Closing costs
- $23,076
- Reserves months
- —
- Total cash needed
- —
Loan-product check · same deal, 3 products live
Conventional
25% down · 7.5% · 30yr
- Down + closing
- —
- Monthly P&I
- —
- Monthly cashflow
- —
- DSCR
- —
- Eligible?
- —
Personal DTI + credit; lowest rate.
DSCR
20% down · 8.5% · 30yr
- Down + closing
- —
- Monthly P&I
- —
- Monthly cashflow
- —
- DSCR
- —
- Eligible?
- —
No personal income docs; deal must DSCR.
Hard money
10% down · 12.0% · 12mo
- Down + closing
- —
- Monthly P&I
- —
- Monthly cashflow
- —
- DSCR
- —
- Eligible?
- —
Short-term bridge; refi at stabilization.
Rent comps 40 comps
| Address | Beds | Baths | Sqft | Rent | $/sqft | DOM | Units | Dist |
|---|---|---|---|---|---|---|---|---|
| 1116 Woodland St Houston, TX | 3.0 | 2.0 | 2400 | $4,000 | $1.67 | 43d | 1 | 0.23mi |
| 1111 Studewood St Houston, TX | 2.0 | 2.0 | 1240 | $2,075 | $1.67 | 15d | 1 | 0.35mi |
| 825 Usener St Houston, TX | 2.0 | 1.0–2.0 | 1050 | $2,925 | $2.79 | 2d | 27 | 0.56mi |
| 401 Walton St Houston, TX | 3.0 | 2.0 | 2112 | $2,500 | $1.18 | 15d | 1 | 0.62mi |
| 4615 Indie Heights Ln Houston, TX | 2.0 | 2.0 | 1685 | $2,900 | $1.72 | 43d | 1 | 0.75mi |
| 725 Peddie St Unit 1257756P Houston, TX | 2.0 | 1.0 | 1496 | $5,083 | $3.40 | 43d | 1 | 0.86mi |
| 1127 Walling St Unit R Houston, TX | 2.0 | 2.0 | 1400 | $2,295 | $1.64 | 43d | 1 | 0.90mi |
| 2000 Taylor St Houston, TX | 2.0 | 1.0–2.0 | 916 | $3,082 | $3.36 | 2d | 33 | 0.90mi |
| 2114 Sabine St Unit 1257735P Houston, TX | 3.0 | 3.5 | 2594 | $6,588 | $2.54 | 43d | 1 | 0.95mi |
| 2114 Sabine St Houston, TX | 3.0 | 4.0 | 2020 | $3,200 | $1.58 | 43d | 1 | 0.95mi |
| 655 Yale St Houston, TX | 2.0 | 1.0–2.0 | 978 | $2,842 | $2.91 | 2d | 39 | 0.99mi |
| 604 E 17th St Houston, TX | 3.0 | 2.0 | 1724 | $3,500 | $2.03 | 43d | 1 | 1.00mi |
| 2018 Crockett St Unit 2018 Houston, TX | 3.0 | 3.5 | 2514 | $8,000 | $3.18 | 43d | 1 | 1.02mi |
| 2018 Crockett St Unit 1029793P Houston, TX | 3.0 | 3.5 | 2507 | $6,482 | $2.59 | 5d | 1 | 1.02mi |
| 525 Yale St Houston, TX | 2.0 | 1.0–2.0 | 1017 | $3,345 | $3.29 | 1d | 41 | 1.05mi |
| 2305 Summer St Houston, TX | 2.0 | 1.0–2.0 | 842 | $3,046 | $3.62 | 1d | 11 | 1.08mi |
| 207 Carl St Houston, TX | 2.0 | 2.0 | 1230 | $2,250 | $1.83 | 43d | 1 | 1.09mi |
| 1520 Oliver St Houston, TX | 2.0 | 1.0–2.0 | 926 | $2,865 | $3.09 | 2d | 45 | 1.16mi |
| 3003 Summer St Houston, TX | 1.0–2.0 | 1.0–2.0 | 1008 | $3,216 | $3.19 | 3d | 36 | 1.16mi |
| 1512 Crockett St Unit A Houston, TX | 2.0 | 2.5 | 1808 | $2,800 | $1.55 | 43d | 1 | 1.17mi |
| 1510 Crockett St Houston, TX | 2.0 | 3.0 | 1912 | $2,800 | $1.46 | 43d | 1 | 1.17mi |
| 3030 Summer St Houston, TX | 1.0–2.0 | 1.0–2.0 | 911 | $2,394 | $2.63 | 2d | 35 | 1.17mi |
| 1441 East St Unit 592 Houston, TX | 2.0 | 2.0 | 1385 | $1,824 | $1.32 | 43d | 1 | 1.18mi |
| 3275 Summer St Houston, TX | 1.0–2.0 | 1.0–2.5 | 995 | $2,570 | $2.58 | 2d | 17 | 1.19mi |
| 1141 Louise St Houston, TX | 4.0 | 4.0 | 2228 | $4,000 | $1.80 | 43d | 1 | 1.20mi |
| 4605 Fisk St Houston, TX | 3.0 | 2.0 | 1628 | $3,000 | $1.84 | 43d | 1 | 1.23mi |
| 2121 Edwards St Houston, TX | 2.0 | 1.0–2.0 | 879 | $2,880 | $3.27 | 3d | 25 | 1.26mi |
| 1614 Northwood St Houston, TX | 3.0 | 3.5 | 2300 | $2,850 | $1.24 | 44d | 1 | 1.29mi |
| 2403 Everett St Unit A Houston, TX | 3.0 | 3.5 | 2093 | $2,800 | $1.34 | 43d | 1 | 1.30mi |
| 770 Strawberry Pines Ct Houston, TX | 2.0–3.0 | 2.5 | 1422 | $2,735 | $1.92 | 1d | 12 | 1.32mi |
| 120 Yale St Unit 22 Houston, TX | 2.0 | 2.0 | 1258 | $1,800 | $1.43 | 43d | 1 | 1.33mi |
| 1617 Enid St Houston, TX | 1.0–2.0 | 1.0–2.0 | 974 | $2,417 | $2.48 | 2d | 56 | 1.34mi |
| 1011 Studemont St Unit 358 Houston, TX | 2.0 | 2.0 | 1364 | $2,102 | $1.54 | 43d | 1 | 1.35mi |
| 1011 Studemont St Unit 2534 Houston, TX | 2.0 | 2.0 | 1324 | $1,998 | $1.51 | 43d | 1 | 1.35mi |
| 4040 Koehler St Unit 422 Houston, TX | 2.0 | 2.0 | 1273 | $2,060 | $1.62 | 7d | 1 | 1.39mi |
| 4040 Koehler St Unit 2162 Houston, TX | 2.0 | 2.0 | 1273 | $2,060 | $1.62 | 5d | 1 | 1.39mi |
| 705 Link Rd Houston, TX | 3.0 | 3.5 | 1850 | $2,600 | $1.41 | 7d | 1 | 1.41mi |
| 4040 Koehler St Unit 2174 Houston, TX | 2.0 | 2.0 | 1273 | $2,084 | $1.64 | 11d | 1 | 1.42mi |
| 4040 Koehler St Unit 4077 Houston, TX | 2.0 | 2.0 | 1273 | $2,095 | $1.65 | 12d | 1 | 1.42mi |
| 4040 Koehler St Unit 425 Houston, TX | 2.0 | 2.0 | 1273 | $2,052 | $1.61 | 3d | 1 | 1.42mi |
Listing history 15 events
-
2026-06-18price $355,000 Active 42 DOM
-
2026-06-18days on market $359,900 Active 42 DOM
-
2026-06-17days on market $359,900 Active 41 DOM
-
2026-06-16days on market $359,900 Active 40 DOM
-
2026-06-15days on market $359,900 Active 39 DOM
-
2026-06-13pricedays on market $359,900 Active 37 DOM
-
2026-06-10days on market $374,000 Active 33 DOM
-
2026-06-08days on market $374,000 Active 32 DOM
-
2026-06-07days on market $374,000 Active 31 DOM
-
2026-06-04days on market $374,000 Active 28 DOM
-
2026-06-01days on market $374,000 Active 25 DOM
-
2026-05-31days on market $374,000 Active 24 DOM
-
2026-05-07$374,000 Active 425-char remark
-
2026-04-27historical
-
2026-03-06$374,000 Active
ⓘ Source: listings_history table (triggers on properties + properties_extension) + one-shot
backfill from property_details.listing_events for pre-trigger history.
Tax reassessment forecast TX · Resets to sale price
- Current annual tax
- $830 · $69/mo
- Projected year-2 tax
- $6,496 · $541/mo
- Expected delta
- +$5,666/yr (+$472/mo · 682.5%)
ⓘ Screening estimate from a state-policy table — verify with the county assessor before closing.
Climate risk First Street
- Flood 7/10 Severe FEMA zone X (unshaded) · 99% chance over 30 yrs
- Wildfire 1/10 Low
- Heat 9/10 Extreme 7 d/yr ≥109°F today · 24 d/yr by 30 yrs out
- Wind 9/10 Extreme 99% chance of damaging wind over 30 yrs
- Air quality 3/10 Moderate 2 unhealthy d/yr today · 3 by 30 yrs out
Nearby sold comps map
Loading sold comps map…
Walkable amenities ~0.75 mi
Loading nearby amenities…
Taxation est. · year 1
- Rental income
- $35,825
- − Mortgage interest
- −$43,088
- − Property taxes
- −$11,538
- − Insurance
- −$4,644
- − Repairs & maintenance
- −$2,866
- − Management
- −$2,866
- − Depreciation
- −$22,377
- Taxable loss
- −$51,553
- Est. tax savings @ 24.0%
- +$12,373
- After-tax cash flow
- $-23,913/yr
For passive investors: Depreciation is non-cash, so a rental often shows a tax loss while cash-flowing — sheltering income. Rental losses are passive: they offset passive income freely, and up to $25,000/yr can offset ordinary (W-2) income if you actively participate and your MAGI is under $100k (phasing out to $0 by $150k); unused losses carry forward. On sale, claimed depreciation is recaptured at up to 25%, and gains may owe capital-gains tax (a 1031 exchange can defer both). Figures are a year-1 estimate at your 24.0% rate — not tax advice; consult a CPA.
Schools (NCES district)
- District
- Houston ISD
- NCES district ID
- 4823640
- Math proficiency
- 27% ▼ -18.00%
- Reading proficiency
- 35% ▼ -6.00%
- Median HH income
- $46,054
- Composite
- 26.63/100
- National rank
- #7173
- State rank
- #593 of 826 in TX
Livability — Houston
- Score
- 74/100
- State rank
- #184
- US rank
- #4771
Category grades
Schools grade is shown separately in the Schools card above.
Census & demographics
- Census place
- Houston, TX
- County
- Harris County · 4,702,590 people
- City population
- 3,226,434
- Metro
- Houston-The Woodlands-Sugar Land, TX
- Population (ZIP)
- 28,728
- Household income
- $35,432
- Rent vs Own
- Severe rent burden
- 3210.0
Population outlook (Harris County) Hauer SSP2
- Today (2025)
- 5,571,493 people
- By 2030
- 6,089,821 · +9.3%
- By 2040
- 7,142,806 · +28.2%
- By 2050
- 8,185,864 · +46.9%
- By 2075
- 10,574,329 · +89.8%
- By 2100
- 12,109,958 · +117.4%
Race, ethnicity, and origin ACS 2023
- Neighborhood character
- Diverse neighborhood (Simpson 0.58)
- Race & ethnicity
- Hispanic / Latino 46% Black 45% Two or more races 15% White 7%
- Hispanic origin (detail)
- Mexican 29%
- Common ancestry
- Italian 1%
- Foreign-born
- 24% · Canada, Jamaica
- Languages at home
- 55% English-only · Spanish 41% French/Haitian/Cajun 2%
Political lean MEDSL · Harris
- 2024 margin
- Lean D (+5.5) · D 52.0% · R 46.4% · Other 1.6%
- 2008→2024 swing
- +3.9pp toward D · 2008: 1.6pp · 2024: 5.5pp
- All cycles
- 2024: D+5.5 2020: D+13.3 2016: D+12.4 2012: D+0.1 2008: D+1.6
Not yet ingested
- Civics
- —
Market trends
- HPI YoY
- ▼ -94.19%
- Current HPI
- 283.7523
- Rent YoY
- ▲ 2.10%
- Metro
- Houston-The Woodlands-Sugar Land, TX
- State GDP YoY
- ▲ 3.95%
- F500 in state
- 110
Industry mix (Fortune 500 HQ in TX)
| Industry | F500 HQs | Revenue |
|---|---|---|
| Energy | 16 | $1,198B |
|
||
| Technology | 5 | $198B |
|
||
| Engineering / Construction | 4 | $72B |
|
||
| Energy Services | 3 | $60B |
|
||
| Utilities | 3 | $41B |
|
||
| Healthcare | 2 | $330B |
|
||
Price history
-3.8% since first listed4 events — show timeline
- 2026-06-13 Price Changed $359,900 HARMLS
- 2026-05-07 Listed $374,000 HARMLS
- 2026-04-27 Listing Removed — HARMLS
- 2026-03-06 Listed $374,000 HARMLS
Cash-flow waterfall
monthlySold comps — $/sqft
last 12 mo · ≤1 miLoading sold comps…