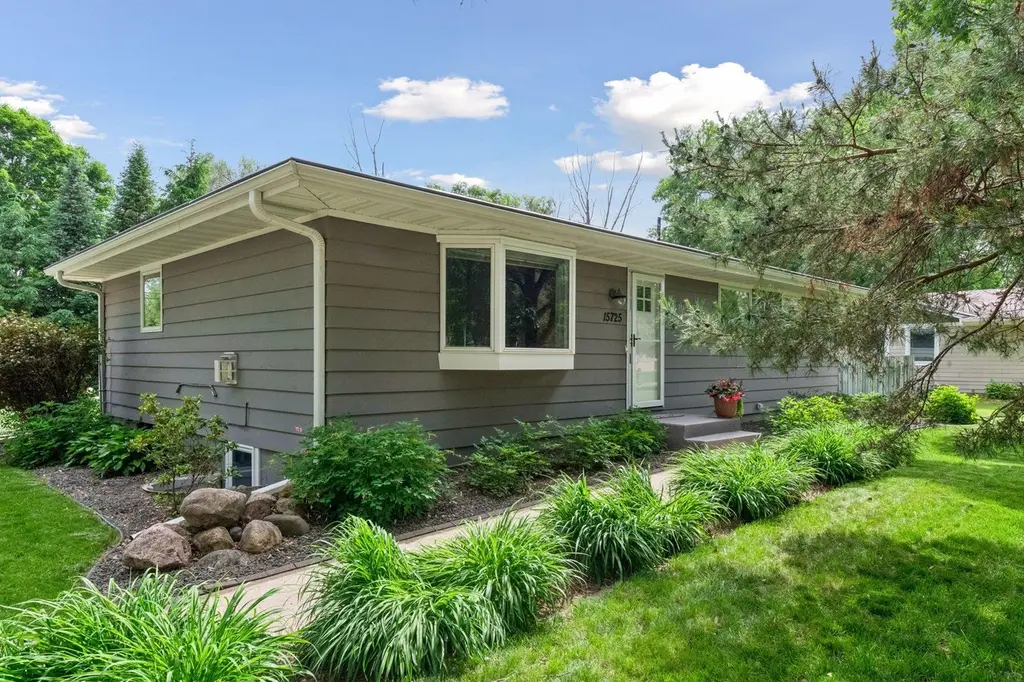
15725 2nd Ave N · Plymouth, MN
Flood risk 1/10 · Minimal
- FEMA flood zone
- X (unshaded)
- Chance of flooding over 30 yrs
- 0.0%
- Est. flood insurance / yr
- $473 – $860
Fire risk 1/10 · Minimal
- Est. fire insurance / yr
- $888 – $1,650
Heat risk 2/10 · Minimal
- Hot days now (above 98°F)
- 7 days/yr
- Hot days in 30 yrs
- 14 days/yr
Wind risk 2/10 · Minimal
- Chance of severe wind over 30 yrs
- —
Air-quality risk 2/10 · Minimal
- Unhealthy air days now
- 1 days/yr
- Unhealthy air days in 30 yrs
- 1 days/yr
Risk factors via First Street. Map © Google.
Why this score? — see what drove the F grade
The composite is a weighted blend of 9 inputs, each scored 0–100. Each bar is that input's sub-score; the figure is the points it added to the 100-point composite (weight × sub-score).
- ARV discount +7.5/15.0
- Schools +6.9/10.0
- Cash flow +6.6/30.0
- Livability +4.2/5.0
- Rent growth +2.8/5.0
- Condition / age +2.5/5.0
- 1% rule +1.1/10.0
- DSCR +0.9/10.0
- Appreciation +0.0/10.0
$575,000
🖨 Deal sheet 📄 Offer letter ✓ Due diligence
Listing remarks MLS
Granite, SS appliances, barn doors, private master bath, fenced in yard, new roof, new furnace, new A/C. What's left to ponder? You have found YOUR home. Flexible on closing and ready to go. Don't miss this wonderful home presented by Engel & Völkers Minneapolis!
Key facts
- 0.42 acre lot
- 2 garage spots
- Built 1961
Property features AI
Exterior
- Parking: Asphalt driveway; 2-car detached/attached garage, approximately 24 x 24
- Utilities: City water connected; City sewer connected; Natural gas; 100 amp service with circuit breakers; Xcel Energy power
- Home design: Residential property; One level + finished lower level; Above- and below-grade finished living areas
- Construction: Block and concrete construction; Block foundation; Roof older than 8 years
- Exterior features: Wood exterior; Patio; Chain link full fencing; Medium tree coverage; Located within six blocks of public transit; City street with curbs and paved streets; public maintained road
Interior
- Kitchen: Range; Microwave; Refrigerator; Dishwasher; Stainless steel appliances
- Bedrooms: 4 bedrooms total (Primary on main level); Bedroom sizes on main level include: 11.5 x 11.5; 11.5 x 9; 9.5 x 10; Lower level bedroom: 9.5 x 11.5
- Bathrooms: Primary bathroom is 3/4; One full bathroom on main floor; Basement bathroom/3/4 bath
- Heating & cooling: Forced air heating; Central air conditioning
- Interior features: Finished full basement with egress window(s); Gas fireplace in living room; Informal dining area and combined kitchen/dining or living/dining spaces; Primary bedroom suite; 3 bedrooms on one level
- Laundry & utility: Main/lower level laundry room; Washer and dryer included; Gas water heater; Owned water softener
Neighborhood map
What this means for you Summary
Snapshot
- This is a 4-bed/3.0-bath single-family listed at $575k.
Deal economics
- At list price, monthly cash flow is $-933 ($-11k/yr) — negative.
- To cash-flow at today's rent, offer at most $410k (28.7% below list).
- To meet the 1% rule (rent ≥ 1% of price), the offer needs to be $349k (39.3% below list).
- Recommended offer: $349k (39.3% below list) — sets the bar for 1% rule.
- Cap rate 4.3% vs local median 3.1% in Plymouth — top-decile yield for the area; either an underpriced asset or a hidden risk that comps aren't pricing in. Stress-test before assuming the spread holds.
Location & tenants
- Location reads 85/100 on livability (#17 in MN, #517 nationally) — a professional / high-income tenant draw. Strengths: schools A+, crime A+, commute A+; Watch: amenities F, cost of living F.
- Wayzata Public School District (urban): math 75% / reading 78% proficiency, ranked #2 of 301 in MN (top 1%) — strong family-tenant draw, lease renewals of 3-5y typical; only 11% free/reduced lunch — higher-income household profile.
- Market conditions: Rents rising (+1.1%/yr); 120 active listings in the ZIP; 4 comparable units currently listed for rent nearby; rentals leasing fast (median 2d on market — plan ~1-2 weeks tenant-placement turnaround); high-income renter base; 4,651 units permitted in Hennepin County in 2024 (2,443 in 5+ unit buildings).
- This rent runs 31% of the median local income ($134k/yr) — at the standard rent-burdened threshold; future hikes will face affordability resistance.
Forward outlook
- Local home prices are declining (-3.0%/yr); year-one equity from $4k of loan paydown is wiped out by about $17k of value loss. Plan a longer hold.
- Hennepin County population projected at +30% by 2050 — long-run rental-demand tailwind backs the buy-and-hold thesis.
Negotiation context
- Only 14 days on market — expect competitive offers; lowballing is unlikely to land.
- 5 sale attempts since 22y ago with the ask held roughly flat each time — persistent listings suggest the price (not the market) is what's stuck; bring a comps-based counter.
- Current owner paid $365k; list at $575k implies a 58% gain — meaningful room to come down on a strong offer.
Questions for the listing agent
- What do current leases actually rent for vs. the listed asking? Can we see a recent rent roll and the last 12 months of T-12 income?
- Built in 1961 — when were the roof, HVAC, electrical panel, plumbing, and water heater last replaced?
- Is there a deadline driving the sale (1031 exchange, divorce, estate, relocation)? That informs how much negotiation room exists.
- Schools are A-rated — typically a magnet for longer-tenancy family renters. What's the average tenant stay here, and is there a school-zone premium baked into asking?
- The area grade is low — what's the realistic commute time and amenity access for the typical tenant pool here? Any planned neighborhood developments (good or bad) we should know about?
- What's the average days-on-market for RENTAL listings here right now (not sales)? A rising rental-DOM trend means longer vacancies and softer asking-rent achievability than the comps imply.
- What's the recent tenant-quality profile in this submarket — average credit score on applications, eviction rate, late-payment / NSF rate, and stable-employment percentage? A property-management company in the area should have these aggregated.
- How much new for-sale + rental construction is in the pipeline within 1–3 miles? Heavy new supply typically softens prices + rents 12–24 months out; constrained supply supports both.
Investment metrics
- 1% rule
- 0.61% ✗
- Cap rate
- 4.35%
- Cash-on-cash
- -6.95%
- DSCR
- 0.69
- GRM
- 13.7
CMA / ARV
No comps found within radius.
Projected returns pro-forma
-3.0% appreciation · 1.15% rent growth · sell at horizon
- IRR
- -30.3%
- Equity multiple
- 0.01×
- Total profit
- $-159,104
- Equity at exit
- $85,734
- IRR
- -41.7%
- Equity multiple
- -0.50×
- Total profit
- $-240,792
- Equity at exit
- $49,715
Cash invested: $161,000 (down + closing). Projections, not guarantees.
Landlord ↔ Tenant lean methodology
- Overall (STATE)
- 46 Balanced
- State Minnesota
- 46 Balanced · D+2
- County
- — inherits STATE
- City
- — inherits STATE
ZIP-level market 55447
- Rents YoY
- 1.1%
- Active inventory
- 120
- Price-to-rent
- 13.7×
Monthly cashflow live
- Estimated rent
- $3,492 medium interval (Pro) →
- Mortgage (P&I)
- −$3,015
- Tax from tax record
- −$437 /mo · $5,246/yr
- Insurance
- −$240
- HOA
- −$0
- Vacancy / Maint / Mgmt
- −$733
- Net cashflow
- $-933
Break-even live
UW: 25.0% down · 7.5% · 30yr · 1.5% tax · 5.0% vac · 8.0% maint · 8.0% mgmt
Financing live
Cash to close
- Down payment
- $143,750
- Closing costs
- $17,250
- Reserves months
- —
- Total cash needed
- —
Loan-product check · same deal, 3 products live
Conventional
25% down · 7.5% · 30yr
- Down + closing
- —
- Monthly P&I
- —
- Monthly cashflow
- —
- DSCR
- —
- Eligible?
- —
Personal DTI + credit; lowest rate.
DSCR
20% down · 8.5% · 30yr
- Down + closing
- —
- Monthly P&I
- —
- Monthly cashflow
- —
- DSCR
- —
- Eligible?
- —
No personal income docs; deal must DSCR.
Hard money
10% down · 12.0% · 12mo
- Down + closing
- —
- Monthly P&I
- —
- Monthly cashflow
- —
- DSCR
- —
- Eligible?
- —
Short-term bridge; refi at stabilization.
Rent comps 4 comps
| Address | Beds | Baths | Sqft | Rent | $/sqft | DOM | Units | Dist |
|---|---|---|---|---|---|---|---|---|
| 17035 9th Ave N Unit 1369955P Minneapolis, MN | 3.0 | 2.0 | 1345 | $5,192 | $3.86 | 2d | 1 | 0.96mi |
| 15805 16th Pl N Minneapolis, MN | 3.0 | 2.5 | 2141 | $3,200 | $1.49 | 12d | 1 | 1.18mi |
| 15100 18th Ave N Minneapolis, MN | 1.0–3.0 | 1.0–2.0 | 1080 | $2,412 | $2.23 | 2d | 13 | 1.41mi |
| 910 Wayzata Blvd E Wayzata, MN | 1.0–3.0 | 1.0–3.0 | 1427 | $14,050 | $9.85 | 2d | 37 | 1.43mi |
Listing history 9 events
-
2026-06-18days on market $575,000 Active 14 DOM
-
2026-06-17days on market $575,000 Active 13 DOM
-
2026-06-16days on market $575,000 Active 12 DOM
-
2026-06-15days on market $575,000 Active 11 DOM
-
2026-06-13days on market $575,000 Active 9 DOM
-
2026-06-09days on market $575,000 Active 5 DOM
-
2026-06-08days on market $575,000 Active 4 DOM
-
2026-06-07remarks 699-char remark
-
2026-06-07$575,000 Active 3 DOM
ⓘ Source: listings_history table (triggers on properties + properties_extension) + one-shot
backfill from property_details.listing_events for pre-trigger history.
Tax reassessment forecast MN · Partial reset (capped growth)
- Current annual tax
- $5,246 · $437/mo
- Projected year-2 tax
- $5,843 · $487/mo
- Expected delta
- +$597/yr (+$50/mo · 11.4%)
ⓘ Screening estimate from a state-policy table — verify with the county assessor before closing.
Climate risk First Street
- Flood 1/10 Low FEMA zone X (unshaded) · 0% chance over 30 yrs
- Wildfire 1/10 Low
- Heat 2/10 Low 7 d/yr ≥98°F today · 14 d/yr by 30 yrs out
- Wind 2/10 Low
- Air quality 2/10 Low 1 unhealthy d/yr today · 1 by 30 yrs out
Nearby sold comps map
Loading sold comps map…
Walkable amenities ~0.75 mi
Loading nearby amenities…
Taxation est. · year 1
- Rental income
- $41,910
- − Mortgage interest
- −$32,209
- − Property taxes
- −$5,246
- − Insurance
- −$2,875
- − Repairs & maintenance
- −$3,353
- − Management
- −$3,353
- − Depreciation
- −$16,727
- Taxable loss
- −$21,853
- Est. tax savings @ 24.0%
- +$5,245
- After-tax cash flow
- $-5,952/yr
For passive investors: Depreciation is non-cash, so a rental often shows a tax loss while cash-flowing — sheltering income. Rental losses are passive: they offset passive income freely, and up to $25,000/yr can offset ordinary (W-2) income if you actively participate and your MAGI is under $100k (phasing out to $0 by $150k); unused losses carry forward. On sale, claimed depreciation is recaptured at up to 25%, and gains may owe capital-gains tax (a 1031 exchange can defer both). Figures are a year-1 estimate at your 24.0% rate — not tax advice; consult a CPA.
Schools (NCES district)
- District
- Wayzata Public School District
- NCES district ID
- 2742160
- Math proficiency
- 75% ▼ -4.00%
- Reading proficiency
- 78% ▼ -3.00%
- Median HH income
- $91,783
- Composite
- 68.75/100
- National rank
- #336
- State rank
- #2 of 301 in MN
Livability — Plymouth
- Score
- 85/100
- State rank
- #17
- US rank
- #517
Category grades
Schools grade is shown separately in the Schools card above.
Census & demographics
- Census place
- Plymouth, MN
- County
- Hennepin County · 1,150,272 people
- City population
- 79,816
- Metro
- Minneapolis-St. Paul-Bloomington, MN-WI
- Population (ZIP)
- 20,931
- Household income
- $133,555
- Rent vs Own
- Severe rent burden
- 265.0
Population outlook (Hennepin County) Hauer SSP2
- Today (2025)
- 1,405,227 people
- By 2030
- 1,492,650 · +6.2%
- By 2040
- 1,660,157 · +18.1%
- By 2050
- 1,823,498 · +29.8%
- By 2075
- 2,221,283 · +58.1%
- By 2100
- 2,509,976 · +78.6%
Race, ethnicity, and origin ACS 2023
- Neighborhood character
- Predominantly White (83%)
- Race & ethnicity
- White 83% Two or more races 6% Asian 5% Hispanic / Latino 5% Black 3%
- Common ancestry
- Portuguese 14% Romanian 4% Lithuanian 3%
- Foreign-born
- 10% · Canada, China, Dominican Republic
- Languages at home
- 88% English-only · Spanish 3% Other Asian/Pacific 2% Russian/Polish/Slavic 2%
Political lean MEDSL · Hennepin
- 2024 margin
- Solid D (+42.6) · D 70.2% · R 27.5% · Other 2.3%
- 2008→2024 swing
- +14.0pp toward D · 2008: 28.6pp · 2024: 42.6pp
- All cycles
- 2024: D+42.6 2020: D+43.2 2016: D+35.3 2012: D+27.1 2008: D+28.6
Not yet ingested
- Civics
- —
Market trends
- HPI YoY
- ▼ -380.57%
- Current HPI
- 229.7126
- Rent YoY
- ▲ 1.15%
- Metro
- Minneapolis-St. Paul-Bloomington, MN-WI
- State GDP YoY
- ▲ 2.41%
- F500 in state
- 34
Industry mix (Fortune 500 HQ in MN)
| Industry | F500 HQs | Revenue |
|---|---|---|
| Healthcare | 2 | $407B |
|
||
| Retail | 2 | $150B |
|
||
| Consumer Goods | 2 | $32B |
|
||
| Industrial Machinery | 2 | $6B |
|
||
| Agriculture | 1 | $40B |
|
||
| Healthcare / Medical Devices | 1 | $32B |
|
||
Price history
+646.8% since first listed17 events — show timeline
- 2026-06-05 Listed $575,000 NORTHSTARMLS as Distributed by MLS Grid
- 2026-06-04 Coming Soon $575,000 NORTHSTARMLS as Distributed by MLS Grid
- 2017-05-05 Sold (Public Records) $365,000 Public Records
- 2017-04-20 Sold (MLS) $365,000 NORTHSTARMLS as Distributed by MLS Grid
- 2017-03-23 Pending — NORTHSTARMLS as Distributed by MLS Grid
- 2017-03-18 Contingent — NORTHSTARMLS as Distributed by MLS Grid
- 2017-03-16 Listed $359,900 NORTHSTARMLS as Distributed by MLS Grid
- 2010-04-28 Sold (Public Records) $233,000 Public Records
- 2010-04-19 Sold (MLS) $233,000 NORTHSTARMLS as Distributed by MLS Grid
- 2010-03-03 Listing Removed — NORTHSTARMLS as Distributed by MLS Grid
- 2010-01-25 Listed $230,000 NORTHSTARMLS as Distributed by MLS Grid
- 2005-07-19 Listing Removed — NORTHSTARMLS as Distributed by MLS Grid
- 2005-01-19 Listed $269,900 NORTHSTARMLS as Distributed by MLS Grid
- 2004-12-11 Listing Removed — NORTHSTARMLS as Distributed by MLS Grid
- 2004-10-11 Listed $269,900 NORTHSTARMLS as Distributed by MLS Grid
- 1986-04-01 Sold (Public Records) $80,000 Public Records
- 1981-10-01 Sold (Public Records) $77,000 Public Records
Property tax history
+6.4%/yrLatest (2025): $5,246 · +6.2% YoY. Source: county tax records.
Cash-flow waterfall
monthlySold comps — $/sqft
last 12 mo · ≤1 miLoading sold comps…