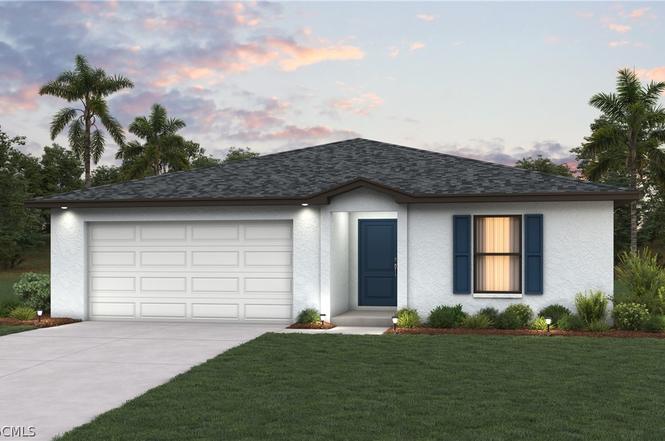
8007 Van Ct · Port LaBelle, FL
Flood risk 1/10 · Minimal
- FEMA flood zone
- X (unshaded)
- Chance of flooding over 30 yrs
- 0.0%
- Est. flood insurance / yr
- $507 – $1,088
Fire risk 2/10 · Minimal
- Est. fire insurance / yr
- $947 – $1,759
Heat risk 9/10 · Severe
- Hot days now (above 108°F)
- 7 days/yr
- Hot days in 30 yrs
- 26 days/yr
Wind risk 10/10 · Severe
- Chance of severe wind over 30 yrs
- 99.0%
Air-quality risk 2/10 · Minimal
- Unhealthy air days now
- 2 days/yr
- Unhealthy air days in 30 yrs
- 2 days/yr
Risk factors via First Street. Map © Google.
Why this score? — see what drove the D grade
The composite is a weighted blend of 9 inputs, each scored 0–100. Each bar is that input's sub-score; the figure is the points it added to the 100-point composite (weight × sub-score).
- Appreciation +10.0/10.0
- Cash flow +9.0/30.0
- ARV discount +7.5/15.0
- Schools +3.1/10.0
- Livability +3.1/5.0
- 1% rule +2.7/10.0
- DSCR +2.5/10.0
- Rent growth +2.5/5.0
- Condition / age +2.5/5.0
$287,990
🖨 Deal sheet 📄 Offer letter ✓ Due diligence
Listing remarks
NEW CONSTRUCTION WITH WARRANTY! * * Move-in Ready! * * The Sandpiper is designed for the way you live—comfortable, connected, and full of thoughtful details. The open kitchen, dining, and living areas create an inviting space for family time or entertaining, while the covered lanai extends your living area outdoors. The private primary suite offers a spacious walk-in closet and a relaxing bath with a large shower, and three additional bedrooms provide flexible space for family, guests, or a home office. Quartz countertops in the kitchen & bathrooms, upgraded plank tile flooring throughout the main living areas, a complete stainless steel kitchen appliance package, hurrican
Key facts
- 2 garage spots
- Built 2026
- Listed 121 days
Property features AI
Finance
- Financial info: Pets allowed
- HOA & community: No association fee reported
Exterior
- Parking: Attached garage; 2 covered garage spaces; Driveway; Paved parking; Garage door opener
- Security: Smoke detector(s); Security / High impact doors
- Utilities: Public water; Septic tank sewer; Cable available
- Home design: Single-story home; Entry level: 1; Faces north; Under construction
- Construction: Built with block, concrete and stucco; Shingle roof; Foundation: (not specified)
- Exterior features: Patio (open); Porch; Security / High impact doors; Paved road access; Rectangular lot; Lot dimensions: 87 x 160 x 80 x 125; Lot dimension source: Survey; Lot size source: Survey; South exposure
Interior
- Kitchen: Dishwasher; Icemaker; Microwave; Range; Refrigerator; Refrigerator with ice maker; Pantry / Walk-in pantry; Breakfast bar
- Bedrooms: Guest quarters
- Flooring: Carpet; Tile
- Bathrooms: 2 full bathrooms; Separate shower (shower only)
- Heating & cooling: Central heating (electric); Central air conditioning (electric)
- Interior features: Impact glass windows; Breakfast bar; Open living/dining area; Main level primary bedroom; Pantry / Walk-in pantry; Separate shower (shower only); Cable TV ready; Walk-in closet(s); Split bedroom layout
- Laundry & utility: Washer hookup inside; Dryer hookup inside
Neighborhood map
What this means for you Summary
Snapshot
- This is a 4-bed/2.0-bath land listed at $288k.
Deal economics
- At list price, monthly cash flow is $-229 ($-3k/yr) — negative.
- To cash-flow at today's rent, offer at most $255k (11.5% below list).
- To meet the 1% rule (rent ≥ 1% of price), the offer needs to be $223k (22.6% below list).
- Recommended offer: $223k (22.6% below list) — sets the bar for 1% rule.
Location & tenants
- Location reads 62/100 on livability (#750 in FL) — a middle-class / working-renter tenant base. Strengths: cost of living A+, housing A+; Watch: schools F, amenities F, commute F.
- Hendry (town): math 35% / reading 40% proficiency, ranked #65 of 73 in FL (top 89%) — families likely to look elsewhere, expect single-tenant / working-renter base with shorter leases; 75% free/reduced lunch — lower-income household profile, screen leases tightly.
- Market conditions: 942 active listings in the ZIP; 21 comparable units currently listed for rent nearby; rentals at typical pace (median 16d on market — plan ~3-4 weeks tenant-placement turnaround); 557 units permitted in Hendry County in 2024 (45 in 5+ unit buildings).
- At $2,230/mo this rent would consume 47% of the median local household income ($57k/yr) (locally 498% of renters already pay >50% of income on rent) — very limited rent-growth headroom before tenants either downsize or default.
Forward outlook
- In year one you build about $31k of equity ($2k loan paydown + $29k appreciation (10.0% local appreciation)).
- Hendry County population projected to shrink 7% by 2050 — rents likely to lag national; underwrite the cash flow, not the appreciation.
- By year 2, paydown + projected appreciation supports a ~$49k cash-out refi (75% LTV) — recoverable capital for the next deal without selling this one.
Negotiation context
- It's been on market 121 days — a 12% lower offer ($253k) is reasonable based on typical stale-listing flexibility.
- 2 sale attempts with the ask held roughly flat each time — persistent listings suggest the price (not the market) is what's stuck; bring a comps-based counter.
- Current owner paid $19k; list at $288k implies a 1432% gain — meaningful room to come down on a strong offer.
Risks & watch-outs
- Climate carrying-cost: severe wind risk, 99% chance of damaging wind over 30y; extreme-heat days projected 7→26/yr by 2055 (HVAC capex compounding) — expect insurance premiums to compound above CPI over the hold.
Questions for the listing agent
- What do current leases actually rent for vs. the listed asking? Can we see a recent rent roll and the last 12 months of T-12 income?
- It's been on market 121 days. Have you received any prior offers? Is the seller open to a 23% concession, seller financing, or rate buy-down credit?
- Why hasn't it sold? Are there any deal-killer items the seller is aware of (foundation, flood, title, zoning, code violations)?
- Is there a deadline driving the sale (1031 exchange, divorce, estate, relocation)? That informs how much negotiation room exists.
- Schools are F-rated, which usually means shorter tenancies and higher turnover. Who's the typical renter profile here, and what's been the actual vacancy rate?
- The area grade is low — what's the realistic commute time and amenity access for the typical tenant pool here? Any planned neighborhood developments (good or bad) we should know about?
- What's the average days-on-market for RENTAL listings here right now (not sales)? A rising rental-DOM trend means longer vacancies and softer asking-rent achievability than the comps imply.
- What's the recent tenant-quality profile in this submarket — average credit score on applications, eviction rate, late-payment / NSF rate, and stable-employment percentage? A property-management company in the area should have these aggregated.
- How much new for-sale + rental construction is in the pipeline within 1–3 miles? Heavy new supply typically softens prices + rents 12–24 months out; constrained supply supports both.
Investment metrics
- 1% rule
- 0.77% ✗
- Cap rate
- 5.34%
- Cash-on-cash
- -3.41%
- DSCR
- 0.85
- GRM
- 10.8
CMA / ARV
No comps found within radius.
Projected returns pro-forma
10.0% appreciation · 3.0% rent growth · sell at horizon
- IRR
- 21.9%
- Equity multiple
- 2.76×
- Total profit
- $142,306
- Equity at exit
- $259,444
- IRR
- 19.7%
- Equity multiple
- 6.34×
- Total profit
- $430,596
- Equity at exit
- $559,501
Cash invested: $80,637 (down + closing). Projections, not guarantees.
Landlord ↔ Tenant lean methodology
- Overall (STATE)
- 87 Strongly Landlord-Friendly
- State Florida
- 87 Strongly Landlord-Friendly · R+3
- County
- — inherits STATE
- City
- — inherits STATE
ZIP-level market 33935
- Home prices YoY
- 16.3%
- Active inventory
- 942
- Price-to-rent
- 10.8×
Monthly cashflow live
- Estimated rent
- $2,230 high interval (Pro) →
- Mortgage (P&I)
- −$1,510
- Tax est. 1.5%
- −$360 /mo · $4,320/yr
- Insurance
- −$120
- HOA
- −$0
- Vacancy / Maint / Mgmt
- −$468
- Net cashflow
- $-229
Break-even live
UW: 25.0% down · 7.5% · 30yr · 1.5% tax · 5.0% vac · 8.0% maint · 8.0% mgmt
Financing live
Cash to close
- Down payment
- $71,998
- Closing costs
- $8,640
- Reserves months
- —
- Total cash needed
- —
Loan-product check · same deal, 3 products live
Conventional
25% down · 7.5% · 30yr
- Down + closing
- —
- Monthly P&I
- —
- Monthly cashflow
- —
- DSCR
- —
- Eligible?
- —
Personal DTI + credit; lowest rate.
DSCR
20% down · 8.5% · 30yr
- Down + closing
- —
- Monthly P&I
- —
- Monthly cashflow
- —
- DSCR
- —
- Eligible?
- —
No personal income docs; deal must DSCR.
Hard money
10% down · 12.0% · 12mo
- Down + closing
- —
- Monthly P&I
- —
- Monthly cashflow
- —
- DSCR
- —
- Eligible?
- —
Short-term bridge; refi at stabilization.
Rent comps 21 comps
| Address | Beds | Baths | Sqft | Rent | $/sqft | DOM | Units | Dist |
|---|---|---|---|---|---|---|---|---|
| 8002 Vega Ct Labelle, FL | 3.0 | 2.0 | 1389 | $1,900 | $1.37 | 23d | 1 | 0.07mi |
| 8004 Spice Ct Labelle, FL | 3.0 | 2.0 | 1292 | $2,000 | $1.55 | 19d | 1 | 0.27mi |
| 8049 Memory Cir Labelle, FL | 4.0 | 2.0 | 1686 | $2,000 | $1.19 | 3d | 1 | 0.39mi |
| 8033 Melody Cir Labelle, FL | 3.0 | 2.0 | 1215 | $1,999 | $1.65 | 15d | 1 | 0.43mi |
| 8030 Olive Cir Labelle, FL | 4.0 | 2.0 | 1499 | $2,300 | $1.53 | 3d | 1 | 0.60mi |
| 1535 Argosy Rd Labelle, FL | 4.0 | 2.0 | 1836 | $1,675 | $0.91 | 3d | 1 | 0.63mi |
| 1064 Calumet Rd Labelle, FL | 3.0 | 2.5 | 1503 | $2,200 | $1.46 | 23d | 1 | 0.68mi |
| 9007 Meadow Cir Labelle, FL | 4.0 | 2.0 | 1500 | $1,695 | $1.13 | 3d | 1 | 0.96mi |
| 1088 Saturn Ct Labelle, FL | 4.0 | 2.0 | 1439 | $2,200 | $1.53 | 19d | 1 | 1.00mi |
| 1173 E Benbow Cir Labelle, FL | 3.0 | 2.0 | 1212 | $2,000 | $1.65 | 3d | 1 | 1.01mi |
| 1209 Banjo Ct Labelle, FL | 3.0 | 2.0 | 1440 | $2,050 | $1.42 | 23d | 1 | 1.02mi |
| 9035 W Crow Cir Labelle, FL | 4.0 | 2.0 | 1530 | $1,950 | $1.27 | 3d | 1 | 1.05mi |
| 6210 Forest Ct Labelle, FL | 3.0 | 2.5 | 1503 | $2,200 | $1.46 | 23d | 1 | 1.14mi |
| 6018 Acorn Cir Labelle, FL | 3.0 | 2.0 | 1408 | $2,200 | $1.56 | 15d | 1 | 1.15mi |
| 9011 Penny Cir Labelle, FL | 3.0 | 2.0 | 1731 | $2,400 | $1.39 | 23d | 1 | 1.18mi |
| 9012 S Indio Ct Labelle, FL | 3.0 | 2.0 | 1400 | $2,100 | $1.50 | 19d | 1 | 1.21mi |
| 7061 Tide Cir Labelle, FL | 4.0 | 2.0 | 1500 | $1,695 | $1.13 | 23d | 1 | 1.23mi |
| 9001 Penny Cir Labelle, FL | 3.0 | 2.0 | 1472 | $2,300 | $1.56 | 15d | 1 | 1.26mi |
| 9001 Penny Cir Labelle, FL | 3.0 | 2.0 | 1472 | $2,300 | $1.56 | 23d | 1 | 1.26mi |
| 9018 W Justice Cir Labelle, FL | 4.0 | 2.0 | 1499 | $1,950 | $1.30 | 11d | 1 | 1.33mi |
| 7016 Palpano Cir Labelle, FL | 3.0 | 2.5 | 1507 | $2,100 | $1.39 | 15d | 1 | 1.43mi |
Listing history 9 events
-
2026-06-18days on market $287,990 Active 121 DOM
-
2026-06-17days on market $287,990 Active 120 DOM
-
2026-06-16days on market $287,990 Active 119 DOM
-
2026-06-15statusdays on market $287,990 Active 118 DOM
-
2026-05-06status Pending
-
2026-02-17$287,990 Active
-
2026-02-13$287,990 Active
-
2024-12-17soldstatus $18,800
-
2004-10-29soldstatus $14,000
ⓘ Source: listings_history table (triggers on properties + properties_extension) + one-shot
backfill from property_details.listing_events for pre-trigger history.
Climate risk First Street
- Flood 1/10 Low FEMA zone X (unshaded) · 0% chance over 30 yrs
- Wildfire 2/10 Low
- Heat 9/10 Extreme 7 d/yr ≥108°F today · 26 d/yr by 30 yrs out
- Wind 10/10 Extreme 99% chance of damaging wind over 30 yrs
- Air quality 2/10 Low 2 unhealthy d/yr today · 2 by 30 yrs out
Nearby sold comps map
Loading sold comps map…
Walkable amenities ~0.75 mi
Loading nearby amenities…
Taxation est. · year 1
- Rental income
- $26,755
- − Mortgage interest
- −$16,132
- − Property taxes
- −$4,320
- − Insurance
- −$1,440
- − Repairs & maintenance
- −$2,140
- − Management
- −$2,140
- − Depreciation
- −$8,378
- Taxable loss
- −$7,795
- Est. tax savings @ 24.0%
- +$1,871
- After-tax cash flow
- $-875/yr
For passive investors: Depreciation is non-cash, so a rental often shows a tax loss while cash-flowing — sheltering income. Rental losses are passive: they offset passive income freely, and up to $25,000/yr can offset ordinary (W-2) income if you actively participate and your MAGI is under $100k (phasing out to $0 by $150k); unused losses carry forward. On sale, claimed depreciation is recaptured at up to 25%, and gains may owe capital-gains tax (a 1031 exchange can defer both). Figures are a year-1 estimate at your 24.0% rate — not tax advice; consult a CPA.
Schools (NCES district)
- District
- Hendry
- NCES district ID
- 1200780
- Math proficiency
- 35% ▼ -11.00%
- Reading proficiency
- 40% ▼ -4.00%
- Median HH income
- $37,043
- Composite
- 31.16/100
- National rank
- #6054
- State rank
- #65 of 73 in FL
Livability — Port LaBelle
- Score
- 62/100
- State rank
- #750
- US rank
- #16264
Category grades
Schools grade is shown separately in the Schools card above.
Census & demographics
- Census place
- Port LaBelle, FL
- County
- Hendry County · 23,186 people
- Metro
- Clewiston, FL
- Population (ZIP)
- 23,186
- Household income
- $57,009
- Rent vs Own
- Severe rent burden
- 498.0
Population outlook (Hendry County) Hauer SSP2
- Today (2025)
- 38,866 people
- By 2030
- 38,558 · -0.8%
- By 2040
- 37,743 · -2.9%
- By 2050
- 36,117 · -7.1%
- By 2075
- 30,070 · -22.6%
- By 2100
- 21,966 · -43.5%
Race, ethnicity, and origin ACS 2023
- Neighborhood character
- Majority Hispanic (56%)
- Race & ethnicity
- Hispanic / Latino 56% White 39% Two or more races 21% Black 2% Native American 2%
- Hispanic origin (detail)
- Mexican 40% Puerto Rican 3% Cuban 5%
- Common ancestry
- Lithuanian 2% Serbian 2% Slovak 1%
- Foreign-born
- 27% · Canada, Jamaica
- Languages at home
- 50% English-only · Spanish 50%
Political lean MEDSL · Hendry
- 2024 margin
- Solid R (+38.3) · D 30.4% · R 68.7%
- 2008→2024 swing
- -31.1pp toward R · 2008: -7.2pp · 2024: -38.3pp
- All cycles
- 2024: R+38.3 2020: R+23.0 2016: R+14.2 2012: R+5.9 2008: R+7.2
Not yet ingested
- Civics
- —
Market trends
- HPI YoY
- ▲ 75.20%
- Current HPI
- 537.4928
- Rent YoY
- —
- Metro
- Clewiston, FL
- State GDP YoY
- ▲ 3.28%
- F500 in state
- 36
Industry mix (Fortune 500 HQ in FL)
| Industry | F500 HQs | Revenue |
|---|---|---|
| Industrial Technology | 2 | $29B |
|
||
| Insurance | 2 | $17B |
|
||
| Retail | 1 | $60B |
|
||
| Technology Distribution | 1 | $58B |
|
||
| Homebuilding | 1 | $35B |
|
||
| Technology Manufacturing | 1 | $35B |
|
||
Price history
+1957.1% since first listed5 events — show timeline
- 2026-05-06 Pending — FORTMLS
- 2026-02-17 Listed $287,990 Zillow
- 2026-02-13 Listed $287,990 FORTMLS
- 2024-12-17 Sold (Public Records) $18,800 Public Records
- 2004-10-29 Sold (Public Records) $14,000 Public Records
Property tax history
+13.0%/yrLatest (2025): $547 · +78.1% YoY. Source: county tax records.
Cash-flow waterfall
monthlySold comps — $/sqft
last 12 mo · ≤1 miLoading sold comps…