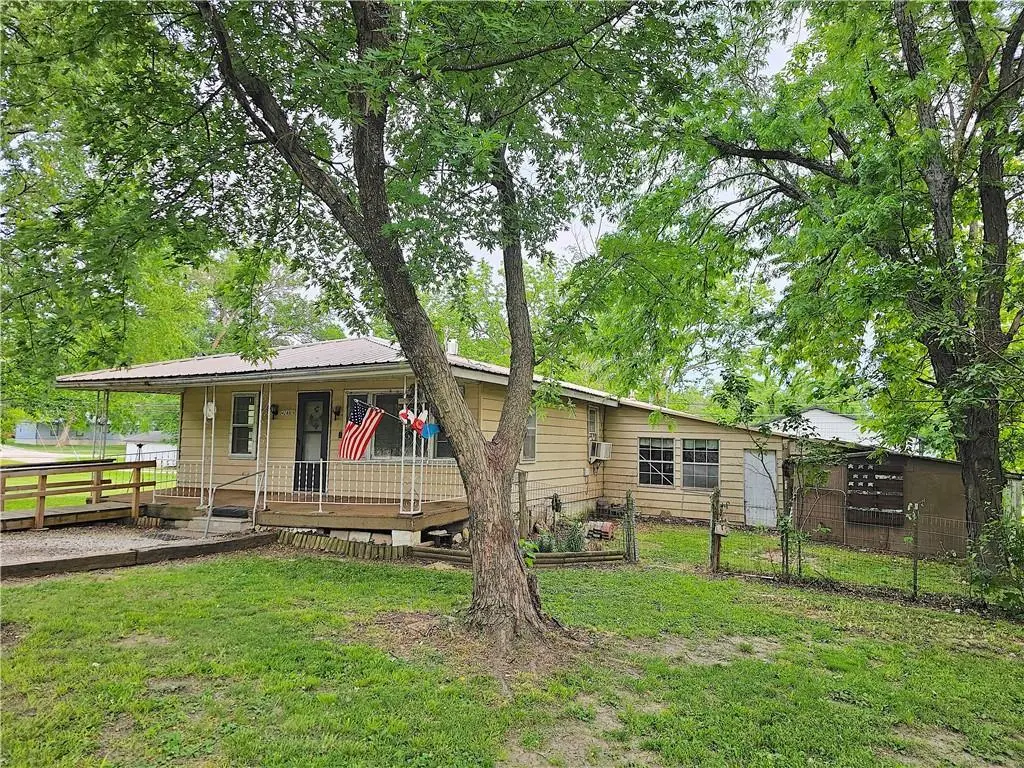
428 E 5th Ave · Garnett, KS
Flood risk 1/10 · Minimal
- FEMA flood zone
- X (unshaded)
- Chance of flooding over 30 yrs
- 0.0%
- Est. flood insurance / yr
- $507 – $1,088
Fire risk 5/10 · Moderate
- Est. fire insurance / yr
- $1,154 – $2,142
Heat risk 4/10 · Minor
- Hot days now (above 109°F)
- 7 days/yr
- Hot days in 30 yrs
- 18 days/yr
Wind risk 2/10 · Minimal
- Chance of severe wind over 30 yrs
- —
Air-quality risk 2/10 · Minimal
- Unhealthy air days now
- 1 days/yr
- Unhealthy air days in 30 yrs
- 1 days/yr
Risk factors via First Street. Map © Google.
Why this score? — see what drove the B- grade
The composite is a weighted blend of 9 inputs, each scored 0–100. Each bar is that input's sub-score; the figure is the points it added to the 100-point composite (weight × sub-score).
- Cash flow +30.0/30.0
- DSCR +10.0/10.0
- 1% rule +8.3/10.0
- ARV discount +7.5/15.0
- Livability +3.5/5.0
- Schools +2.8/10.0
- Rent growth +2.5/5.0
- Condition / age +2.5/5.0
- Appreciation +1.4/10.0
$85,000
🖨 Deal sheet (PDF) 📄 Offer letter ✓ Due diligence
Key facts
- Newer electric panel
- Newer flooring
- Large front porch
Tags
Property features AI
Finance
- Other: Not in a flood plain
- HOA & community: No association fees
Exterior
- Parking: Attached 1-car garage
- Utilities: Public water; Public sewer
- Home design: Single-family residence; Residential property; Bungalow style; Living area approximately 1,586 above-grade
- Construction: Metal siding; Composition roof; Crawl space foundation; Home built approximately 51–75 years ago
- Exterior features: Front porch; Shed(s); City lot
Interior
- Kitchen: Dishwasher; Vinyl flooring in kitchen
- Bedrooms: 3 bedrooms (all on the main level)
- Flooring: Carpet in living, dining and bedrooms; Vinyl in kitchen, laundry and bathroom
- Bathrooms: 1 full bathroom with shower (main level)
- Heating & cooling: Natural gas heating; Window air conditioning units
- Interior features: Ceiling fans; Enclosed porch; Bungalow floor plan
- Laundry & utility: Dedicated laundry room with vinyl flooring (main level)
Neighborhood map
What this means for you Summary
Snapshot
- This is a 3-bed/1.0-bath single-family listed at $85k.
Deal economics
- At list price, monthly cash flow is $358 ($4k/yr) — positive.
- The deal already cash-flows at list — no discount required.
- Meets the 1% rule at list price ($1k rent vs $85k).
- Recommended offer: $82k (3.0% below list) — sets the bar for market timing.
- Cap rate 11.4% vs local median 2.9% in Garnett — top-decile yield for the area; either an underpriced asset or a hidden risk that comps aren't pricing in. Stress-test before assuming the spread holds.
Location & tenants
- Location reads 70/100 on livability (#154 in KS) — a middle-class / working-renter tenant base. Strengths: cost of living A+, housing A+, health & safety A+; Watch: employment D, amenities F, commute F.
- Garnett (rural): math 34% / reading 32% proficiency, ranked #85 of 169 in KS (top 50%) — families likely to look elsewhere, expect single-tenant / working-renter base with shorter leases.
- Zoned schools: Garnett Elementary School (math 38% / reading 43%, grade F, #309 of 684 statewide, top 45%, 433 students, 63% FRL); Anderson County Jr/Sr High School (math 32% / reading 22%, grade F, #85 of 327 statewide, top 29%, 426 students, 47% FRL) — zoned schools average 55% FRL vs 37% district-wide (17 pts higher); higher-poverty schools than district average — tighter screening recommended.
- Market conditions: 33 active listings in the ZIP; 23 units permitted in Anderson County in 2024 (0 in 5+ unit buildings).
Forward outlook
- Local home prices are declining (-3.0%/yr); year-one equity from $588 of loan paydown is wiped out by about $3k of value loss. Plan a longer hold.
- Anderson County population projected at -25% by 2050 — secular population decline; favor cash flow + early exit over multi-decade hold.
- At projected returns (-3.0% appreciation + 3.0% rent growth), your $24k cash investment doubles in ~7 years — after that, you're playing with house money.
Negotiation context
- It's been on market 36 days — a 3% lower offer ($82k) is reasonable based on typical stale-listing flexibility.
- Current owner paid $30k; list at $85k implies a 183% gain — meaningful room to come down on a strong offer.
Risks & watch-outs
- Climate carrying-cost: moderate wildfire risk — expect insurance premiums to compound above CPI over the hold.
Questions for the listing agent
- It's been on market 36 days. Have you received any prior offers? Is the seller open to a 3% concession, seller financing, or rate buy-down credit?
- Built in 1973 — when were the roof, HVAC, electrical panel, plumbing, and water heater last replaced?
- Is there a deadline driving the sale (1031 exchange, divorce, estate, relocation)? That informs how much negotiation room exists.
- Schools are D-rated, which usually means shorter tenancies and higher turnover. Who's the typical renter profile here, and what's been the actual vacancy rate?
- What's the average days-on-market for RENTAL listings here right now (not sales)? A rising rental-DOM trend means longer vacancies and softer asking-rent achievability than the comps imply.
- What's the recent tenant-quality profile in this submarket — average credit score on applications, eviction rate, late-payment / NSF rate, and stable-employment percentage? A property-management company in the area should have these aggregated.
- How much new for-sale + rental construction is in the pipeline within 1–3 miles? Heavy new supply typically softens prices + rents 12–24 months out; constrained supply supports both.
Investment metrics
- 1% rule
- 1.33% ✓
- Cap rate
- 11.35%
- Cash-on-cash
- 18.07%
- DSCR
- 1.80
- GRM
- 6.2
CMA / ARV
- ARV (on-the-fly)
- $222,040
- Comps found
- 12
Show comp detail 12 sales within ~0.75 mi
| Address | Dist | Beds/Ba | Sqft | Sold | Price | $/sf | Match |
|---|---|---|---|---|---|---|---|
| 410 E 6th Ave | 0.07mi | 3/2.0 | 1,480 (-7%) | 2mo | $225,000 | $152 | 80 |
| 505 E 2nd Ave | 0.27mi | 3/1.0 | 1,533 (-3%) | 7mo | $169,000 | $110 | 76 |
| 532 E 2nd Ave | 0.26mi | 3/2.0 | 1,608 (+1%) | 10mo | $175,000 | $109 | 74 |
| 623 E Monroe Ave | 0.53mi | 3/1.0 | 1,553 (-2%) | 10mo | $197,000 | $127 | 64 |
| 618 E 7th Ave | 0.23mi | 2/2.0 (-1) | 1,737 (+10%) | 3mo | $110,000 | $63 | 62 |
| 315 Spruce St | 0.48mi | 3/2.5 | 1,568 (-1%) | 11mo | $219,000 | $140 | 61 |
| 505 N Pine St | 0.62mi | 3/2.0 | 1,612 (+2%) | 8mo | $228,000 | $141 | 57 |
| 200 N Cedar St | 0.40mi | 2/3.0 (-1) | 1,664 (+5%) | 5mo | $270,000 | $162 | 56 |
| 510 N Cedar St | 0.57mi | 4/2.0 (+1) | 1,680 (+6%) | 1mo | $228,000 | $136 | 54 |
| 227 W 2nd St | 0.63mi | 3/2.5 | 1,729 (+9%) | 1mo | $274,750 | $159 | 49 |
| 315 E Monroe Ave | 0.47mi | 3/1.5 | 1,768 (+12%) | 11mo | $150,000 | $85 | 48 |
| 424 N Cedar St | 0.52mi | 3/2.0 | 1,822 (+15%) | 2mo | $284,500 | $156 | 46 |
Match score weights: distance 35% · size 25% · config 20% · recency 20%. Top-matched comps best support the ARV.
Projected returns pro-forma
-3.0% appreciation · 3.0% rent growth · sell at horizon
- IRR
- 9.6%
- Equity multiple
- 1.38×
- Total profit
- $9,036
- Equity at exit
- $12,674
- IRR
- 18.8%
- Equity multiple
- 2.56×
- Total profit
- $37,202
- Equity at exit
- $7,349
Cash invested: $23,800 (down + closing). Projections, not guarantees.
Landlord ↔ Tenant lean methodology
- Overall (STATE)
- 83 Strongly Landlord-Friendly
- State Kansas
- 83 Strongly Landlord-Friendly · R+10
- County
- — inherits STATE
- City
- — inherits STATE
ZIP-level market 66032
- Home prices YoY
- -2.6%
- Active inventory
- 33
- Price-to-rent
- 6.2×
Monthly cashflow live
- Estimated rent
- $1,134 medium interval (Pro) →
- Mortgage (P&I)
- −$446
- Tax from tax record
- −$57 /mo · $678/yr
- Insurance
- −$35
- HOA
- −$0
- Vacancy / Maint / Mgmt
- −$238
- Net cashflow
- $358
Break-even live
Sensitivity live
| Price | -10% $406 | -5% $382 | +0% $358 | +5% $334 | +10% $310 |
|---|---|---|---|---|---|
| Rent | -10% $269 | -5% $314 | +0% $358 | +5% $403 | +10% $448 |
| Rate | -1.0pp $401 | -0.5pp $380 | base $358 | +0.5pp $336 | +1.0pp $314 |
UW: 25.0% down · 7.5% · 30yr · 1.5% tax · 5.0% vac · 8.0% maint · 8.0% mgmt
Financing live
Cash to close
- Down payment
- $21,250
- Closing costs
- $2,550
- Reserves months
- —
- Total cash needed
- —
Loan-product check · same deal, 3 products live
Conventional
25% down · 7.5% · 30yr
- Down + closing
- —
- Monthly P&I
- —
- Monthly cashflow
- —
- DSCR
- —
- Eligible?
- —
Personal DTI + credit; lowest rate.
DSCR
20% down · 8.5% · 30yr
- Down + closing
- —
- Monthly P&I
- —
- Monthly cashflow
- —
- DSCR
- —
- Eligible?
- —
No personal income docs; deal must DSCR.
Hard money
10% down · 12.0% · 12mo
- Down + closing
- —
- Monthly P&I
- —
- Monthly cashflow
- —
- DSCR
- —
- Eligible?
- —
Short-term bridge; refi at stabilization.
Listing history 20 events
-
2026-06-21days on market $85,000 Active Under Contract 36 DOM
-
2026-06-21statusdays on market $85,000 Active Under Contract 35 DOM
-
2026-06-18days on market $85,000 Active 33 DOM
-
2026-06-17days on market $85,000 Active 32 DOM
-
2026-06-16days on market $85,000 Active 31 DOM
-
2026-06-15days on market $85,000 Active 30 DOM
-
2026-06-14price $85,000 Active 28 DOM
-
2026-06-13days on market $90,000 Active 28 DOM
-
2026-06-12days on market $90,000 Active 27 DOM
-
2026-06-09days on market $90,000 Active 24 DOM
-
2026-06-08days on market $90,000 Active 23 DOM
-
2026-06-07days on market $90,000 Active 22 DOM
-
2026-06-05days on market $90,000 Active 20 DOM
-
2026-06-04days on market $90,000 Active 18 DOM
-
2026-06-02days on market $90,000 Active 17 DOM
-
2026-06-01days on market $90,000 Active 16 DOM
-
2026-05-31days on market $90,000 Active 15 DOM
-
2026-05-31days on market $90,000 Active 14 DOM
-
2026-05-16$90,000 Active
-
2008-04-01soldstatus $30,000
ⓘ Source: listings_history table (triggers on properties + properties_extension) + one-shot
backfill from property_details.listing_events for pre-trigger history.
Tax reassessment forecast KS · Resets to sale price
- Current annual tax
- $678 · $57/mo
- Projected year-2 tax
- $1,198 · $100/mo
- Expected delta
- +$520/yr (+$43/mo · 76.7%)
ⓘ Screening estimate from a state-policy table — verify with the county assessor before closing.
Climate risk First Street
- Flood 1/10 Low FEMA zone X (unshaded) · 0% chance over 30 yrs
- Wildfire 5/10 Major
- Heat 4/10 Moderate 7 d/yr ≥109°F today · 18 d/yr by 30 yrs out
- Wind 2/10 Low
- Air quality 2/10 Low 1 unhealthy d/yr today · 1 by 30 yrs out
Nearby sold comps map
Loading sold comps map…
Walkable amenities ~0.75 mi
Loading nearby amenities…
Taxation est. · year 1
- Rental income
- $13,611
- − Mortgage interest
- −$4,761
- − Property taxes
- −$678
- − Insurance
- −$425
- − Repairs & maintenance
- −$1,089
- − Management
- −$1,089
- − Depreciation
- −$2,473
- Taxable income
- $3,096
- Est. tax owed @ 24.0%
- −$743
- After-tax cash flow
- $3,557/yr
For passive investors: Depreciation is non-cash, so a rental often shows a tax loss while cash-flowing — sheltering income. Rental losses are passive: they offset passive income freely, and up to $25,000/yr can offset ordinary (W-2) income if you actively participate and your MAGI is under $100k (phasing out to $0 by $150k); unused losses carry forward. On sale, claimed depreciation is recaptured at up to 25%, and gains may owe capital-gains tax (a 1031 exchange can defer both). Figures are a year-1 estimate at your 24.0% rate — not tax advice; consult a CPA.
Schools (NCES district)
- District
- Garnett
- NCES district ID
- 2006450
- Math proficiency
- 34% ▼ -5.00%
- Reading proficiency
- 32% ▼ -6.00%
- Median HH income
- $41,150
- Composite
- 27.86/100
- National rank
- #6876
- State rank
- #85 of 169 in KS
Livability — Garnett
- Score
- 70/100
- State rank
- #154
- US rank
- #7405
Category grades
Schools grade is shown separately in the Schools card above.
Census & demographics
- Census place
- Garnett, KS
- Population (ZIP)
- 5,133
Population outlook (Anderson County) Hauer SSP2
- Today (2025)
- 7,231 people
- By 2030
- 6,890 · -4.7%
- By 2040
- 6,171 · -14.7%
- By 2050
- 5,446 · -24.7%
- By 2075
- 4,078 · -43.6%
- By 2100
- 2,817 · -61.0%
Race, ethnicity, and origin ACS 2023
- Neighborhood character
- Predominantly White (90%)
- Race & ethnicity
- White 90% Two or more races 8% Hispanic / Latino 2%
- Common ancestry
- Slovak 3% Polish 2% Serbian 1%
- Languages at home
- 91% English-only · German/W. Germanic 7% Spanish 1%
Political lean MEDSL · Anderson
- 2024 margin
- Solid R (+59.8) · D 19.3% · R 79.1% · Other 1.6%
- 2008→2024 swing
- -27.0pp toward R · 2008: -32.7pp · 2024: -59.8pp
- All cycles
- 2024: R+59.8 2020: R+56.7 2016: R+52.5 2012: R+40.0 2008: R+32.7
Not yet ingested
- Civics
- —
Market trends
- HPI YoY
- ▼ -7.17%
- Current HPI
- 272.75
- Rent YoY
- —
- Metro
- —
- State GDP YoY
- —
- F500 in state
- 0
Price history
+200.0% since first listed2 events — show timeline
- 2026-05-16 Listed $90,000 Heartland MLS as Distributed by MLS Grid
- 2008-04-01 Sold (Public Records) $30,000 Public Records
Property tax history
+3.4%/yrLatest (2025): $678 · +3.1% YoY. Source: county tax records.
Cash-flow waterfall
monthlySold comps — $/sqft
last 12 mo · ≤1 miLoading sold comps…