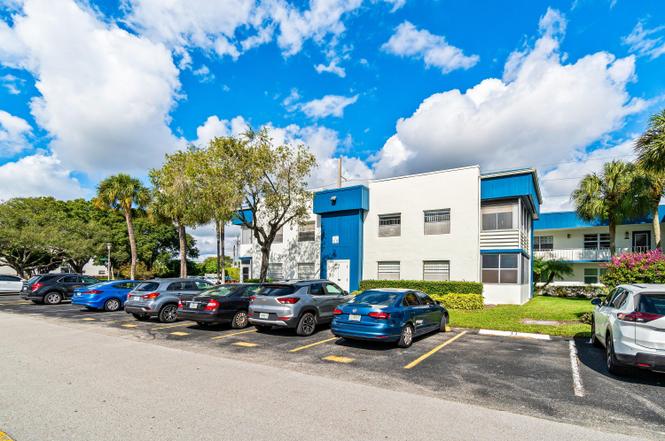
508 Normandy K #508 · Delray Beach, FL
Flood risk 1/10 · Minimal
- FEMA flood zone
- X (unshaded)
- Chance of flooding over 30 yrs
- 0.0%
- Est. flood insurance / yr
- $507 – $1,088
Fire risk 1/10 · Minimal
- Est. fire insurance / yr
- $947 – $1,759
Heat risk 9/10 · Severe
- Hot days now (above 107°F)
- 6 days/yr
- Hot days in 30 yrs
- 22 days/yr
Wind risk 10/10 · Severe
- Chance of severe wind over 30 yrs
- 99.0%
Air-quality risk 3/10 · Minor
- Unhealthy air days now
- 2 days/yr
- Unhealthy air days in 30 yrs
- 3 days/yr
Risk factors via First Street. Map © Google.
Why this score? — see what drove the C+ grade
The composite is a weighted blend of 9 inputs, each scored 0–100. Each bar is that input's sub-score; the figure is the points it added to the 100-point composite (weight × sub-score).
- Cash flow +24.4/30.0
- 1% rule +10.0/10.0
- DSCR +7.9/10.0
- ARV discount +7.5/15.0
- Schools +4.3/10.0
- Livability +3.9/5.0
- Rent growth +3.6/5.0
- Condition / age +2.5/5.0
- Appreciation +0.0/10.0
$94,999
🖨 Deal sheet 📄 Offer letter ✓ Due diligence
Listing remarks
Welcome to this top-floor end-unit condo located within a private, gated community, offering added privacy, natural light, and a peaceful setting. The desirable end-unit position provides extra windows and quiet living, while a well-maintained air conditioning system replaced just a few years ago adds comfort and efficiency. Appliances are in excellent condition, making this home truly move-in ready. Enjoy RESORT-STYLE LIVING WITH INCREDIBLE AMENITIES INCLUDING POOLS, TENNIS, PICKLEBALL, AND A FULL CLUBHOUSE, perfect for both relaxation and an active lifestyle. From poolside afternoons to social and recreational activities, this community offers a vacation-like experience year-round. A fant
Key facts
- Incredible amenities
- End unit
- Resort style living
Tags
Property features AI
Finance
- Other: Senior community; Pets not allowed
- Financial info: Has association (monthly fee)
- HOA & community: Monthly HOA with amenities; HOA includes cable TV, insurance, grounds maintenance, and water; Association amenities: indoor pool, outdoor pool, tennis courts, pickleball courts, shuffleboard court, billiard room, community room, courtesy bus, golf course access
Exterior
- Utilities: Cable available; Municipal water available
- Home design: Condominium; 2 stories; Southeast facing; Resale property
- Construction: Concrete/CBS construction; Flat roof; Built as part of a multi-story building
- Exterior features: Porch; Not waterfront
Interior
- Kitchen: Dishwasher
- Bedrooms: 2 main-level bedrooms
- Flooring: Laminate flooring
- Bathrooms: 2 full bathrooms (main level)
- Heating & cooling: Central heating; Central air conditioning
- Interior features: Stacked bedroom layout; Blinds
- Laundry & utility: Washer hookup
Neighborhood map
What this means for you Summary
Snapshot
- This is a 2-bed/2.0-bath condo listed at $95k.
Deal economics
- At list price, monthly cash flow is $193 ($2k/yr) — positive.
- The deal already cash-flows at list — no discount required.
- Meets the 1% rule at list price ($2k rent vs $95k).
- Recommended offer: $84k (12.0% below list) — sets the bar for market timing.
- Cap rate 8.7% vs local median 4.3% in Delray Beach — top-decile yield for the area; either an underpriced asset or a hidden risk that comps aren't pricing in. Stress-test before assuming the spread holds.
Location & tenants
- Location reads 77/100 on livability (#202 in FL, #3,160 nationally) — a middle-class / working-renter tenant base. Strengths: housing A+, health & safety A+, commute A-; Watch: cost of living C-, crime D-, amenities F.
- Palm Beach (suburban): math 46% / reading 53% proficiency, ranked #34 of 73 in FL (top 47%) — families likely to look elsewhere, expect single-tenant / working-renter base with shorter leases.
- Zoned schools: Orchard View Elementary School (math 48% / reading 47%, grade D, #1,182 of 2,144 statewide, top 55%, 596 students, 76% FRL); Spanish River Community High School (math 64% / reading 74%, grade B, #63 of 667 statewide, top 10%, 2,578 students, 25% FRL) — zoned schools at 50% FRL track the district average.
- Market conditions: Rents rising fast (+4.3%/yr); 546 active listings in the ZIP; 40 comparable units currently listed for rent nearby; rentals at typical pace (median 25d on market — plan ~3-4 weeks tenant-placement turnaround); 3,974 units permitted in Palm Beach County in 2024 (1,012 in 5+ unit buildings).
- This rent runs 38% of the median local income ($62k/yr) — at the standard rent-burdened threshold; future hikes will face affordability resistance.
Forward outlook
- Local home prices are declining (-3.0%/yr); year-one equity from $657 of loan paydown is wiped out by about $3k of value loss. Plan a longer hold.
- Palm Beach County population projected at +30% by 2050 — long-run rental-demand tailwind backs the buy-and-hold thesis.
- At projected returns (-3.0% appreciation + 4.3% rent growth), your $27k cash investment doubles in ~9 years — after that, you're playing with house money.
Negotiation context
- It's been on market 143 days — a 12% lower offer ($84k) is reasonable based on typical stale-listing flexibility.
Risks & watch-outs
- Watch-outs: HOA is 36% of rent.
- Climate carrying-cost: severe wind risk, 99% chance of damaging wind over 30y; extreme-heat days projected 6→22/yr by 2055 (HVAC capex compounding) — expect insurance premiums to compound above CPI over the hold.
Questions for the listing agent
- It's been on market 143 days. Have you received any prior offers? Is the seller open to a 12% concession, seller financing, or rate buy-down credit?
- Built in 1979 — when were the roof, HVAC, electrical panel, plumbing, and water heater last replaced?
- What does the HOA fee cover, when was the last increase, and are there any pending special assessments or reserve-fund shortfalls?
- Any open or pending special assessments — roof, HVAC, plumbing, elevator, façade? What's the per-unit balance and payoff schedule, and is the seller paying it off at close or rolling it to the buyer?
- Why hasn't it sold? Are there any deal-killer items the seller is aware of (foundation, flood, title, zoning, code violations)?
- Is there a deadline driving the sale (1031 exchange, divorce, estate, relocation)? That informs how much negotiation room exists.
- Schools are B-rated — typically a magnet for longer-tenancy family renters. What's the average tenant stay here, and is there a school-zone premium baked into asking?
- Crime grade is D in this area — have there been break-ins, vandalism, or insurance claims at this property in the last 3 years? What carrier currently insures it and at what premium?
- What's the average days-on-market for RENTAL listings here right now (not sales)? A rising rental-DOM trend means longer vacancies and softer asking-rent achievability than the comps imply.
- What's the recent tenant-quality profile in this submarket — average credit score on applications, eviction rate, late-payment / NSF rate, and stable-employment percentage? A property-management company in the area should have these aggregated.
- How much new apartment / multifamily construction is in the pipeline within 1–3 miles? Heavy new supply (>2% of stock underway) typically softens rents 12–24 months out; light construction supports rent growth.
Investment metrics
- 1% rule
- 2.08% ✓
- Cap rate
- 8.72%
- Cash-on-cash
- 8.69%
- DSCR
- 1.39
- GRM
- 4.0
CMA / ARV
No comps found within radius.
Projected returns pro-forma
-3.0% appreciation · 4.28% rent growth · sell at horizon
- IRR
- -0.1%
- Equity multiple
- 1.00×
- Total profit
- $-87
- Equity at exit
- $14,165
- IRR
- 12.1%
- Equity multiple
- 2.07×
- Total profit
- $28,468
- Equity at exit
- $8,214
Cash invested: $26,600 (down + closing). Projections, not guarantees.
Landlord ↔ Tenant lean methodology
- Overall (STATE)
- 87 Strongly Landlord-Friendly
- State Florida
- 87 Strongly Landlord-Friendly · R+3
- County
- — inherits STATE
- City
- — inherits STATE
ZIP-level market 33484
- Rents YoY
- 4.3%
- Active inventory
- 546
- Price-to-rent
- 4.0×
Monthly cashflow live
- Estimated rent
- $1,976 high interval (Pro) →
- Mortgage (P&I)
- −$498
- Tax est. 1.5%
- −$119 /mo · $1,425/yr
- Insurance
- −$40
- HOA
- −$712
- Vacancy / Maint / Mgmt
- −$415
- Net cashflow
- $193
Break-even live
UW: 25.0% down · 7.5% · 30yr · 1.5% tax · 5.0% vac · 8.0% maint · 8.0% mgmt
Financing live
Cash to close
- Down payment
- $23,750
- Closing costs
- $2,850
- Reserves months
- —
- Total cash needed
- —
Loan-product check · same deal, 3 products live
Conventional
25% down · 7.5% · 30yr
- Down + closing
- —
- Monthly P&I
- —
- Monthly cashflow
- —
- DSCR
- —
- Eligible?
- —
Personal DTI + credit; lowest rate.
DSCR
20% down · 8.5% · 30yr
- Down + closing
- —
- Monthly P&I
- —
- Monthly cashflow
- —
- DSCR
- —
- Eligible?
- —
No personal income docs; deal must DSCR.
Hard money
10% down · 12.0% · 12mo
- Down + closing
- —
- Monthly P&I
- —
- Monthly cashflow
- —
- DSCR
- —
- Eligible?
- —
Short-term bridge; refi at stabilization.
Rent comps 40 comps
| Address | Beds | Baths | Sqft | Rent | $/sqft | DOM | Units | Dist |
|---|---|---|---|---|---|---|---|---|
| 559 Normandy Ln #559 Delray Beach, FL | 2.0 | 2.0 | 907 | $1,650 | $1.82 | 24d | 1 | 0.02mi |
| 586 Normandy Ln #586 Delray Beach, FL | 2.0 | 2.0 | 907 | $1,750 | $1.93 | 24d | 1 | 0.02mi |
| 244 Normandy Ln Delray Beach, FL | 2.0 | 2.0 | 907 | $2,400 | $2.65 | 11d | 1 | 0.02mi |
| 729 Normandy P Delray Beach, FL | 2.0 | 2.0 | 907 | $1,600 | $1.76 | 24d | 1 | 0.02mi |
| 825 Normandy R Delray Beach, FL | 2.0 | 2.0 | 905 | $3,350 | $3.70 | 17d | 1 | 0.02mi |
| 708 Normandy O Delray Beach, FL | 2.0 | 2.0 | 907 | $3,000 | $3.31 | 24d | 1 | 0.02mi |
| 705 Normandy Ln Unit 705 Delray Beach, FL | 2.0 | 2.0 | 907 | $2,600 | $2.87 | 24d | 1 | 0.02mi |
| 226 Normandy E Delray Beach, FL | 1.0 | 1.5 | 760 | $1,200 | $1.58 | 24d | 1 | 0.02mi |
| 70 Normandy B Delray Beach, FL | 2.0 | 2.0 | 907 | $1,695 | $1.87 | 24d | 1 | 0.02mi |
| 816 Normandy Q Delray Beach, FL | 1.0 | 1.5 | 760 | $1,475 | $1.94 | 3d | 1 | 0.02mi |
| 394 Normandy I Delray Beach, FL | 2.0 | 2.0 | 907 | $1,600 | $1.76 | 24d | 1 | 0.02mi |
| 137 Normandy Ln Unit 137 Delray Beach, FL | 2.0 | 2.0 | 906 | $1,895 | $2.09 | 24d | 1 | 0.02mi |
| 122 Normandy C Delray Beach, FL | 2.0 | 2.0 | 907 | $1,450 | $1.60 | 5d | 1 | 0.02mi |
| 185 Normandy D Delray Beach, FL | 1.0 | 1.5 | 760 | $1,499 | $1.97 | 14d | 1 | 0.02mi |
| 122 Normandy C Delray Beach, FL | 2.0 | 2.0 | 907 | $1,500 | $1.65 | 22d | 1 | 0.02mi |
| 864 Normandy Ln Unit 864 Delray Beach, FL | 1.0 | 1.5 | 760 | $1,750 | $2.30 | 24d | 1 | 0.02mi |
| 122 Normandy C Delray Beach, FL | 2.0 | 2.0 | 907 | $1,450 | $1.60 | 12d | 1 | 0.02mi |
| 900 Normandy S Delray Beach, FL | 2.0 | 2.0 | 907 | $1,500 | $1.65 | 24d | 1 | 0.02mi |
| 176 Piedmont D Delray Beach, FL | 2.0 | 2.0 | 910 | $1,600 | $1.76 | 24d | 1 | 0.18mi |
| 111 Normandy Ln Delray Beach, FL | 1.0 | 1.5 | 726 | $1,450 | $2.00 | 2d | 1 | 0.19mi |
| 7 Piedmont a Delray Beach, FL | 2.0 | 2.0 | 910 | $2,200 | $2.42 | 3d | 1 | 0.19mi |
| 368 Piedmont H Unit H Delray Beach, FL | 2.0 | 2.0 | 910 | $1,850 | $2.03 | 24d | 1 | 0.20mi |
| 322 Piedmont G Delray Beach, FL | 2.0 | 2.0 | 910 | $1,800 | $1.98 | 7d | 1 | 0.20mi |
| 322 Piedmont G Delray Beach, FL | 2.0 | 2.0 | 910 | $2,000 | $2.20 | 14d | 1 | 0.20mi |
| 499 Piedmont K Delray Beach, FL | 2.0 | 2.0 | 907 | $2,800 | $3.09 | 24d | 1 | 0.21mi |
| 341 Piedmont H Unit H Delray Beach, FL | 2.0 | 2.0 | 907 | $1,650 | $1.82 | 14d | 1 | 0.21mi |
| 224 Piedmont F #224 Delray Beach, FL | 1.0 | 1.5 | 760 | $1,200 | $1.58 | 24d | 1 | 0.21mi |
| 370 Piedmont Trl Unit 370 Delray Beach, FL | 1.0 | 2.0 | 760 | $1,700 | $2.24 | 24d | 1 | 0.21mi |
| 370 Piedmont H Delray Beach, FL | 1.0 | 1.5 | 760 | $1,600 | $2.11 | 24d | 1 | 0.21mi |
| 137 Piedmont Way Unit 137 Delray Beach, FL | 2.0 | 2.0 | 1040 | $2,300 | $2.21 | 11d | 1 | 0.23mi |
| 166 Piedmont Way Delray Beach, FL | 2.0 | 2.0 | 910 | $1,600 | $1.76 | 24d | 1 | 0.23mi |
| 523 Piedmont E Unit 523 Delray Beach, FL | 2.0 | 2.0 | 1044 | $1,750 | $1.68 | 24d | 1 | 0.24mi |
| 120 Normandy C Delray Beach, FL | 1.0 | 1.5 | 760 | $1,495 | $1.97 | 7d | 1 | 0.24mi |
| 344 Piedmont Trl Delray Beach, FL | 2.0 | 2.0 | 910 | $1,600 | $1.76 | 24d | 1 | 0.26mi |
| 794 Normandy Q Delray Beach, FL | 2.0 | 2.0 | 907 | $1,800 | $1.98 | 17d | 1 | 0.26mi |
| 492 Piedmont Ct Delray Beach, FL | 2.0 | 2.0 | 1040 | $2,200 | $2.12 | 24d | 1 | 0.28mi |
| 514 Piedmont K Delray Beach, FL | 1.0 | 1.5 | 792 | $1,690 | $2.13 | 24d | 1 | 0.30mi |
| 514 Piedmont K Unit k Delray Beach, FL | 1.0 | 1.5 | 792 | $1,690 | $2.13 | 3d | 1 | 0.30mi |
| 974 Normandy Trl #974 Delray Beach, FL | 2.0 | 2.0 | 907 | $1,800 | $1.98 | 24d | 1 | 0.31mi |
| 322 Seville N Delray Beach, FL | 1.0 | 1.5 | 720 | $1,495 | $2.08 | 24d | 1 | 0.35mi |
HOA detail condo
- Monthly dues
- $712 · $8,544/yr
- Likely covers
- poolsecurity
- Assessments
- None detected in remarks — confirm with the listing agent.
Listing history 13 events
-
2026-06-18days on market $94,999 Active 143 DOM
-
2026-06-17days on market $94,999 Active 142 DOM
-
2026-06-16days on market $94,999 Active 141 DOM
-
2026-06-15days on market $94,999 Active 140 DOM
-
2026-06-13days on market $94,999 Active 138 DOM
-
2026-06-09days on market $94,999 Active 134 DOM
-
2026-06-07days on market $94,999 Active 132 DOM
-
2026-06-04days on market $94,999 Active 129 DOM
-
2026-06-03days on market $94,999 Active 128 DOM
-
2026-06-01days on market $94,999 Active 126 DOM
-
2026-05-31days on market $94,999 Active 125 DOM
-
2026-03-01price $94,999
-
2026-01-26$99,000 Active
ⓘ Source: listings_history table (triggers on properties + properties_extension) + one-shot
backfill from property_details.listing_events for pre-trigger history.
Climate risk First Street
- Flood 1/10 Low FEMA zone X (unshaded) · 0% chance over 30 yrs
- Wildfire 1/10 Low
- Heat 9/10 Extreme 6 d/yr ≥107°F today · 22 d/yr by 30 yrs out
- Wind 10/10 Extreme 99% chance of damaging wind over 30 yrs
- Air quality 3/10 Moderate 2 unhealthy d/yr today · 3 by 30 yrs out
Nearby sold comps map
Loading sold comps map…
Walkable amenities ~0.75 mi
Loading nearby amenities…
Taxation est. · year 1
- Rental income
- $23,712
- − Mortgage interest
- −$5,321
- − Property taxes
- −$1,425
- − Insurance
- −$475
- − Repairs & maintenance
- −$1,897
- − Management
- −$1,897
- − HOA
- −$8,544
- − Depreciation
- −$2,764
- Taxable income
- $1,389
- Est. tax owed @ 24.0%
- −$333
- After-tax cash flow
- $1,977/yr
For passive investors: Depreciation is non-cash, so a rental often shows a tax loss while cash-flowing — sheltering income. Rental losses are passive: they offset passive income freely, and up to $25,000/yr can offset ordinary (W-2) income if you actively participate and your MAGI is under $100k (phasing out to $0 by $150k); unused losses carry forward. On sale, claimed depreciation is recaptured at up to 25%, and gains may owe capital-gains tax (a 1031 exchange can defer both). Figures are a year-1 estimate at your 24.0% rate — not tax advice; consult a CPA.
Schools (NCES district)
- District
- Palm Beach
- NCES district ID
- 1201500
- Math proficiency
- 46% ▼ -16.00%
- Reading proficiency
- 53% ▼ -4.00%
- Median HH income
- $53,943
- Composite
- 42.72/100
- National rank
- #3160
- State rank
- #34 of 73 in FL
Livability — Delray Beach
- Score
- 77/100
- State rank
- #202
- US rank
- #3160
Category grades
Schools grade is shown separately in the Schools card above.
Census & demographics
- County
- Palm Beach County · 1,438,312 people
- City population
- 123,167
- Metro
- Miami-Fort Lauderdale-Pompano Beach, FL
- Population (ZIP)
- 26,208
- Household income
- $62,151
- Rent vs Own
- Severe rent burden
- 991.0
Population outlook (Palm Beach County) Hauer SSP2
- Today (2025)
- 1,637,487 people
- By 2030
- 1,743,255 · +6.5%
- By 2040
- 1,948,712 · +19.0%
- By 2050
- 2,132,979 · +30.3%
- By 2075
- 2,530,027 · +54.5%
- By 2100
- 2,706,979 · +65.3%
Race, ethnicity, and origin ACS 2023
- Neighborhood character
- Predominantly White (74%)
- Race & ethnicity
- White 74% Hispanic / Latino 14% Two or more races 10% Black 5% Asian 2%
- Hispanic origin (detail)
- Puerto Rican 2% Cuban 2%
- Common ancestry
- Scotch-Irish 7% Romanian 6% Italian 2%
- Foreign-born
- 23% · Canada, Jamaica, China
- Languages at home
- 76% English-only · Spanish 13% Russian/Polish/Slavic 3% French/Haitian/Cajun 3%
Political lean MEDSL · Palm Beach
- 2024 margin
- Toss-up / Even · D 50.0% · R 49.2%
- 2008→2024 swing
- -22.1pp toward R · 2008: 22.9pp · 2024: 0.8pp
- All cycles
- 2024: D+0.8 2020: D+12.8 2016: D+15.3 2012: D+17.0 2008: D+22.9
Not yet ingested
- Civics
- —
Market trends
- HPI YoY
- ▼ -232.73%
- Current HPI
- 254.5016
- Rent YoY
- ▲ 4.28%
- Metro
- Miami-Fort Lauderdale-Pompano Beach, FL
- State GDP YoY
- ▲ 3.28%
- F500 in state
- 36
Industry mix (Fortune 500 HQ in FL)
| Industry | F500 HQs | Revenue |
|---|---|---|
| Industrial Technology | 2 | $29B |
|
||
| Insurance | 2 | $17B |
|
||
| Retail | 1 | $60B |
|
||
| Technology Distribution | 1 | $58B |
|
||
| Homebuilding | 1 | $35B |
|
||
| Technology Manufacturing | 1 | $35B |
|
||
Price history
-4.0% since first listed2 events — show timeline
- 2026-03-01 Price Changed $94,999 Beaches MLS
- 2026-01-26 Listed $99,000 Beaches MLS
Cash-flow waterfall
monthlySold comps — $/sqft
last 12 mo · ≤1 miLoading sold comps…