 Multi-family
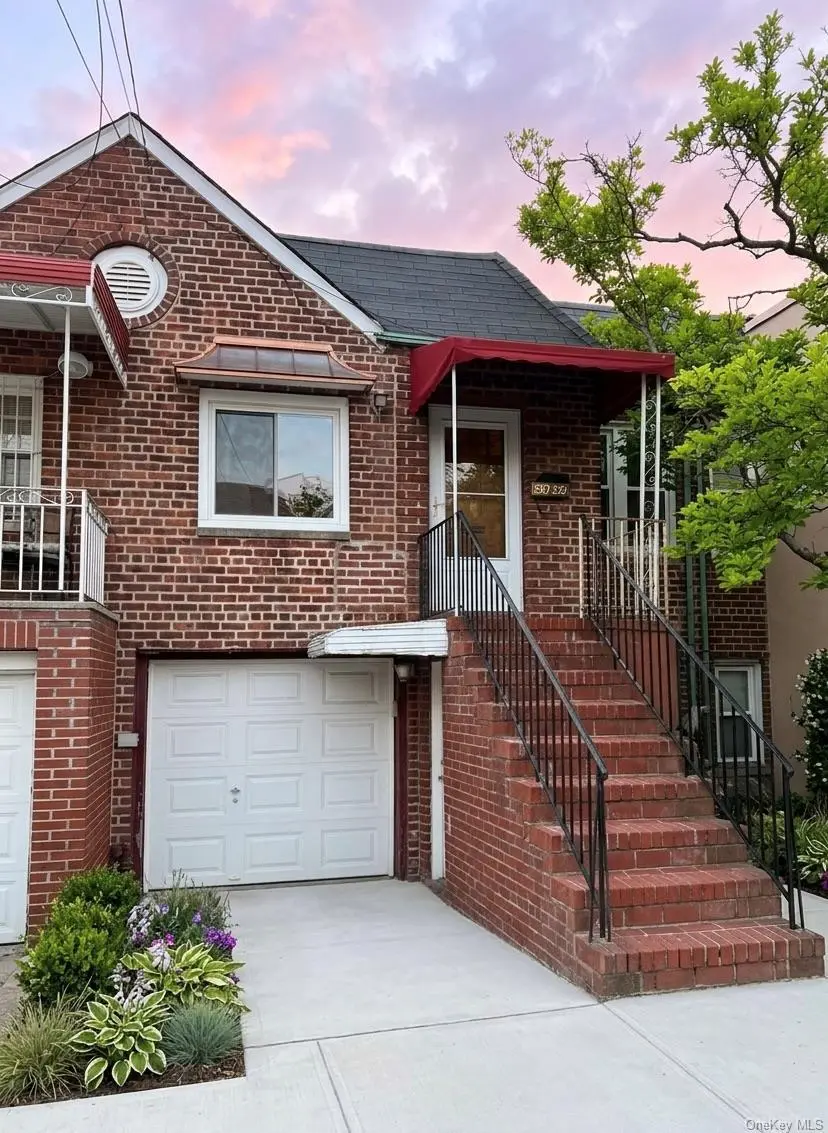
59-32 164th St · New York, NY
Flood risk 1/10 · Minimal
- FEMA flood zone
- X (unshaded)
- Chance of flooding over 30 yrs
- 0.0%
- Est. flood insurance / yr
- $507 – $1,088
Fire risk 1/10 · Minimal
- Est. fire insurance / yr
- $691 – $1,283
Heat risk 6/10 · Moderate
- Hot days now (above 99°F)
- 7 days/yr
- Hot days in 30 yrs
- 15 days/yr
Wind risk 6/10 · Moderate
- Chance of severe wind over 30 yrs
- 27.0%
Air-quality risk 4/10 · Minor
- Unhealthy air days now
- 6 days/yr
- Unhealthy air days in 30 yrs
- 6 days/yr
Risk factors via First Street. Map © Google.
Why this score? — see what drove the D+ grade
The composite is a weighted blend of 9 inputs, each scored 0–100. Each bar is that input's sub-score; the figure is the points it added to the 100-point composite (weight × sub-score).
- Cash flow +13.0/30.0
- ARV discount +12.4/15.0
- Schools +5.0/10.0
- Rent growth +4.1/5.0
- DSCR +3.9/10.0
- Livability +3.8/5.0
- 1% rule +3.3/10.0
- Condition / age +2.5/5.0
- Appreciation +0.0/10.0
$818,000
🖨 Deal sheet (PDF) 📄 Offer letter ✓ Due diligence
Multi-family units
County records classify this as Multi-Family (2-4 Unit). Listing-text estimate: 1 unit. estimate disagrees with records
Listing remarks
Newly renovated — a perfect opportunity for both end-users and investors. Separate entrances for the first and second floors offer excellent flexibility and privacy. The first floor features 1 bedroom, 1 living room, 1 full bathroom, and a kitchen. The second floor offers 2 bedrooms, 1 living room, 1 full bathroom, a kitchen, plus in-unit washer and dryer. The property also includes a private backyard which can be accessed from the 1st floor or the deck of the 2nd floor, an indoor garage, and an additional driveway parking space. Excellent investment potential with strong rental income possibilities. Ideally located just south of Kissena Park, near the I495 highway. Only a 3-minute wa
Key facts
- Private backyard
- Investment potential
- Separate entrances
Tags
Property features AI
Exterior
- Parking: Driveway; Garage; Two parking spaces (one garage space)
- Utilities: Public sewer; Water connected; Electricity connected; Natural gas connected; Cable available; Trash collection (public)
- Home design: Duplex
- Construction: Brick construction
- Exterior features: Garden; Back yard; Front yard
Interior
- Kitchen: Eat-in kitchen; Galley-style layout
- Bedrooms: One 1-bedroom unit; One 2-bedroom unit
- Bathrooms: Two full bathrooms
- Heating & cooling: Natural gas heating; Wall/window air conditioning units
- Interior features: First-floor bedroom; First-floor full bath; Ceiling fans; Eat-in kitchen; Formal dining room; Galley-style kitchen; Deck
Neighborhood map
What this means for you Summary
Snapshot
- This is a 3-bed/2.0-bath multifamily listed at $818k.
Deal economics
- At list price, monthly cash flow is $-41 ($-487/yr) — negative.
- To cash-flow at today's rent, offer at most $811k (0.9% below list).
- To meet the 1% rule (rent ≥ 1% of price), the offer needs to be $675k (17.4% below list).
- Recommended offer: $675k (17.4% below list) — sets the bar for 1% rule.
- Cap rate 6.2% vs local median 2.6% in New York — top-decile yield for the area; either an underpriced asset or a hidden risk that comps aren't pricing in. Stress-test before assuming the spread holds.
Location & tenants
- Location reads 75/100 on livability (#268 in NY, #4,188 nationally) — a middle-class / working-renter tenant base. Strengths: amenities A+, commute A+, health & safety A; Watch: crime F, cost of living F.
- Zoned schools: Elm Tree Elementary School (math 27% / reading 52%, grade F, #1,444 of 2,108 statewide, top 71%, 806 students, 94% FRL); Is 227 Louis Armstrong (math 52% / reading 69%, grade B+, #153 of 729 statewide, top 21%, 1,528 students, 68% FRL); Francis Lewis High School (math 97% / reading 92%, grade A+, #117 of 1,100 statewide, top 11%, 4,265 students, 70% FRL).
- Market conditions: Rents rising fast (+6.2%/yr); 133 active listings in the ZIP; 29 comparable units currently listed for rent nearby; rentals at typical pace (median 20d on market — plan ~3-4 weeks tenant-placement turnaround); solid renter incomes; 5,302 units permitted in Queens County in 2024 (4,918 in 5+ unit buildings).
- At $6,754/mo this rent would consume 100% of the median local household income ($81k/yr) (locally 1876% of renters already pay >50% of income on rent) — very limited rent-growth headroom before tenants either downsize or default.
Forward outlook
- Local home prices are declining (-3.0%/yr); year-one equity from $6k of loan paydown is wiped out by about $25k of value loss. Plan a longer hold.
- Queens County population projected at +16% by 2050 — long-run rental-demand tailwind backs the buy-and-hold thesis.
Negotiation context
- It's been on market 19 days — a 2% lower offer ($806k) is reasonable based on typical stale-listing flexibility.
- 5 sale attempts since 9y ago with the ask held roughly flat each time — persistent listings suggest the price (not the market) is what's stuck; bring a comps-based counter.
- Current owner paid $585k; 40% above their basis — modest negotiation headroom, anchor on the comps not their cost.
Risks & watch-outs
- Watch-outs: built in 1935 — expect roof / HVAC / electrical / plumbing capex.
- Climate carrying-cost: major wind risk, 27% chance of damaging wind over 30y; extreme-heat days projected 7→15/yr by 2055 (HVAC capex compounding) — expect insurance premiums to compound above CPI over the hold.
Questions for the listing agent
- What do current leases actually rent for vs. the listed asking? Can we see a recent rent roll and the last 12 months of T-12 income?
- Built in 1935 — when were the roof, HVAC, electrical panel, plumbing, and water heater last replaced?
- Is there a deadline driving the sale (1031 exchange, divorce, estate, relocation)? That informs how much negotiation room exists.
- Schools are B-rated — typically a magnet for longer-tenancy family renters. What's the average tenant stay here, and is there a school-zone premium baked into asking?
- Crime grade is F in this area — have there been break-ins, vandalism, or insurance claims at this property in the last 3 years? What carrier currently insures it and at what premium?
- The area grade is low — what's the realistic commute time and amenity access for the typical tenant pool here? Any planned neighborhood developments (good or bad) we should know about?
- What's the average days-on-market for RENTAL listings here right now (not sales)? A rising rental-DOM trend means longer vacancies and softer asking-rent achievability than the comps imply.
- What's the recent tenant-quality profile in this submarket — average credit score on applications, eviction rate, late-payment / NSF rate, and stable-employment percentage? A property-management company in the area should have these aggregated.
- How much new apartment / multifamily construction is in the pipeline within 1–3 miles? Heavy new supply (>2% of stock underway) typically softens rents 12–24 months out; light construction supports rent growth.
Investment metrics
- 1% rule
- 0.83% ✗
- Cap rate
- 6.23%
- Cash-on-cash
- -0.21%
- DSCR
- 0.99
- GRM
- 10.1
CMA / ARV
- ARV (on-the-fly)
- $918,204
- Comps found
- 3
Show comp detail 3 sales within ~0.75 mi
| Address | Dist | Beds/Ba | Sqft | Sold | Price | $/sf | Match |
|---|---|---|---|---|---|---|---|
| 59-28 159 St | 0.24mi | 3/2.0 | 1,552 (+9%) | 11mo | $998,000 | $643 | 65 |
| 57-25 156th St | 0.40mi | 4/2.0 (+1) | 1,560 (+9%) | 13mo | $980,000 | $628 | 50 |
| 154-18 65th Ave | 0.50mi | 3/1.5 | 1,550 (+8%) | 15mo | $1,100,000 | $710 | 48 |
Match score weights: distance 35% · size 25% · config 20% · recency 20%. Top-matched comps best support the ARV.
Projected returns pro-forma
-3.0% appreciation · 6.24% rent growth · sell at horizon
- IRR
- -13.3%
- Equity multiple
- 0.51×
- Total profit
- $-112,475
- Equity at exit
- $121,966
- IRR
- -0.1%
- Equity multiple
- 0.99×
- Total profit
- $-1,840
- Equity at exit
- $70,726
Cash invested: $229,040 (down + closing). Projections, not guarantees.
Landlord ↔ Tenant lean methodology
- Overall (CITY)
- 0 Strongly Tenant-Friendly
- State New York
- 15 Strongly Tenant-Friendly · D+10
- County
- — inherits STATE
- City New York
- 0 Strongly Tenant-Friendly · D+34
ZIP-level market 11365
- Rents YoY
- 6.2%
- Active inventory
- 133
- Price-to-rent
- 33.4×
Monthly cashflow live
- Estimated rent
- $6,754 medium interval (Pro) →
- Mortgage (P&I)
- −$4,290
- Tax from tax record
- −$746 /mo · $8,949/yr
- Insurance
- −$341
- HOA
- −$0
- Vacancy / Maint / Mgmt
- −$1,418
- Net cashflow
- $-41
Break-even live
Sensitivity live
| Price | -10% $422 | -5% $191 | +0% $-41 | +5% $-272 | +10% $-504 |
|---|---|---|---|---|---|
| Rent | -10% $-574 | -5% $-307 | +0% $-41 | +5% $226 | +10% $493 |
| Rate | -1.0pp $371 | -0.5pp $167 | base $-41 | +0.5pp $-253 | +1.0pp $-468 |
3-unit breakdown (identical units grouped — click to expand)
| Units | Beds | Baths | Est. rent |
|---|---|---|---|
| 1× unit | 1 | 1 | $2,040 |
| 2× units | 2 | 1 | $4,714 |
| #2 | 2 | 1 | $2,357 |
| #3 | 2 | 1 | $2,357 |
| Total (3 units) | $6,754 | ||
UW: 25.0% down · 7.5% · 30yr · 1.5% tax · 5.0% vac · 8.0% maint · 8.0% mgmt
Financing live
Cash to close
- Down payment
- $204,500
- Closing costs
- $24,540
- Reserves months
- —
- Total cash needed
- —
Loan-product check · same deal, 3 products live
Conventional
25% down · 7.5% · 30yr
- Down + closing
- —
- Monthly P&I
- —
- Monthly cashflow
- —
- DSCR
- —
- Eligible?
- —
Personal DTI + credit; lowest rate.
DSCR
20% down · 8.5% · 30yr
- Down + closing
- —
- Monthly P&I
- —
- Monthly cashflow
- —
- DSCR
- —
- Eligible?
- —
No personal income docs; deal must DSCR.
Hard money
10% down · 12.0% · 12mo
- Down + closing
- —
- Monthly P&I
- —
- Monthly cashflow
- —
- DSCR
- —
- Eligible?
- —
Short-term bridge; refi at stabilization.
Rent comps 29 comps
| Address | Beds | Baths | Sqft | Rent | $/sqft | DOM | Units | Dist |
|---|---|---|---|---|---|---|---|---|
| 165-23 65th Ave Unit 2 Flushing, NY | 3.0 | 1.5 | 1200 | $3,000 | $2.50 | 24d | 1 | 0.18mi |
| 61-41 173rd St Unit 3rd fl Flushing, NY | 2.0 | 1.0 | 1000 | $2,500 | $2.50 | 24d | 1 | 0.48mi |
| 56-40 175th Pl Unit A Fresh Meadows, NY | 4.0 | 2.0 | 1500 | $3,600 | $2.40 | 4d | 1 | 0.61mi |
| 150-32 Booth Memorial Ave Unit 1st FL Flushing, NY | 3.0 | 2.0 | 1080 | $3,350 | $3.10 | 19d | 1 | 0.71mi |
| 15022 58th Ave Flushing, NY | 3.0 | 1.5 | 1224 | $3,300 | $2.70 | 17d | 1 | 0.71mi |
| 7157 161 St Apt 5B Flushing, NY | 2.0 | 2.0 | 1100 | $2,600 | $2.36 | 26d | 1 | 0.72mi |
| 175-03 Peck Ave Unit 2 Floor Flushing, NY | 3.0 | 2.0 | 1824 | $4,200 | $2.30 | 8d | 1 | 0.74mi |
| 71-82 Parsons Blvd Unit 516 Kew Gardens Hills, NY | 2.0 | 1.5 | 900 | $3,500 | $3.89 | 5d | 1 | 0.83mi |
| 71-82 Parsons Blvd Unit 303 Kew Gardens Hills, NY | 2.0 | 1.5 | 900 | $4,000 | $4.44 | 16d | 1 | 0.83mi |
| 71-82 Parsons Blvd Unit 503 Kew Gardens Hills, NY | 2.0 | 1.5 | 900 | $4,000 | $4.44 | 26d | 1 | 0.83mi |
| 5644 187th St Fresh Meadows, NY | 4.0 | 3.0 | 1147 | $4,800 | $4.18 | 21d | 1 | 0.88mi |
| 14803 61st Rd Flushing, NY | 3.0 | 2.0 | 1594 | $3,600 | $2.26 | 26d | 1 | 0.89mi |
| 76-40 170th St #1 Flushing, NY | 2.0 | 1.0 | 924 | $2,800 | $3.03 | 1d | 1 | 1.00mi |
| 142-23 Booth Memorial Ave Unit 1 Flushing, NY | 3.0 | 1.0 | 1064 | $3,200 | $3.01 | 7d | 1 | 1.03mi |
| 16910 77th Rd Fresh Meadows, NY | 3.0 | 3.0 | 1200 | $4,300 | $3.58 | 26d | 1 | 1.04mi |
| 7731 166th St Fresh Meadows, NY | 3.0 | 1.0 | 1000 | $2,700 | $2.70 | 10d | 1 | 1.07mi |
| 78-18 166th St Unit 2 Flushing, NY | 4.0 | 1.5 | 1000 | $3,650 | $3.65 | 12d | 1 | 1.14mi |
| 16525 Union Tpke Fresh Meadows, NY | 2.0 | 1.0 | 1000 | $2,900 | $2.90 | 26d | 1 | 1.15mi |
| 15325 77th Rd Flushing, NY | 3.0 | 1.0 | 1224 | $3,200 | $2.61 | 26d | 1 | 1.15mi |
| 16612 Union Tpke Fresh Meadows, NY | 3.0 | 2.5 | 1292 | $4,900 | $3.79 | 26d | 1 | 1.17mi |
| 80-12 165th St Unit 3 Jamaica, NY | 2.0 | 1.5 | 960 | $2,800 | $2.92 | 26d | 1 | 1.21mi |
| 17814 80th Dr Jamaica, NY | 3.0 | 1.5 | 1100 | $5,499 | $5.00 | 6d | 1 | 1.30mi |
| 15006 78th Rd Flushing, NY | 4.0 | 2.5 | 1332 | $4,700 | $3.53 | 21d | 1 | 1.34mi |
| 79-29 153rd St Unit 1st Floor Flushing, NY | 3.0 | 1.0 | 1200 | $3,000 | $2.50 | 26d | 1 | 1.35mi |
| 8023 159th St Jamaica, NY | 3.0 | 1.5 | 1392 | $3,000 | $2.16 | 7d | 1 | 1.35mi |
| 43-12 157th St Unit 2 Flushing, NY | 3.0 | 1.5 | 1100 | $3,200 | $2.91 | 26d | 1 | 1.38mi |
| 43-15 156th St Unit 2nd Fl Flushing, NY | 4.0 | 2.0 | 1600 | $2,995 | $1.87 | 16d | 1 | 1.38mi |
| 4255 Colden St Unit 16P Flushing, NY | 2.0 | 1.5 | 1150 | $3,500 | $3.04 | 5d | 1 | 1.45mi |
| 4334 192nd St Unit 2 Queens, NY | 2.0 | 1.0 | 900 | $2,650 | $2.94 | 4d | 1 | 1.47mi |
Listing history 12 events
-
2026-06-21days on market $818,000 Active 19 DOM
-
2026-06-18days on market $818,000 Active 16 DOM
-
2026-06-17days on market $818,000 Active 15 DOM
-
2026-06-16days on market $818,000 Active 14 DOM
-
2026-06-15days on market $818,000 Active 13 DOM
-
2026-06-13days on market $818,000 Active 11 DOM
-
2026-06-09days on market $818,000 Active 7 DOM
-
2026-06-08days on market $818,000 Active 6 DOM
-
2026-06-08days on market $818,000 Active 5 DOM
-
2026-06-04days on market $818,000 Active 2 DOM
-
2026-06-02remarks 693-char remark
-
2026-06-02$818,000 Active 1 DOM
ⓘ Source: listings_history table (triggers on properties + properties_extension) + one-shot
backfill from property_details.listing_events for pre-trigger history.
Tax reassessment forecast NY · Partial reset (capped growth)
- Current annual tax
- $8,949 · $746/mo
- Projected year-2 tax
- $11,387 · $949/mo
- Expected delta
- +$2,438/yr (+$203/mo · 27.2%)
ⓘ Screening estimate from a state-policy table — verify with the county assessor before closing.
Climate risk First Street
- Flood 1/10 Low FEMA zone X (unshaded) · 0% chance over 30 yrs
- Wildfire 1/10 Low
- Heat 6/10 Major 7 d/yr ≥99°F today · 15 d/yr by 30 yrs out
- Wind 6/10 Major 27% chance of damaging wind over 30 yrs
- Air quality 4/10 Moderate 6 unhealthy d/yr today · 6 by 30 yrs out
Nearby sold comps map
Loading sold comps map…
Walkable amenities ~0.75 mi
Loading nearby amenities…
Taxation est. · year 1
- Rental income
- $81,048
- − Mortgage interest
- −$45,821
- − Property taxes
- −$8,949
- − Insurance
- −$4,090
- − Repairs & maintenance
- −$6,484
- − Management
- −$6,484
- − Depreciation
- −$23,796
- Taxable loss
- −$14,576
- Est. tax savings @ 24.0%
- +$3,498
- After-tax cash flow
- $3,011/yr
For passive investors: Depreciation is non-cash, so a rental often shows a tax loss while cash-flowing — sheltering income. Rental losses are passive: they offset passive income freely, and up to $25,000/yr can offset ordinary (W-2) income if you actively participate and your MAGI is under $100k (phasing out to $0 by $150k); unused losses carry forward. On sale, claimed depreciation is recaptured at up to 25%, and gains may owe capital-gains tax (a 1031 exchange can defer both). Figures are a year-1 estimate at your 24.0% rate — not tax advice; consult a CPA.
Schools (NCES district)
No district data.
Livability — New York
- Score
- 75/100
- State rank
- #268
- US rank
- #4188
Category grades
Schools grade is shown separately in the Schools card above.
Census & demographics
- Census place
- New York, NY
- County
- Queens County · 1,914,869 people
- City population
- 7,731,280
- Metro
- New York-Newark-Jersey City, NY-NJ-PA
- Population (ZIP)
- 42,322
- Household income
- $81,258
- Rent vs Own
- Severe rent burden
- 1876.0
Population outlook (Queens County) Hauer SSP2
- Today (2025)
- 2,546,320 people
- By 2030
- 2,643,059 · +3.8%
- By 2040
- 2,815,563 · +10.6%
- By 2050
- 2,944,423 · +15.6%
- By 2075
- 3,123,338 · +22.7%
- By 2100
- 3,098,688 · +21.7%
Race, ethnicity, and origin ACS 2023
- Neighborhood character
- Highly diverse neighborhood (Simpson 0.71)
- Race & ethnicity
- Asian 43% White 23% Hispanic / Latino 21% Two or more races 11% Black 11%
- Hispanic origin (detail)
- Puerto Rican 7% Dominican 4%
- Common ancestry
- Scotch-Irish 4% Romanian 1% Slovak 1%
- Foreign-born
- 46% · China, Canada, South Korea
- Languages at home
- 41% English-only · Chinese 26% Spanish 13% Korean 8%
Political lean MEDSL · Queens
- 2024 margin
- Strong D (+24.6) · D 62.3% · R 37.7%
- 2008→2024 swing
- -26.2pp toward R · 2008: 50.8pp · 2024: 24.6pp
- All cycles
- 2024: D+24.6 2020: D+45.2 2016: D+53.4 2012: D+58.5 2008: D+50.8
Not yet ingested
- Civics
- —
Market trends
- HPI YoY
- ▼ -298.48%
- Current HPI
- 314.4015
- Rent YoY
- ▲ 6.24%
- Metro
- New York-Newark-Jersey City, NY-NJ-PA
- State GDP YoY
- ▲ 2.60%
- F500 in state
- 92
Industry mix (Fortune 500 HQ in NY)
| Industry | F500 HQs | Revenue |
|---|---|---|
| Financial Services | 10 | $950B |
|
||
| Consumer Goods | 9 | $162B |
|
||
| Insurance | 4 | $225B |
|
||
| Telecommunications | 2 | $144B |
|
||
| Pharmaceuticals | 2 | $112B |
|
||
| Media / Entertainment | 2 | $69B |
|
||
Price history
+12.2% since first listed16 events — show timeline
- 2026-06-02 Listed $818,000 OneKey® MLS as Distributed by MLS Grid
- 2026-05-01 Listing Removed — OneKey® MLS as Distributed by MLS Grid
- 2026-01-21 Price Changed $835,000 OneKey® MLS as Distributed by MLS Grid
- 2025-10-30 Listed $860,000 OneKey® MLS as Distributed by MLS Grid
- 2020-03-15 Listing Removed — OneKey® MLS as Distributed by MLS Grid
- 2019-10-14 Listed $799,000 OneKey® MLS as Distributed by MLS Grid
- 2019-07-01 Listing Removed — OneKey® MLS as Distributed by MLS Grid
- 2019-05-10 Price Changed $799,000 OneKey® MLS as Distributed by MLS Grid
- 2019-03-02 Listed $838,000 OneKey® MLS as Distributed by MLS Grid
- 2017-10-26 Sold (Public Records) $585,000 Public Records
- 2017-10-18 Sold (MLS) $585,000 OneKey® MLS as Distributed by MLS Grid
- 2017-08-18 Pending — OneKey® MLS as Distributed by MLS Grid
- 2017-07-20 Price Changed $629,000 OneKey® MLS as Distributed by MLS Grid
- 2017-05-08 Price Changed $659,999 OneKey® MLS as Distributed by MLS Grid
- 2017-03-28 Price Changed $699,000 OneKey® MLS as Distributed by MLS Grid
- 2017-02-23 Listed $729,000 OneKey® MLS as Distributed by MLS Grid
Property tax history
+7.5%/yrLatest (2025): $8,949 · +3.4% YoY. Source: county tax records.
Cash-flow waterfall
monthlySold comps — $/sqft
last 12 mo · ≤1 miLoading sold comps…