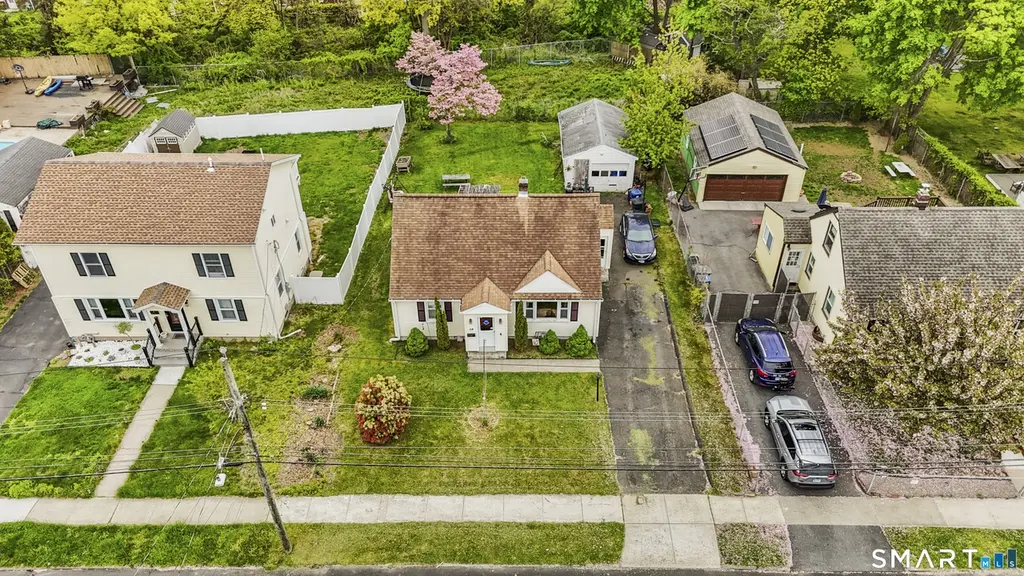
54 Winslow Dr · West Haven, CT
Flood risk 1/10 · Minimal
- FEMA flood zone
- X (unshaded)
- Chance of flooding over 30 yrs
- 0.0%
- Est. flood insurance / yr
- $473 – $860
Fire risk 1/10 · Minimal
- Est. fire insurance / yr
- $829 – $1,539
Heat risk 6/10 · Moderate
- Hot days now (above 96°F)
- 7 days/yr
- Hot days in 30 yrs
- 16 days/yr
Wind risk 6/10 · Moderate
- Chance of severe wind over 30 yrs
- 55.0%
Air-quality risk 4/10 · Minor
- Unhealthy air days now
- 5 days/yr
- Unhealthy air days in 30 yrs
- 7 days/yr
Risk factors via First Street. Map © Google.
Why this score? — see what drove the C- grade
The composite is a weighted blend of 9 inputs, each scored 0–100. Each bar is that input's sub-score; the figure is the points it added to the 100-point composite (weight × sub-score).
- Cash flow +15.4/30.0
- ARV discount +15.0/15.0
- 1% rule +4.9/10.0
- DSCR +4.7/10.0
- Livability +4.2/5.0
- Rent growth +3.5/5.0
- Schools +2.8/10.0
- Condition / age +2.5/5.0
- Appreciation +0.0/10.0
$299,000
🖨 Deal sheet 📄 Offer letter ✓ Due diligence
Listing remarks
Welcome to 54 Winslow Dr, a charming Cape Cod nestled on a quiet street in the desirable West Shore section of West Haven. This 4-bedroom, 1 full bath home offers a flexible layout with two bedrooms and the full bath conveniently located on the main level, and two additional bedrooms upstairs. Enjoy the ease of coastal living with beautiful beaches just minutes away, while still being close to shopping, dining, and all major transportation. The home also features a detached garage, a partially finished basement offering additional usable space, and a nice backyard perfect for relaxing or entertaining. With solid bones and plenty of potential, this is a great opportunity to come in and add y
Key facts
- 7,405 sq ft lot
- Garage
- Built 1951
Property features AI
Finance
- Other: Property listed by Lakeshore Realty
Exterior
- Parking: Detached garage (1-car)
- Utilities: Public water connected; Public sewer connected
- Home design: Single family home
- Construction: Frame construction; Concrete foundation
- Exterior features: Level lot; Vinyl siding; Asphalt shingle roof; Yellow exterior color
Interior
- Kitchen: Oven/Range; Refrigerator; Dishwasher
- Bedrooms: Four bedrooms
- Bathrooms: One full bathroom
- Heating & cooling: Hot air heating; Natural gas heating; Central air conditioning
- Interior features: Seven total rooms; Full, partially finished basement; Central air conditioning
- Laundry & utility: Laundry room on lower level; Domestic hot water
Neighborhood map
What this means for you Summary
Snapshot
- This is a 4-bed/1.0-bath single-family listed at $299k.
Deal economics
- At list price, monthly cash flow is $114 ($1k/yr) — positive.
- The deal already cash-flows at list — no discount required.
- To meet the 1% rule (rent ≥ 1% of price), the offer needs to be $296k (1.1% below list).
- Recommended offer: $296k (1.1% below list) — sets the bar for 1% rule.
- Cap rate 6.8% vs local median 4.3% in West Haven — top-decile yield for the area; either an underpriced asset or a hidden risk that comps aren't pricing in. Stress-test before assuming the spread holds.
Location & tenants
- Location reads 83/100 on livability (#6 in CT, #915 nationally) — a professional / high-income tenant draw. Strengths: commute A+, housing A+, health & safety A+; Watch: schools D+, amenities D.
- West Haven School District (suburban): math 26% / reading 38% proficiency, ranked #121 of 153 in CT (top 79%) — families likely to look elsewhere, expect single-tenant / working-renter base with shorter leases.
- Market conditions: Rents rising (+3.9%/yr); 146 active listings in the ZIP; 5 comparable units currently listed for rent nearby; rentals leasing fast (median 11d on market — plan ~1-2 weeks tenant-placement turnaround); 40% of comp listings sitting > 30 days — soft ceiling on asking rent; 1,059 units permitted in South Central Connecticut Planning Region in 2024 (779 in 5+ unit buildings).
- At $2,957/mo this rent would consume 48% of the median local household income ($74k/yr) (locally 2671% of renters already pay >50% of income on rent) — very limited rent-growth headroom before tenants either downsize or default.
Forward outlook
- Local home prices are declining (-3.0%/yr); year-one equity from $2k of loan paydown is wiped out by about $9k of value loss. Plan a longer hold.
Negotiation context
- Only 4 days on market — expect competitive offers; lowballing is unlikely to land.
- Current owner paid $110k; list at $299k implies a 172% gain — meaningful room to come down on a strong offer.
Risks & watch-outs
- Watch-outs: built in 1951 — expect roof / HVAC / electrical / plumbing capex.
- Climate carrying-cost: major wind risk, 55% chance of damaging wind over 30y; extreme-heat days projected 7→16/yr by 2055 (HVAC capex compounding) — expect insurance premiums to compound above CPI over the hold.
Questions for the listing agent
- Built in 1951 — when were the roof, HVAC, electrical panel, plumbing, and water heater last replaced?
- Is there a deadline driving the sale (1031 exchange, divorce, estate, relocation)? That informs how much negotiation room exists.
- Schools are D-rated, which usually means shorter tenancies and higher turnover. Who's the typical renter profile here, and what's been the actual vacancy rate?
- What's the average days-on-market for RENTAL listings here right now (not sales)? A rising rental-DOM trend means longer vacancies and softer asking-rent achievability than the comps imply.
- What's the recent tenant-quality profile in this submarket — average credit score on applications, eviction rate, late-payment / NSF rate, and stable-employment percentage? A property-management company in the area should have these aggregated.
- How much new for-sale + rental construction is in the pipeline within 1–3 miles? Heavy new supply typically softens prices + rents 12–24 months out; constrained supply supports both.
Investment metrics
- 1% rule
- 0.99% ✗
- Cap rate
- 6.75%
- Cash-on-cash
- 1.64%
- DSCR
- 1.07
- GRM
- 8.4
CMA / ARV
- ARV (median comp)
- $392,278
- List price
- $299,000
- Delta
- -23.78%
- Verdict
- UNDERPRICED
- Comps
- 20 within 1.0 mi
Show comp detail 12 sales within ~0.75 mi
| Address | Dist | Beds/Ba | Sqft | Sold | Price | $/sf | Match |
|---|---|---|---|---|---|---|---|
| 83 Pauline Ave | 0.19mi | 3/2.0 (-1) | 1,200 (0%) | 1mo | $435,000 | $363 | 81 |
| 80 Holcomb St | 0.63mi | 4/1.5 | 1,242 (+4%) | 3mo | $420,000 | $338 | 61 |
| 30 Pauline Ave | 0.14mi | 3/1.0 (-1) | 1,348 (+12%) | 9mo | $375,000 | $278 | 61 |
| 70 Pauline Ave | 0.16mi | 3/2.0 (-1) | 1,320 (+10%) | 8mo | $455,000 | $345 | 60 |
| 46 Central Ave | 0.65mi | 3/1.0 (-1) | 1,152 (-4%) | 2mo | $350,000 | $304 | 56 |
| 25 Belle Cir | 0.28mi | 3/1.0 (-1) | 1,028 (-14%) | 6mo | $400,000 | $389 | 53 |
| 43 Contact Dr | 0.56mi | 3/1.0 (-1) | 1,086 (-10%) | 2mo | $432,000 | $398 | 51 |
| 30 Batt Ln | 0.25mi | 3/2.0 (-1) | 1,380 (+15%) | 8mo | $425,000 | $308 | 48 |
| 19 Kaye Rd | 0.60mi | 3/1.5 (-1) | 1,080 (-10%) | 2mo | $360,000 | $333 | 47 |
| 11 Flaum Dr | 0.61mi | 3/1.0 (-1) | 1,080 (-10%) | 4mo | $290,000 | $269 | 46 |
| 35 Fair Sailing Rd | 0.69mi | 3/1.0 (-1) | 1,116 (-7%) | 13mo | $340,000 | $305 | 40 |
| 64 Central Ave | 0.69mi | 3/1.0 (-1) | 1,361 (+13%) | 14mo | $355,000 | $261 | 29 |
Match score weights: distance 35% · size 25% · config 20% · recency 20%. Top-matched comps best support the ARV.
Projected returns pro-forma
-3.0% appreciation · 3.9% rent growth · sell at horizon
- IRR
- -12.6%
- Equity multiple
- 0.54×
- Total profit
- $-38,327
- Equity at exit
- $44,582
- IRR
- -2.0%
- Equity multiple
- 0.86×
- Total profit
- $-12,136
- Equity at exit
- $25,852
Cash invested: $83,720 (down + closing). Projections, not guarantees.
Landlord ↔ Tenant lean methodology
- Overall (STATE)
- 27 Tenant-Leaning
- State Connecticut
- 27 Tenant-Leaning · D+7
- County
- — inherits STATE
- City
- — inherits STATE
ZIP-level market 06516
- Rents YoY
- 3.9%
- Active inventory
- 146
- Price-to-rent
- 8.4×
Monthly cashflow live
- Estimated rent
- $2,957 high interval (Pro) →
- Mortgage (P&I)
- −$1,568
- Tax from tax record
- −$529 /mo · $6,352/yr
- Insurance
- −$125
- HOA
- −$0
- Vacancy / Maint / Mgmt
- −$621
- Net cashflow
- $114
Break-even live
UW: 25.0% down · 7.5% · 30yr · 1.5% tax · 5.0% vac · 8.0% maint · 8.0% mgmt
Financing live
Cash to close
- Down payment
- $74,750
- Closing costs
- $8,970
- Reserves months
- —
- Total cash needed
- —
Loan-product check · same deal, 3 products live
Conventional
25% down · 7.5% · 30yr
- Down + closing
- —
- Monthly P&I
- —
- Monthly cashflow
- —
- DSCR
- —
- Eligible?
- —
Personal DTI + credit; lowest rate.
DSCR
20% down · 8.5% · 30yr
- Down + closing
- —
- Monthly P&I
- —
- Monthly cashflow
- —
- DSCR
- —
- Eligible?
- —
No personal income docs; deal must DSCR.
Hard money
10% down · 12.0% · 12mo
- Down + closing
- —
- Monthly P&I
- —
- Monthly cashflow
- —
- DSCR
- —
- Eligible?
- —
Short-term bridge; refi at stabilization.
Rent comps 5 comps
| Address | Beds | Baths | Sqft | Rent | $/sqft | DOM | Units | Dist |
|---|---|---|---|---|---|---|---|---|
| 58 Annawon Ave West Haven, CT | 3.0 | 1.0 | 984 | $2,800 | $2.85 | 11d | 1 | 0.36mi |
| 160 Aimes Dr West Haven, CT | 3.0 | 2.0 | 1170 | $3,200 | $2.74 | 44d | 1 | 0.53mi |
| 102 Salem Walk #102 Milford, CT | 3.0 | 1.5 | 1320 | $3,400 | $2.58 | 2d | 1 | 0.61mi |
| 158 Chapel St Unit 2 Milford, CT | 3.0 | 1.0 | 1213 | $1,945 | $1.60 | 44d | 1 | 0.91mi |
| 106 Dawson Ave Unit NA West Haven, CT | 3.0 | 1.5 | 1464 | $3,250 | $2.22 | 2d | 1 | 1.29mi |
Listing history 4 events
-
2026-05-18status Under Contract 744-char remark
-
2026-05-15$299,000 Active 744-char remark
-
2026-05-10historical $299,000 744-char remark
-
1992-06-01soldstatus $110,000
ⓘ Source: listings_history table (triggers on properties + properties_extension) + one-shot
backfill from property_details.listing_events for pre-trigger history.
Tax reassessment forecast CT · Partial reset (capped growth)
- Current annual tax
- $6,352 · $529/mo
- Projected year-2 tax
- $6,375 · $531/mo
- Expected delta
- +$23/yr (+$2/mo · 0.4%)
ⓘ Screening estimate from a state-policy table — verify with the county assessor before closing.
Climate risk First Street
- Flood 1/10 Low FEMA zone X (unshaded) · 0% chance over 30 yrs
- Wildfire 1/10 Low
- Heat 6/10 Major 7 d/yr ≥96°F today · 16 d/yr by 30 yrs out
- Wind 6/10 Major 55% chance of damaging wind over 30 yrs
- Air quality 4/10 Moderate 5 unhealthy d/yr today · 7 by 30 yrs out
Nearby sold comps map
Loading sold comps map…
Walkable amenities ~0.75 mi
Loading nearby amenities…
Taxation est. · year 1
- Rental income
- $35,487
- − Mortgage interest
- −$16,749
- − Property taxes
- −$6,352
- − Insurance
- −$1,495
- − Repairs & maintenance
- −$2,839
- − Management
- −$2,839
- − Depreciation
- −$8,698
- Taxable loss
- −$3,485
- Est. tax savings @ 24.0%
- +$836
- After-tax cash flow
- $2,208/yr
For passive investors: Depreciation is non-cash, so a rental often shows a tax loss while cash-flowing — sheltering income. Rental losses are passive: they offset passive income freely, and up to $25,000/yr can offset ordinary (W-2) income if you actively participate and your MAGI is under $100k (phasing out to $0 by $150k); unused losses carry forward. On sale, claimed depreciation is recaptured at up to 25%, and gains may owe capital-gains tax (a 1031 exchange can defer both). Figures are a year-1 estimate at your 24.0% rate — not tax advice; consult a CPA.
Schools (NCES district)
- District
- West Haven School District
- NCES district ID
- 0904950
- Math proficiency
- 26% ▼ -13.00%
- Reading proficiency
- 38% ▼ -11.00%
- Median HH income
- $52,405
- Composite
- 28.05/100
- National rank
- #6840
- State rank
- #121 of 153 in CT
Livability — West Haven
- Score
- 83/100
- State rank
- #6
- US rank
- #915
Category grades
Schools grade is shown separately in the Schools card above.
Census & demographics
- Census place
- West Haven, CT
- County
- New Haven County · 688,236 people
- City population
- 55,351
- Metro
- New Haven-Milford, CT
- Population (ZIP)
- 55,351
- Household income
- $74,382
- Rent vs Own
- Severe rent burden
- 2671.0
Population outlook (South Central Connecticut County) Hauer SSP2
- By 2040
- 608,362
Race, ethnicity, and origin ACS 2023
- Neighborhood character
- Diverse neighborhood (Simpson 0.68)
- Race & ethnicity
- White 47% Hispanic / Latino 26% Black 18% Two or more races 10% Asian 5%
- Hispanic origin (detail)
- Mexican 3% Puerto Rican 11% Dominican 1%
- Common ancestry
- Romanian 4% Lithuanian 3% Russian 2%
- Foreign-born
- 21% · Canada, Jamaica, China
- Languages at home
- 70% English-only · Spanish 17% Other Indo-European 5% Arabic 3%
Political lean MEDSL · South Central Connecticut
- 2024 margin
- Strong D (+20.1) · D 59.0% · R 38.9% · Other 2.1%
- All cycles
- 2024: D+20.1
Not yet ingested
- Civics
- —
Market trends
- HPI YoY
- ▼ -312.86%
- Current HPI
- 307.0655
- Rent YoY
- ▲ 3.90%
- Metro
- New Haven-Milford, CT
- State GDP YoY
- ▲ 1.06%
- F500 in state
- 38
Industry mix (Fortune 500 HQ in CT)
| Industry | F500 HQs | Revenue |
|---|---|---|
| Industrial Machinery | 4 | $38B |
|
||
| Insurance | 3 | $71B |
|
||
| Financial Services | 2 | $25B |
|
||
| Transportation / Logistics | 2 | $18B |
|
||
| Healthcare | 1 | $247B |
|
||
| Telecommunications | 1 | $55B |
|
||
Price history
+171.8% since first listed4 events — show timeline
- 2026-05-18 Pending — Smart MLS
- 2026-05-15 Listed $299,000 Smart MLS
- 2026-05-10 Coming Soon $299,000 Smart MLS
- 1992-06-01 Sold (Public Records) $110,000 Public Records
Property tax history
+1.0%/yrLatest (2023): $6,352 · +1.8% YoY. Source: county tax records.
Cash-flow waterfall
monthlySold comps — $/sqft
last 12 mo · ≤1 miLoading sold comps…